Individual Differences in Blood Alcohol Concentrations after Moderate Drinking Are Mainly Regulated by Gastric Emptying Rate Together with Ethanol Distribution Volume ()
1. Introduction
Although light to moderate drinking is beneficial to cardiovascular health, heavy drinking often results in health and social problems [1]. Ethanol and its metabolites invoke various physiological and pharmacological effects in human bodies, which develop alcohol-related diseases. Therefore, investigation of the mechanisms of alcohol metabolism is important to regulate the levels of ethanol and its metabolites in order to diminish the harmful effects of drinking on the body. Alcohol metabolism is influenced by drinking conditions, such as the type of beverage, amount of alcohol intake, and drinking with or without food. Genetic and physiological differences in individuals also affect alcohol metabolism.
Alcohol is absorbed from the stomach and the small intestine, and is distributed throughout total body water. After alcohol distribution to the body, most of its elimination takes place by metabolic conversion via alcohol dehydrogenase (ADH) in the liver. Acetaldehyde, the product from ethanol oxidation by ADH, is oxidized to acetate by aldehyde dehydrogenase 2 (ALDH2). The genetic polymorphism of ALDH2*1 and *2 is known to regulate individual tolerance to alcohol and susceptibility to alcohol-related diseases [2]. The ALDH2*2 allele encoding an inactive enzyme protein is responsible for the flushing reaction caused by higher acetaldehyde concentrations after the ingestion of alcohol beverages. Individuals with this allele refrain from excessive drinking due to the adverse reactions, so it is therefore protective against alcoholism [3]. In addition, this genetic polymorphism influences the rate of alcohol metabolism due to the different blood acetaldehyde concentration (BAcH) [4,5]. The genetic polymorphism of alcohol dehydrogenase 1B (ADH1B*1,*2 and *3) also influences the rate of alcohol metabolism because of the differences in ADH1B activity among the genotypes [6]. The amount of habitual alcohol intake may influence the rate of alcohol metabolism because chronic alcohol consumption is known to increase the rate of alcohol metabolism [7]. Moreover, the apparent distribution volume of ethanol (Vd), which correlates with total body water content [8], can be a factor regulating blood alcohol concentration (BAC). Marshall et al. reported that Vd negatively correlated with the area under the curve of ethanol (AUC) [9]. On the other hand, it is known that first pass metabolism (FPM) in the stomach and liver influences BAC [10]. Several studies have suggested that the gastric empting rate (GER) is reduced by eating a meal, the reduction of which delays the absorption of alcohol and increases its FPM to lower BAC [11-13]. Therefore, these internal factors may regulate the levels of blood alcohol via absorption, metabolism or distribution of alcohol in the body, however, it is not clear which are main factors in internal regulation of individual BAC differences.
In this study, we investigated the main factors involved in the internal regulation of individual BAC differences, focusing on the ADH1B genotype, BAcH, amount of habitual alcohol consumption, and pharmacokinetic parameters of BAC, Vd and GER under the same drinking conditions.
2. Materials and Methods
2.1. Experimental Protocol
The Medical Corp Jozenkai Shinagawa East One Medical Clinic Research Ethics Committee approved the proposed study, and informed consent was obtained from every participant. Twenty healthy Japanese males aged from 40 to 59 years old and with the ALDH2*1/*2 genotype were recruited for this study. The ALDH2*1/*2 genotype was adopted in order to investigate the influence of BAcH on BAC because people with ALDH2*1/ *2 exhibit various levels of BAcH after drinking. Amounts of monthly alcohol consumption (g/month) were calculated based on the following questionnaires to each subject: average amount of daily drinking (ml), drinking frequency, and type of alcoholic beverages consumed. The drinking frequency was divided into five categories: every day, 5 to 6 days/week, 3 to 4 days/week, 1 to 2 days/week, and less or equal 3 days/month. The subjects refrained from drinking alcohol for two days, and from eating and drinking (except water) for at least 12 hours before the test. The subjects were given 0.32 g ethanol/kg body weight in the form of commercially available beer (5%, v/v).
2.2. Blood Analyses
Blood samples were collected from the cubital vein in each experimental period. BAC was measured using head space gas chromatography according to the methods of Okada and Mizoi [14]. BAcH was measured using a 2, 4-dinitrophenylhydrazine (DNPH) derivative method for acetaldehyde by ultraviolet detection (365 nm) with a HPLC technique [15]. For estimating GER, we measured both blood glucose levels and gastric inhibitory polypeptide (GIP) of a glucose-dependent insulinotropic polypeptide, because the both parameters are commonly used as indirect methods for measuring GER in various studies [16-21]. Plasma glucose concentrations (PGC, mg/dl) were determined before (0 min) and at 30 min after drinking by a hexokinase method with a routine measurement in a clinical laboratory and ΔPGC (PGC30 min − PGC0 min) was obtained (ΔPGC was used to evaluate nineteen subjects because the fasting PGC of only one subject was more than 126 mg/dl and was a diagnostic criteria of diabetes mellitus in Japan). Serum gastric inhibitory polypeptide concentrations (GIP, pg/ml) were measured at 30 min after drinking using a commercially available enzyme immunoassay kit (Human GIP Assay Kit, Immuno-Biological Laboratories Co., Ltd.).
2.3. Ethanol Kinetic Parameters
The elimination rate of blood ethanol (β value; mg/ml/h) and ethanol disappearance rate from the body (EDR; g/kg/h) were calculated from the slope of the pseudolinear decline of the BAC. Vd (liter/kg) was calculated by dividing the ethanol dose (0.32 g/kg) by C0 (g/liter), which was determined from the y-intercept of the regression line.
2.4. Regression Analyses
We performed simple linear regression (Pearson) analyses about the correlation with BAC-max and these parameters. Then, we used a multiple linear regression analysis (stepwise method) with Dr. SPSS II software (SPSS Inc.) to examine the relationship between BACmax as a dependent variable and GIP, ΔPGC, and Vd as independent variables, as these three parameters indicated significant correlations with BAC-max on the simple linear regression analysis. The inclusion and exclusion criteria were set at 0.05.
3. Results
3.1. Individual Differences of BAC-Time Curves
The BAC (means ± SD) reached 0.42 ± 0.11 mg/ml at 30 min or 0.44 ± 0.08 mg/ml at 60 min after moderate drinking of beer at an ethanol dose of 0.32 g/kg. Twenty subjects showed various levels of BAC with large individual differences; in some cases the BAC-max differed by more than twice among individuals (maximal 0.64 mg/ml vs minimal 0.24 mg/ml, Figure 1). When the BAC-time curve was compared among ADH1B genotypes (*1/*1, *1/*2, and *2/*2), there were no differences in BAC (Figure 2). The frequency ratio of each ADH1B genotype in this study was almost the same as that previously reported in Japanese [22]. In addition, the β value (mg/ml/hr), EDR (g/kg/hr) and Vd (liter/kg) were not different among ADH1B genotypes (β value; 0.13 in *1/*1, 0.12 ± 0.03 in *1/*2, 0.12 ± 0.02 in *2/*2, EDR; 0.07 in *1/*1, 0.08 ± 0.01 in *1/*2, 0.07 ± 0.01 in *2/*2, Vd; 0.58 in *1/*1, 0.66 ± 0.07 in *1/*2, 0.61 ± 0.05 in *2/*2, respectively).
3.2. Regression Analyses with BAC-max
Simple linear regression analysis showed that BAC-max positively correlated with ΔPGC and GIP, but negatively correlated with Vd, as indicated by Pearson’s correlation coefficients (Table 1). However, ΔPGC was excluded by multiple linear regression analysis from model 1 and 2 (partial correlation coefficient; 0.344, p value; 0.176 in the model 2, Table 2). Model 2 was the optimal model in which Vd and GIP significantly correlated with BACmax. “Calculated BAC-max” values, which were calculated from the formula {0.832 + 0.00179*GIP − 0.735*Vd} obtained from model 2 correlated with the measured BAC-max with a higher multiple correlation coefficient (0.842, Figure 3) than that (0.678) in the model 1.
4. Discussion
BAC greatly differed among individuals, even though the subjects were the same sex, age and drank alcohol under the same conditions (Figure 1). In this study, we investigated which factor(s) regulate individual differences in BAC. The ADH1B encoded by the ADH1B*2 allele has a greater enzymatic activity than that of the the ADH1B*1 allele [23]. However, Mizoi et al. [4] previously reported that there were no differences in β60 and EDR among three ADH1B genotypes at a 0.4 g/kg dose of ethanol,

Figure 1. Blood alcohol concentrations (BAC) of each subject after moderate beer drinking.
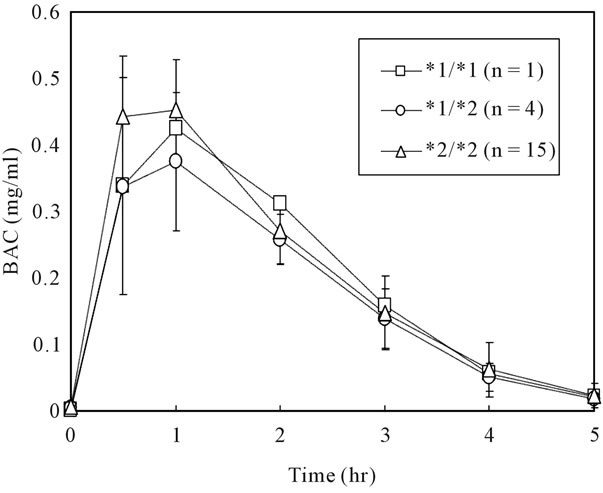
Figure 2. Blood alcohol concentrations (BAC) of each ADH1B genotype after moderate beer drinking. Values (*1/*2, *2/*2) are means and standard deviation.
suggesting no differences in BAC-max among the genotypes. We also confirmed that there were no differences in β60, EDR and BAC-max (or BAC) among the three ADH1B genotypes (Figure 2) in this study using twenty healthy males Japanese with ALDH2*1/*2 genotype.
As demonstrated by the higher rate of β60 and EDR in ALDH2*1/*1 than *1/*2 [4], BAcH influences alcohol metabolism by inhibiting ADH activity [24]. However, BAcH-max showed no significant correlation with BACmax for the ALDH2*1/*2 genotype, as shown by the simple linear regression analysis in this study. This result suggests the differences in BAcH in ALDH2*1/*2 genotype do not influence BAC, although the very large differences in BAcH seen between ALDH2*1/*1 and ALDH2*1/*2 genotypes affect BAC [5].

Table 1. Simple correlation coefficients of BAC-max with each parameter.

Table 2. Multiple linear regression analysis (stepwise method) for BAC-max with Vd, ΔPGC and GIP.
Amounts of monthly ethanol consumption showed no significant correlation with BAC-max either, although chronic alcohol consumption is known to increase the rate of alcohol metabolism [25].
On the other hand, Vd values (liter/kg) was shown to relate to the individual BAC differences with negative correlations by both simple and multiple linear regression analyses (Tables 1 and 2). Although Vd generally indicate the total body water content (liter/kg) of each subject [8], it is changed by drinking conditions via the FPM of ethanol, because it is calculated using the theoretical maximal concentration of blood ethanol (C0). When FPM occurs after drinking, the actual amounts of ethanol into the systemic circulation are lower than the dosage. For example, Vd in the case of drinking with a meal increases more than drinking without a meal because the meal increases FPM. Therefore, total body water content directly measured may be more accurate than Vd to evaluate the factors regulating the differences in individual BAC. FPM in the digestive tract or liver is another factor that affects BAC [26-28]. BAC has been shown to be lower [29] when FPM occurs in the stomach, where two types of ADH isozymes (ADH 3 and 4) are located and contribute to FPM [30]. GER is an important factor in the FPM [31]. Johnson et al. [32] reported that cigarette smoking slowed GER and was associated with reductions in BAC-max. Oneta et al. [33] also reported in a human study that the administration of N-butylscopolamine increased the gastric FPM of ethanol by delaying GER, probably due to an increase in time of ethanol exposure to gastric ADH isozymes. ΔPGC has a positive correlation with GER without directly affecting the gastrointestinal tract [19]. GIP was also shown to be associated with GER because GIP is excreted after nutrients

Figure 3. Correlation of BAC-max and calculated BACmax by multiple linear regression analysis. Closed circles indicate each subject’s data. Calculated BAC-max values were calculated following a formula which was obtained by multiple regression analysis: 0.832 + 0.00179*GIP (pg/ml) – 0.735*Vd (liter/kg).
reach the intestinal tract from the gut [16,17]. The both parameters have been frequently used in various studies dealing with gastric emptying [16-21]. Therefore, serum GIP and ΔPGC were adopted as the parameters of GER in this study. The two parameters significantly correlated with BAC-max (Table 1), indicating that GER regulates individual differences in BAC-max. Moreover, we calculated the “Calculated BAC-max” from the formula {0.832 + 0.00179*GIP − 0.735*Vd}, which was obtained by multiple regression analysis, because GIP and Vd were selected, but ΔPGC was excluded, by the analysis in regression model 2. GIP and ΔPGC are factors which increase after food materials reach duodenum from stomach, but each maximal increases in the blood have temporal difference [34,35], therefore, we speculated that the correlation of both parameters with BACmax was different. As shown to correlation to BAC-max, GIP may be a better indicator than ΔPGC. As a result, the “calculated BAC-max” strongly correlated with the measured BAC-max with a higher multiple correlation coefficient (0.842, in Figure 3).
5. Conclusion
We concluded that the individual differences in BAC after moderate drinking are mainly regulated by GER together with Vd. Thus, the gastrointestinal tract plays an important role in the regulation of individual differences in BAC via FPM, together with the total body water content.