Croplands are decreasing due to the expansion of urban areas into rural communities and to some extent due to sand accumulations. Increases in population numbers, new development, in addition to the accumulation of sand and soil salinity are the major driving force leading to abandonment and shrinking of cropland. The aim of this study was to investigate and assess to what extent agricultural lands are affected by urban development in the Al Hassa oasis, Eastern region in Saudi Arabia by employing Landsat time series data of years 1988, 2000 and 2017 as the main source of information. A set of ground truth, control points (GCPs) was also used besides population census data. Unsupervised classifications approach, Normalized Difference Vegetation Index (NDVI) and change detection methods were used here. Urban area during 2000-2017 exhibits much higher increase compared to 1988-2000, while the arable lands declined to
−3.4% in 1988-2000 and increased to 22% during 2000-2017. The data analysis results provided new accurate numerical information supported by a graphical representation in regard to the decrease and increase in urban and agricultural lands. Therefore the findings of this study should be considered by decision maker for improving and development the agriculture activities in rural and urban communities.
Much research in recent years has focused on the impact of urbanization and land degradation on agricultural activities. These phenomena are important problems globally, regionally, and locally particularly in the rural landscape [1] . Many studies have reported that urban growth has the greatest impact on transforming agricultural lands into other uses [2] [3] [4] . However, it has been found that not only acceleration of urbanization has a significant impact on the amount of land used for food production, but also shifting sand, population increases and soil degradation [1] [5] may have the same effect.
As a response to economic growth worldwide, several industrial countries have adopted new policies to meet that growth; one of these is industrialization [6] . For example, Saudi Arabia since the discovering of the petrol oil in 1923 has shifted from only agricultural dependence to industrial dependence. As a result, this shift has increased the urbanization process [7] . These increases had very consequences for the study area; accelerating urban growth (urbanization), led to high consumption of food and water, and increased internal migration.
According to [7] Eastern region is one of the highest concentrations of population in Saudi Arabia with approximately 3,799,773 populations, and 36.7% houses rented. A recent study by [2] reported that the transformation of agricultural lands can lead to a series of “social, cultural, environmental and economic problems” in recent times or even in the future. One of the most critical issues, when built-up-areas extend into arable lands, is decreasing of agricultural activities and potentially insecurity with respect food supply [1] . Brown [8] has mentioned that amount of valuable cultivation lands have been shifted to others’ land use including road, homes, industries as a result of the urban growth; in Kumasi Metropolis as an example arable lands were declined by 15.6% from 1986 and 2006. Likewise, in Malaysia, as Elhadary et al. [1] reported most of the croplands have been converted to urban uses by several reasons one of them is that most of the owners tend to sell or rent their lands rather than cultivation because of the low income and high-input cost of cultivation.
On the other hand, several studies have reported that urban growth is not the only factor leading to arable land reduction. Land degradation is another significant factor and the impact of this factor might increase in the future as the results of climate change. Reyonlds et al. [9] stated that “Land degradation is frequently associated with vegetation productivity decline over time”. The process of land degradation can lead to vegetation productivity decline by either gradual soil degradation [10] or by land transformation. Land degradation of different types [11] may degrade most of the croplands in many African’s countries. In Sudan for example, sand encroachment threatening croplands in many states (e.g., White Nile, Northern State, and River Nile), [5] [11] for example Salih et al. [11] found that following sand encroachment the normal reaction is shrinking, reduction, and declining of cropland productivity. And therefore, there may be a food gap in the area.
In our study area, this phenomenon was demonstrated by few studies [12] [13] [14] , for instance, Allbed et al. [13] have documented that arable lands in the Al Hassa oasis have been suffering from shifting sand and soil salinity as a major threat. For example, [13] found out that there is a very positive strong correlation between salinity and degradation in vegetation cover, and they detected that change in concentration of soil salinity resulting in a change of vegetation cover density. Al Saud et al. [12] showed that the some of the Al Hassa oasis arable lands have been covered by sand dunes. Their study suggests that a possible cause for these dunes is that the location of Al Hassa oasis surrounded by many deserts (see Plate 1). It is clear that these deserts considered as the main source of these dunes. Holm [15] found out that (“the study area is located in the center of the Arabian peninsula with a total area estimated at 1,060,000 square miles, has a sand cover on at least 300,000 square miles surrounded by large deserts”). This meant that desertification and land degradation with its broad meaning is going to take a place in the study area.
In spite of the considerable amount of literature on the risks of urbanization and land degradation, there are still important gaps with respect information that documents these impacts. Few researchers have addressed and investigated the problem of agricultural land loss in the study area. Previous work has focused only on the causes, they don’t provide any statistical information about the quantity of the transformation of the land, therefore, the current work needed for future development and conservation of the lands. Until today, there are no interesting and significant findings to highlight the hotspot issues about the changing and persistence of agricultural lands in the study area.
To address the gap in data availability with respect to the impact of urbanization on the arable land conversion in Al Hassa’s oasis, Eastern region, Saudi Arabia, we employed well-known and widely used digital image processing techniques and GIS-based tools. We used different sources of data including remote sense satellite images as a primary source of information for land use/cover (LULC) classifications and change assessment [16] , along with other data sources for investigating, assessing and providing a wide preview for the different factors behind the urban expansion and arable lands conversion that have taken place in Al Hassa’s oasis. On the basis of the findings, this paper argues that urbanization and to great extent salinity is the major driving force for Al Hassa’s oasis arable land conversion. Next, we applied an accuracy assessment statistical model using ground truth to measure the degree of accuracy of the final land cover classification results.
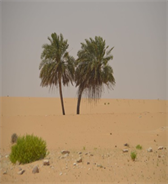
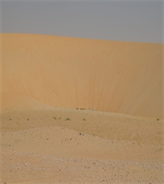
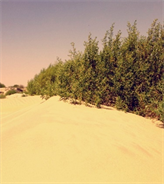
Plate 1. The accumulation of the sand dunes alongside the study area with different size and shape.
This paper is organized as follows section one used to describe the data and methods used in this study, and section two is used to report our findings, while section three and four are used for the discussion of findings, and conclusions.
2. Methodology2.1. Study Area
The present work took place at Al Hassa oasis, Eastern Region in Saudi Arabia. According to [17] the term “oasis” has come to mean “a cluster of palm trees near a waterhole with perhaps a coupled of tents, all encircled by sandy desert”. Whereas Al Hassa name is “an area of vegetation surrounded by desert”. Al-Hassa Oasis is considered to be one of largest agricultural land. It is located in the eastern province of the Kingdom of Saudi Arabia. Al-Hassa is an L-shaped area [17] , lie approximately between 25˚21' to 25˚37' Latitude. N. and 49˚37' Longitude. E. (Figure 1), at an elevation of approximately 130 to 160 metres above sea level [18] [19] ; covering an area of approximately 260 Km2. The selection of the area might be justified by that it is the only cultivated land in Al Hassa province. Moreover, it is reported that the area has long been affected by sand movement and human activities which led to decrease in the lands available for cultivation.
It has been reported in [20] that the area is the important and greatest agricultural area in the eastern region of Saudi Arabia; it is establishing an extension being due to the huge reserves of groundwater. The primary crops grown were dates, wheat, barley, millet, rice, various fruits and vegetables and alfalfa and the most important livestock raised were camels, sheep, goats, cattle and donkeys [21] . Currently, the total cultivated land area within the oasis is approximately 80 km2, of which 92% is planted by date palm [19] .
Furthermore, there are over 51 small towns scattered over the oasis that are either fully or partially surrounded by date palms. In relation to the climate, the area is mainly located between hot-dry and hot-humid conditions because of its closeness to the seashore. Around 12,000 hectare of vegetation cover is a major driving force for the improvement of the climate characteristics [22] . The temperature exceeds 45˚C during the summer season [13] with annual rainfall approximately 488 mm.
Figure 2 shows the population census (in thousands) of Al Hassa Oasis from 1935 to 2016. In 2010 1,067,691 persons were lived in the study area [23] . It increased to nearly 1,063,112 persons in 2014 while in 2016 the population increased to 1,220,000. Data from recent study by Abdelatti et al. [24] reported that the population of Al Hassa oasis rose during the period 1992-2016 from 445,000 in 1992 to 768,000 in 2016. Such an increase in population may require a significant amount of lands for urban development. Consequently, agricultural lands are under pressure and negatively may impact it. Accordingly, the present work is established and carried out by adapting remote sensing data as the main source of information.
2.2. Data Used and Processing
The current investigation involves an in-depth analytical investigation of urbanization and its impact on agricultural lands. To perform this, a qualitative [25] and quantitative approaches to data collection and results interpretation were used. Integration of data from different sources (e.g., field word data, and remote sensing data, available reports and previous studies) to assess changes and trends of the agricultural lands at the study area has been achieved. The primary source of information was from satellite images which were obtained from the Landsat archive data center. Consequently, three satellite imageries were downloaded from the USGS archive website “https://earthexplorer.usgs.gov/”, these are 1) Landsat-5 (TM) for the 1984 and 2000 and 2) Landsat-8 (OLI) for the date 2017 as shown in (Figure 3). The characteristics of the satellite images are provided in (Table 1).
The characteristics of the Landsat satellite images used in the study
In addition to all these the study referred back to different reports and previous studies to formulate and adjusting the objectives and hypothesis and to detect the knowledge gaps related to the research problem.
The initial step for properly accomplishing change detection comparison for unprocessed images and classified images is image preprocessing techniques [26] . Generally speaking, image processing is an essential processing for those photos with 2D elements using a computer capability [27] . Image preprocessing is an operation widely used prior to the main analysis of satellite images [28] . Accordingly, the necessary image preprocessing (i.e., geometric correction, and radiometric calibration) was accomplished. For the first one, we used the image to image registration method; as a result, the images can be overlapped with vector data in a geographic information system (GIS) and used for comparison of land use/cover classifications. While for the second one, we used the methods presented by [29] as a prerequisite for creating high-quality image data. Finally, the concept of tasseled cap transformation was applied to each of the four images using ERDAS 2014 for compressing spectral data into a few bands associated with physical scene characteristics and to make the visual interpretation and digital classification process for the satellite images as easier as possible.
It is a linear transformation of data that projects soil and vegetation information on a single plane in multispectral data space. The results of the TCT produce an image file that consists of three bands that are attributed to soil brightness, vegetation greenness, and soil or vegetation wetness. Detailed information about the idea behind this transformation can be found in the following literature [30] [31] [32] .
The output from the previous methods was used as input for the images classification. In this work a clustering system (i.e., Iterative Self-Organization Data Analysis Techniques (ISODATA) [33] known as unsupervised classification approaches were applied to classify the three preprocessed satellite images into three different land use/cover classes. Firstly this approach classifies the image into a number of unknown classes as an initial step. It is then the analyst’s responsibility [34] to labels each homogenous group of pixels with the suitable class name as described in (Table 2). Managing took place when two or three classes have the same pixel values which mean that they belong to the same feature class. The reason behind choosing this method over other methods it is simplicity comparing to others methods (i.e., sub-pixel; supervised classification methods). All the preprocessing and analysis of data have been carried out using ERDAS IMAGIN software version 2014.
The definition and description of the mainland use/cover used in this study
Land use/cover category
Definition
Description of the categories according to the study area
Agricultural Lands
“This applies to plants without persistent stem or shoots above ground and lacking definite firm structure” [41] . The cover duration is limited to the harvest stage. This category also can be defined as “Urban Vegetated Area” which includes vegetated areas that are enclosed by any kind of urban construction. These areas form isolated patches within the urban area. In addition to irrigated crop.
According to the field observation, most of the agricultural lands are date trees with combined with the mixed crop in between.
Urban lands
“Non-linear built up areas covered by impervious structures adjacent to or connected by streets. This cover is related to centers of population” [41] [42] .
Mixed urban or built-up land (e.g., Residential, commercial, industrial, etc.). But the main impact factor is residential areas with high population figures.
Barren lands and sand dunes
“Areas that are primarily bare usually described by a geologist, soil scientist or geomorphologist (using technical terms like granite rock, rendzina, sand dunes, etc.” The major land cover type Bare Areas is therefore described mainly b the appearance of the surface [41] .
Mostly arable lands covered by sand dunes or mountain areas
According to [35] remote sense data can’t be used without ground truth datasets. Ground truth can be used alongside remote sense data for several reasons as follows: Firstly, assessing the visual interpretation process, secondly, geometric correction of satellite images, and finally, to verify information extracted from remote sense data [36] . Accordingly, fieldwork data were collected in January 2018. GPS device was used for collecting, locating and positioning of ground truths and ground control points (GCPs). A set of about 100 training points was used for several purposes these are a geometric correction, accuracy assessment representing the corresponding feature on the ground, where overall accuracy, commission, and omission [37] statistical information were calculated for each classified images, and for signature evaluation. In the present work to identifying differences in the state of agricultural lands and to get a clear picture about the impact of urban expansion on agricultural activities in the study area a comparison of land cover classifications [38] in between the classified images was carried out
The Normalized Difference Vegetation Index (NDVI) was used in this study as described by [39] for assessment of vegetation cover change. The NDVI is a widely used method for detecting the change in vegetation greenness rate. It is a simple measurement of the differences between red channel reflectance and infrared channel reflectance, by which the area under study can be assessed for agricultural drought [40] . The values of the NDVI generally ranged from −1 to +1. It is clear that the area tend to be covered by vegetation when the value of NDVI is near (+1), if the area is covered by bare soil or bare rock, the NDVI values will be near zero, while if the area is covered by water or sand, the values will be near (−1). In this way, the study area was classified to the desired land cover classes (Table 2). Differencing [34] on two dates of NDVI were subtracted one from another to determine change ∆NDVI image with the positive increase and negative decrease.
People are interested in change detection for several reasons. These are for example; determine the changes that have occurred and extrapolate them to the future, decide on a course of action, or to assess the results of an action or policy [43] . By mapping where and how things move over a period of time, you can gain insight into how they behave in the future. Another reason for mapping change is to predict future needs.
By mapping earth features conditions before and after an action or event, you can predict the impact. You can map change by showing the location and condition of a feature within a different date. Knowing the type of change and the type of features you’re dealing with, how you’re measuring time, and the type of information you need from the analysis will help you decide how to map [43] . Accordingly, there are two types of change:
1) Change in location: mapping change in location helps you see how features behave in the future.
2) Change in character or magnitude: Mapping change in character or magnitude shows you how conditions in a given place have changed [43] . The change can be in the type of feature in a place, for example, the different categories of land cover/use in the study area now, compared to 15 years ago. Or, the change can be in a quantity associated with each feature, for example, the amount of feature class has increased or decreased in each area over the past 15 years.
According to the above description change detection based on dividing the classified images into different size and shape of watersheds was accomplished using QGIS 2.8.2 software and topographic data which was obtained by the Shuttle Radar Topographic Mission (SRTM). These data are available at a 3''-(90 meter) horizontal resolution and 16 meter vertical accuracy [44] .
3. Results3.1. Land Use/Cover Conversions in Al Hassa Oasis
In earlier studies attempts were made to classify and evaluate the land use/cover in the study area using remote sensing techniques (e.g. supervised classification approaches). These studies indicated that the Al Hassa oasis’s land cover consists of different land cover classes. [12] [45] classified the land use/cover of the study area into 5 to 7 cover classes including buildings, vegetation cover, sabakh, sand dunes, sand sheets, barren land. They documented that the Al Hassa oasis is dominated by barren and shifting sand feature.
In the present study, as the main purpose was to use satellite images to assess to what extent the arable lands in Al Hassa oasis were affected by urban development, three land use/cover categories were analyzed and mapped which include: agricultural lands, urban lands, and barren and sand dunes using unsupervised classification method. The analysis results reveal that the dominant land cover class in the study area is urban besides the barren and sand dunes as shown and presented in (Table 3) and (Figures 4(a) to (c)). This class has increased in area over the years. Comparison of classified images revealed that different situations were found in relation to the conversion of agricultural lands in the study area. In 1988, urban land-use covered around 185, 1 km2 of the total area of Al Hassa oasis, and then increased to 254.52 km2 in 2017, an increase of 69 km2 during thirty-three years of time. The high rate of urban growth (12%) that exceeds the world average rate of between 4 and 4.5 per annum [46] occurred as a response to the increase in the population of Al Hassa oasis due to the oil discovery. The area covered by arable lands, however, decreased from 160 km2 in 1988 to 156 km2 in 2000. This decrease can be justified by the development of the first oilfields to the north and east of the oasis of 1950 to1989 which resulted in the social and economic change impact on arable lands in the Al Hassa oasis [22] and in the same time led to the increase in urban use that took place between the period 2000 to 2017. By different words, the developments that took place in the Al Hassa oasis since 1950 have encouraged the transformation from the agricultural sector to other sectors (e.g., oil utilization, industry, trade, construction, and civil service). These non-agricultural sectors have opened the door to new employment opportunities and accelerated the immigration process to the urban area [22] which has the greatest negative effect on agricultural activities. In 1974 it is estimated that about 695,000 persons were practice agricultural as the main source of income. This number of persons was declined by about 96,000 persons in 1979 [47] . In addition to all these factors, increasing in soil salinity due to inefficient use of water and insufficient drainage has also led to a decline in the area covered by crops [48] .
It is important, however, to note that science 2000 there has been an improvement in a cropland area, it slightly increased by 22 km2 The increase in agricultural area could be justified by many factors, including (According to local respondents: 1) establishment of new irrigation projects to the north and south of the study area [21] , 2) the stabilization of sand dunes project by planting different type of species in the north of the study area, 3) the construction and improvement of irrigation and drainage systems increased the cropland area to the south of the study area.
In the period 2000-2017, the largest decrease in the areas covered by barren lands and sand dunes can be detected. It decreased by almost −85.41 Km2 in 2017 compared to the period 1988-2000. However, the obtained result is not consistent with the findings of other earlier studies e.g., [12] [45] and [49] . It is immediately obvious that there are some quite significant differences, which are areas covered by sand dunes are decreased in 2017 which explain the high NDVI values obtained for 2017 compared to other years. It is important to note that according to this result the study area has been affected by a sand movement which may lead to loss of some arable lands in addition to the losses due to urban expansion as the main driving force about arable land conversion between 2000 and 2017.
It should, however, be noted that in the land cover classification comparison, the accuracy of the classification itself may affect the results. Nevertheless, this effect is only local. Future work should, therefore, include other methods based on pixel comparison rather than on classes.
Data from (Table 4 and Table 5) respectively, show the land cover change matrix with more detailed change information [50] . For the period 1988-2000, it revealed that around 80.31% of the area did not exhibit a change in the three land covers. While around 39.7% of the area did not exhibit a change in the same three classes. It can be noted that the arable land showed a slight decrease in the area for the period 1988-2000 and at the same time exhibit greatest area with no change (83.81%); this might be explained by the large area occupied by this cover type. Whereas the same cover type is shown a slight increase for the period 2000-2017 by (69%). The area covered by urban increased by 14% from 1988 to 2000, and by 11% from 2000 to 2017.
To verify our classification results and confirm what we did and found, an accuracy assessment was accomplished using ground truth data. The results of this verification can be found in section 3.2.
Change in the Arable land, urban lands, and barren and sand dunes cover in the study area, Al Hassa 1988-2017
Land-use/cover class
Area (Km2)
Amount of change
1988
2000
2017
1988-2000
2000-2017
1988-2017
Agricultural lands
160.2 (10.9%)
156.8 (10.6%)
178.97 (12.13%)
−3.4
22.17
18.77
Urban lands
185.1 (12.5)
191.3 (13%)
254.52 (17.26%)
6.2
63.22
69.42
Barren and sand dunes
1129.6 (76.6)
1126.8 (76.4)
1041.39 (70.61%)
−6.8
−85.41
−88.21
Total
1474.9
1474.9
1474.9
Land-Cover change matrix and transitions in study area, Al Hassa 1988-2000
2000
Barren and sand dunes
Urban lands
Agricultural lands
1988
0.22%
13.75%
83.81%
Agricultural lands
4.12%
61.46%
13.48%
Urban lands
95.66%
24.79%
2.71%
Barren and sand dunes
Land-Cover change matrix and transitions in study area, Al Hassa 2000-2017
2017
Barren and sand dunes
Urban lands
Agricultural lands
2000
0.37%
11.00%
69.81%
Agricultural lands
3.73%
45.54%
20.42%
Urban lands
95.90%
43.46%
9.77%
Barren and sand dunes
Bold numbers indicate not changed pixels between two dates.
3.2. Accuracy Assessment Results
A quantitative analysis to determine analysis uncertainties was applied, based on an accuracy assessment model described by [37] . Based on these approaches, the obtained accuracies for all classified images slightly exceed the acceptable limit defined by the expertise in the area of remote sensing application. Nevertheless, these results suggest that data obtained from satellite images supported by data obtained from fieldwork may provide more accurate and up to date information for assessing the impact of urban development on the agricultural future. Tables 6-8 provide statistical information for the overall map accuracy assessment results. We found that the map accuracy of all classified images is 74%, 87%, and 89% for the classified images of 1988, 2000, and 2017. These tables also provide information about the producers and users accuracy of the land use/cover classifications.
The producer’s accuracy of the agricultural category is about 100 percent, for all classified images, while in the urban category is in the range of 60 percent for the image 1988 to less than 80 percent for the image 2000, which is quite acceptable. For the barren lands and sand dunes category, the producer’s accuracy seems to be imponderable. By reference to the user’s accuracy of all classified image, we revealed that about 86% of the agricultural lands of image 1988, 89% of image 2000, and 100% of image 2017 has been correctly identified as agricultural lands on the ground.
The user’s accuracy of 1988 for the urban and barren land reveals that there is significant confusion in discriminating urban lands from barren lands. This can be justified as follows: 1) the study area is dominated by a sand dune which has an effect on the reflectance of the others land cover and land use materials [45] , 2) in the study area the materials that buildings have been made from are sand particles, which have the same spectral reflectance of the sand dunes category. All these factors reduced the accuracy of the classification process and provided misleading results. Generally speaking, the obtained accuracy assessment results revealed that the dataset and methods that we used and the results that were obtained from the analysis can help us in assessing and making a judgment on the current environmental problem related to the conversion of the agricultural lands to other uses. This could lead to the fact that the moderate resolution data such as Landsat-5 and 7 can provide useful information to assess human impacts on agricultural lands as reported by [51] .
Statistical report of the classification results of 1988 classified image
Reference data
Class Name
Agricultural Lands
Urban lands
Barren lands and sand dunes
Total
Users Accuracy
Agricultural lands
13
2
0
15
86.70%
Urban lands
0
7
3
11
63.60%
Barren lands and sand dunes
0
3
6
9
66.70%
Total
13
12
10
35
Producers Accuracy
100%
58.30%
60%
Overall accuracy
74.3
Statistical report of the classification results of 2000 classified image
Reference data
Class Name
Agricultural Lands
Urban lands
Barren lands and sand dunes
Total
Users Accuracy
Agricultural lands
11
0
0
11
100.00%
Urban lands
0
7
1
8
87.50%
Barren lands and sand dunes
0
2
8
10
80.00%
Total
11
7
9
29
Producers Accuracy
100%
100.00%
89%
Overall accuracy
89.60%
Statistical report of the classification results of 2017 classified image
Reference data
Class Name
Agricultural Lands
Urban lands
Barren lands and sand dunes
Total
Users Accuracy
Agricultural lands
16
2
0
18
88.89%
Urban lands
0
9
2
11
81.82%
Barren lands and sand dunes
0
1
9
10
90.00%
Total
16
12
11
39
Producers Accuracy
100%
75.00%
82%
Overall accuracy
87%
3.3. Normalized Difference Vegetation Index Results
The main aim of this section is to provide information about the general status of vegetation cover in Al Hassa oasis based on satellite images. Data obtained in previous studies [13] [33] using remote sensing data indicated that different indices can be used as an effective tool for change detection in land use/cover studies. For example, according to Allbed et al. [13] , the NDVI index can give optimal results when used for change detection studies compared to post-classification comparison methods. In the present work, the well-known and wieldy used NDVI index was used to detect a change in vegetation cover along the study area. NDVI results have positively increased the accuracy of the final products obtained from the unsupervised classification approach. Figure 5 shows the results obtained using the NDVI index. Statistical information for areas covered by health vegetation is summarized in (Table 9 and Table 10). As can be seen, the maximum mean value of the NDVI is 0.933 of the image 1988 and −0.029 for the image 2000. The maximum and minimum NDVI values were 2.300 of the image 1988 and 0.493 of the image 2000. Also, it can be noticed that the percent of very health vegetation was significantly lower in 1988 than in 2000 and 2017, which isn’t consistent with results obtained in previous studies e.g., [13] . However, the obtained results are in line with the recent situation of the vegetation cover in the study area which is that it experiencing remarkable change over the study area. In other words, there has been very strong evidence that the vegetation in the study area is more affected by drought and other factors than ever before especially in the northern and southern parts. Although, the previous efforts undertaken by [21] towards this effect, it is still the area suffer from many aspects of drought, for example, sand movement (Plate 1).
It can be observed in (Figure 5) that in 1988 compared to 2000 and 2017 there was a considerable decline in vegetation cover. In spite of the considerable efforts made by [21] toward vegetation cover in the study area, stress in vegetation cover was clear in 1988 compared to years 2000 and 2017. Furthermore, between 1988 and 2000 a decrease in vegetation cover was observed especially in the north of the study area. Whereas the increase in vegetation cover was observed between the years 2000 to 2017 mostly towards the southern part of the study area. From (Figure 5) it can be seen that the vegetation greenness was improved where the high NDVI value was 0.30, representing around 7% as health vegetation in 2017.
The area covered by very health vegetation along the study area based on NDVI derived data, using Landsat images of three years
Years
Percent (%)
Square kilometer
1988
3.68
54.21
2000
7.033
103.721
2017
8.56
126.20
Statistical Information of the NDVI values of vegetation covers along the study area for different study periods of time derived from Landsat satellite images
Image year
Mean NDVI
Max NDVI
Min NDVI
Std.dev
1988
0.933
2.300
0.738
0.136
2000
−0.029
0.493
−0.662
0.055
2017
0.095
0.465
−0.188
0.044
Based on this approach, it was difficult to judge that if the change and decline in vegetation cover occur by urban expansion or by other human activities or by land degradation (i.e. soil salinity). Nevertheless, these results suggest that data obtained using NDVI index to evaluate to what extent vegetation cover degraded may provide more sensitive and accurate information for assessing the impact of drought on vegetation cover in general than other traditional methods.
Data obtained in recent study by [13] using NDVI image differencing technique as efficient method, which is a process of pixel-by-pixel subtraction of different NDVI images for land cover change detection indicated that a decrease in vegetation cover was detected and concentrated in the northern part of the study area, whereas the increase of vegetation cover was observed throughout the study area for the 1985-2000 period, and was only concentrated in the southern part between 2000-2013 period.
In our study, the same technique was used to obtain information in relation to vegetation cover change. (Figure 6) demonstrates the results obtained using the subtraction method. Data in (Figure 6) indicate that there were a significant decrease and increase in vegetation along the northern part of the study area. These trends are in line with the previously discussed results obtained by [13] . The results seem to indicate that there was no change (0 values) in vegetation cover in the center of the study area. The overall volume changes are presented in (Figure 6 (upper)). Comparison of (Figure 6 (upper and bottom)) shows that the vegetation cover was increased positively between the periods of 1988-2017 and negatively between the periods of 1988-2000. Overall, however, data in Figure 7 suggest that the study area has suffered a severe change in the vegetation cover, particularly between the periods of 1988 to 2000. Overall, it is believed that the general trend in the study area refers to urban expansion in the regions of ALuyun, ALjafor, Hofuf, and Joatha. It should, however, be noted that in the subtraction method, as pointed out by [52] , mixed features within one pixel may cause some problem in the final result and despite the change in pixel value the changed pixel might still represent the same land cover class.
Data obtained in SRTM using GIS-based tools indicated that change detection is more obvious and easy to detect when the study areas were divided into different size and shape of watersheds. The main necessity here is to highlight the areas where urban and cultivated lands have decreased or increased or remained unchanged during the study period. Figure 7 show the results obtained from change detection procedures based on GIS tools. As can be seen in Figure 7 there are great differences in terms of the size and shape between the three watersheds in all years. As can be seen in each watershed the differences between the three lands cover classes for each date. In all watersheds, it is clear that the urban use was prevailing in 2017 compared to 1988 and 2000. There are some similarities, however. For example, in both 1988 and 2000, the proportion of cultivated land was roughly the same area, particularly in Watersheds no 1, 4 and 5. Moreover, from these figures, a significant expansion in the urban area was detected in all directions. This meant that there is no control and a clear plan to restrict this increase in urban development along the study area.
Prior works have documented that the effectiveness of sand movement can lead to significant losses of agricultural lands especially in arid and semi-arid environments where the water shortage is severe, and there is drought; [5] [11] for example, reported that if legislation protecting arable areas is not enacted then they may be transformed to others uses. Using visual comparison it can be observed that the sand dunes and barren lands are the dominant cover features in watersheds numbers 2, 5 and 6. Although the agricultural activities in the study area have been receiving much attention from the government during the last five years, it is still suffering from sand encroachment. The decline in area covered by crops are very clear in 2017 specially in watersheds number 2, 3, and 4, whereas the increase is more obvious in other watersheds for instance 6 and 7.
4. Discussion
Prior work has documented the impact of urbanization on the future of agriculture particularly in developing countries; [1] for example, report that rapid urbanization might generate great pressures on arable lands, also they documented that urban expansion has a significant effect on the countryside by changing their landscape and lifestyle of rural communities. Other study carried by [12] focused on the impact of sand movement on the agricultural lands in Al Hassa oasis without considering the impact of urban expansion. However, these studies have either focused on one factor affecting the future of the agriculture or not based on satellite images and GIS techniques as these methodologies facilitate to a greater extent the achievement of the present study.
This study has attempted by employing remote sense and GIS techniques to evaluate and assess the impact of urban development on Al Hassa oasis’s agricultural land using different data sources; where significant results were found. The urban areas increased during the period of 1988-2017 while the arable lands were decreased. In 1988, urban land-use covered around 185, 1 km2 of the total area of Al Hassa oasis, and then increased to 254.52 km2 in 2017, an increase of 69 km2 during thirty-three years of time. This increase in urban use can be supported by recent study findings carried out by [24] has addressed the nature and trend of urban in the Al Hassa oasis they revealed that as the socio-economic situation has improved, the land use pattern has changed and urban area has increased rapidly for the periods 1957-2011. They also pointed out that the huge increase fraction was occurred in the built-up area by (366%) for the period 1985-1994 with concentration mainly in Hofuf and Mubarraz cities. In contrast, the area covered by arable lands however decreased from 160 km2 in 1988 to 156 km2 in 2000. This decrease can be justified by the development of the first oilfields to the north and east of the oasis of 1950 to1989 which resulted in the social and economic change impact on arable lands in the Al Hassa oasis [22] and in the same time led to the increase in urban use that took place in the period 2000 to 2017. In the same context it is important, however, to note that since 2000 there has been an improvement in a cropland area, it slightly increased by 22 km2. This increase have been justified by many facts, which includes: 1) establishment of new irrigation projects to the north and south of the study area [21] , 2) the stabilization of sand dunes project by planting different type of species in the north of the study area, 3) the construction and improvement of irrigation and drainage systems increased the cropland area to the south of the study area [According to the respondents]. The increase in crop area has been supported by a recent study of [13] ; they pointed out that the change in NDVI values increased by 7% for the period 2000-2013. They also revealed that approximately 7% of the total the Al Hassa area experienced positive change (i.e., increase in general vegetation cover) between 2000-2013, whereas nearly 3% of showed negative change, that is a decline in vegetation cover for the same period of time. The increase in vegetation cover in general may reflect the increase in crop area.
This increase and decrease in urban and agricultural areas can be justified for many reasons. Firstly, lands owners seem to have largely transformed their arable lands to other investment because of the low income of the agricultural productivity compared to the expenses on the land cultivation. That is to say, in terms of recent development in the area, it has been shown that most of the owners of the land tend to convert their land to urban uses because it saves their many and in the same time can lead to more outcomes. Secondly, it is clear that the study area falls in the desert, accordingly, it has long been threatening by shifting sand. This shifting sand changed most of the soil characteristics and has become a big challenge for the farmers to keep their lands with fertile soil. Moreover, a recent study carried out by [13] has revealed that the most of the arable lands in Al Hassa oasis have been affected or affecting by soil salinity, and they justify that by different factors one of them is poor quality irrigation of groundwater. The same study and other several studies [14] [19] have found that the soil in Al Hassa oasis’s arable lands contents high EC ranging between 1.4 and 16 ds/m and high salinity. From all these studies it can conclude that there is a strong relationship between the changes in vegetation cover and the salinity of the soil, increase in soil salinity might lead to a decrease in vegetation cover.
Furthermore, based on the survey undertaken in the study area it was found that the farmers preferred to work in other sectors rather than cultivating their land. Moreover, in some cases, they can be employed in nonagricultural jobs. It is important to mention that agricultural lands in the study area are facing great challenging in relation to the current economic situation. That because of the oil operation in the Eastern Province, in general, has led to the establishment and rapid growth of new settlements [22] .
The findings of this study are consistent with the study by Elhadary et al. [1] carried out in Seberang Perai region, Malaysia (Despite the fact that both areas are located in the Asian countries and almost have the same population number. It is important to note that the pattern of land use system and the way of managing it are slightly different. Malaysia depends on growing rice and oil palm while Saudi Arabia is based on growing date palm. Both countries have witnessed rapid expansion of urban building at the area of agricultural land and this phenomenon found in most of the developing countries) which showed that many arable lands are transformed to urban use for many reasons one of them is the urban development in the region, while the second one is that most of landowners tend to sell or rent their land to others who might keep it without cultivation, and finally they prefer to transform their land to others uses as a response to the economic investment.
Overall, these studies suggest that there will be no future for the agricultural practices in the study area if all these challenges continue. As consequences, the owners of the land probably preferred to choose others activities rather than keep their land without any cultivation.
5. Conclusion
This article has assessed and evaluated the issue of urbanization and its impact on the arable lands conversion in the Al Hassa oasis of Eastern Region in Saudi Arabia using remote sensing and Geographical Information System (GIS). The analysis results from this study can be considered as an alarm for the arable land conversion in Al Hassa oasis. It might lead to social and environmental impacts in the near future. In addition, the findings presented in this study expand prior work. The study provides a framework for future studies to assess current problem solutions. However, some limitations are worth noting. Although our findings were supported by accuracy assessments, it still needs more validation. Future work should, therefore, be achieved to evaluate the impact of urbanization on agricultural lands using sub-pixel classification comparisons and data with high resolution.
Acknowledgements
We wish to thanks the anonymous reviewers for their valuable and useful suggestions and comments on the manuscript and their valuable editing and enhancement of the English language. Also, we would like to thanks the USGS organization for providing the remote sensing data for free.
Author’s Contributions
Data processing and writing of the methods section have been achieved by the third author. The interpretation of the results, the discussion, and conclusions sections were written by the second author. Finally, the introduction and the abstract sections were written by the first author.
Conflicts of Interest
The authors declare no conflicts of interest regarding the publication of this paper.
Cite this paper
Alqarni, S., Babiker, A. and Salih, A. (2018) Detection, Mapping and Assessment Change in Urban and Croplands Area in Al-Hassa Oasis, Eastern Region in Saudi Arabia Using Remote Sensing and Geographic Information System. Journal of Geographic Information System, 10, 659-685. https://doi.org/10.4236/jgis.2018.106034
ReferencesElhadary, Y.A.E., Narimah, S. and Franklin, O. (2013) Development at the Peri-Urban Area and Its Impact on Agricultural Activities: An Example from the Seberang Perai Region, Penang State, Malaysia. Agroecology and Sustainable Food Systems, 37, 834-856. https://doi.org/10.1080/21683565.2013.797950Peerzado, M.B., Habibullah M., and Muhammad, J.S. (2018) Land Use Conflicts and Urban Sprawl: Conversion of Agriculture Lands into Urbanization in Hyderabad, Pakistan. Journal of the Saudi Society of Agricultural Sciences. (In Press).Piquer-Rodríguez, M., Butsic, V., Gartner, P., Macchi, L., Baumann, M., Gavier Pizarro, G., Volante, J.N., Gasparri, I.N. and Kuemmerle, T. (2018) Drivers of Agricultural Land-Use Change in the Argentine Pampas and Chaco Regions. Applied Geography, 91, 111-122. https://doi.org/10.1016/j.apgeog.2018.01.004Maglinets, Yu.A., Raevich, K.V. and Tsibulskii, G.M. (2017) Knowledge-Based Geoinformation Technology for Evaluation of Agricultural Lands. Procedia Engineering, 201, 331-340. https://doi.org/10.1016/j.proeng.2017.09.639Elhag, M.M. (2006) Causes and Impact of Desertification in the Butana Area of Sudan. Unpublished PhD Thesis, Bloemfontein.McGee, T. (1989) Urbanisasi or Kotadesasi? Evolving Pattern of Urbanization in Asia. In: Cost, F.J., Dutt, A.K., Ma. L.J.C. and Nobel, A.G., Eds., Urbanization in Asia: Spatial Dimension and Policy Issues, University of Hawai Press, Honalulu, 93-108.Abdul, S., Asharaf, I.E., Rshood, K. and Abdullah, A. (2014) Population Distribution and Household Conditions in Saudi Arabia: Reflections from the 2010 Census. Springer Plus 3. Springer, Berlin, 530. https://doi.org/10.1186/2193-1801-3-530Brown, L.R. (1995) Who Will Feed China? Wake-Up Call for a Small Planet. W. W. Norton, New York.Reynolds, J., Smith, D., Lambin, E., Turner, B., Mortimore, M., Batterbury, S., Downing, T., Dowlatabadi, H., Fernandez, R., Herrick, J., Huber-Sannwald, E., Jiang H., Leemans, R., Lynam, T., Maestre, F., Ayarza, M. and Walker, B. (2007) Globa Desertification: Building a Science for Dryland Development. Science, 316, 847-851. https://doi.org/10.1126/science.1131634Wessels, K.J., Prince, S.D., Malherbe, J., Small, J., Frost, P.E. and VanZyl, D. (2007) Can Human-Induced Land Degradation Be Distinguished from the Effects of Rainfall Variability? A Case Study in South Africa. Journal of Arid Environments, 68, 271-297. https://doi.org/10.1016/j.jaridenv.2006.05.015Salih, A., Ganawa, E.S.M., Elfaig, A.H.I. and Hilmi, H.S.M. (2017) Integration of Geo-Spatial Techniques for Desertification Impact Assessment on Agricultural Lands in El-Qutaynah Area, Sudan. International Journal of Environmental Monitoring and Protection, 4, 6-13. http://www.openscienceonline.com/journal/ijempAl Saud, M.B.M. (2004) Application of Remote Sensing for Monitoring Sand Dunes Movement in Al Hassa Oasis. Kuwait Geography Association, University of Kuwait, Kuwait City.Allbed, A., Kumar, L. and Sinha, P. (2017) Soil Salinity and Vegetation Cover Change Detection from Multi-Temporal Remotely Sensed Imagery in Al Hassa Oasis in Saudi Arabia. Geocarto International, 33, 830-846.
https://doi.org/10.1080/10106049.2017.1303090Hussain, G., Al-Zarah, A. and Latif, M.S. (2012) Influence of Groundwater Irrigation on Chemical Properties of Soils in the Vicinity of Wastewater Drainage Canals in Al-Alisa Oasis. Research Journal of Environmental Toxicology, 7, 1-17.
https://doi.org/10.3923/rjet.2013.1.17Holm, D.A. (1960) Desert Geomorphology in the Arabian Peninsula. Science, 132, 3437. https://doi.org/10.1126/science.132.3437.1369Weng, Q.H. (2009) Remote Sensing and GIS Integration: Theories, Methods, and Applications: Theory, Methods, and Applications. McGraw-Hill Education, New York.Vidal, F.S. (1954) Date Culture in the Oasis of Al-Hasa. Middle East Journal, 8, 417-428. http://www.jstor.org/stable/4322638Al-Dakheel, Y. and Massoud, M. (2006) Towards Sustainable Development for Groundwater in Al-Hassa and the Role of Geographic Information System. The 2nd International Conference on Water Recourses and Arid Environment, Riyadh, 2006, 1-18.Al-Zarah, A.I. (2011) Elemental Composition of Groundwater and Spring Waters in Al-Ahsa Oasis, Eastern Region Saudi Arabia. Trends in Applied Sciences Research, 6, 1-18. https://doi.org/10.3923/tasr.2011.1.18Alghannam, A.O. and Al-Qahtnai, M.R. (2012) Impact of Vegetation Cover on Urban and Rural Areas of Arid Climates. Australian Journal of Agricultural Engineering, 3, 1-5.Ministry of Agriculture and Water (2010) Al-Hassa Irrigation and Drainage Authority Report, Hofuf, KSA.Al-Jabr M.A. ,et al. (1984)Agriculture in Al-Hassa Oasis, Saudi Arabia: A Review of Development Remote Sensing of Environment 113, 893-903.Saudi General Authority for Statistics (2017) Atlas of Population and Housing: Maps Distributions of Preliminary Results 2010.
https://www.stats.gov.sa/sites/default/files/en-dmaps2010_0_0.pdfAbdelatti, H., Elhadary, Y. and Babiker, A.A. (2017) Nature and Trend of Urban Growth in Saudi Arabia: The Case of Al-Ahsa Province—Eastern Region. Resources and Environment, 7, 69-80.Corbin, J. and Anselm, S. (2008) Basics of Qualitative Research: Techniques and Procedures for Developing Grounded Theory. 3rd Edition, SAGE Publications, Inc. Thousand Oaks. https://doi.org/10.4135/9781452230153Alqurashi, A.F. and Kumar, L. (2017) An Assessment of the Impact of Urbanization and Land Use Changes in the Fast-Growing Cities of Saudi Arabia. Geocarto International, 19, 38. https://doi.org/10.1080/10106049.2017.1367423Jain, A.K. (1988) Fundamentals of Digital Image Processing. Pearson, Englewood Cliffs.Campbell, J.B. and Randolph, H.W. (2011) Introduction to Remote Sensing. 5th Edition. The Guilford Press, New York.Chander, G., Markham, B.L. and Dennis, L.H. (2009) Summary of Current Radiometric Calibration Coefficients for Landsat MSS, TM, ETM+, and EO-1. In: Chen, C.H., Ed. (2007), Image Processing for Remote Sensing, CRC Press, Boca Raton.Kauth, R.J. and Thomas, G.S. (1976) The Tasselled Cap—A Graphic Description of the Spectral-Temporal Development of Agricultural Crops as Seen by Landsat. Proceedings of the Symposium on Machine Processing of Remotely Sensed Data, West Lafayette, 29 June-1 July 1976, 41-51.Crist, E.P. and Cicone, R.C. (1984) A Physically-Based Transformation of Thematic Mapper Data—The TM Tasseled Cap. IEEE Transactions on Geoscience and Remote Sensing, GE-22, 256-263. https://doi.org/10.1109/TGRS.1984.350619Healey, S.P., Cohen, W.B., Yang, Z.Q. and Krankina, O.N. (2005) Comparison of Tasseled Cap-Based Landsat Data Structures for Use in Forest Disturbance Detection. Remote Sensing of Environment, 97, 301-310.
https://doi.org/10.1016/j.rse.2005.05.009Richards, J.A. (1993) Remote Sensing Digital Image Analysis: An Introduction. Second Revised and Enlarged Edition, Springer-Verlage, New York.
https://doi.org/10.1007/978-3-642-88087-2Jensen, J. (2004) Introductory Digital Image Processing, A Remote Sensing Perspective. 3rd Edition, Pearson Prentice-Hall, Upper Saddle River.Lillesand, T., Kiefer, R.W. and Chipman, J. (2007) Remote Sensing and Image Interpretation. 6th Edition, Wiley, Hoboken.Lillesand, T. and Kiefer, R.W. (1994) Remote Sensing and Image Interpretation. 3rd Edition, Wiley, New York.Congalton, R.G. and Kass, G. (2009) Assessing the Accuracy of Remotely Sensed Data: Principles and Practices. CRC Press/Taylor & Francis, Boca Raton.Singh, A. (1989) Review Article Digital Change Detection Techniques Using Remote-Sensed Data. International Journal of Remote Sensing, 10, 989-1003.
https://doi.org/10.1080/01431168908903939Gillespie, T.W., Ostermann-Kelm, S., Dong, C.Y., Willis, K.S., Okin, G.S. and Macdonald, G.M. (2018) Monitoring Changes of NDVI in Protected Areas of Southern California. Ecological Indicators, 88, 485-494.
https://doi.org/10.1016/j.ecolind.2018.01.031Gandhi, G.M., Parthiban, S., Nagaraj, T. and Christy, A. (2015) Ndvi: Vegetation Change Detection Using Remote Sensing and Gis—A Case Study of Vellore District. Procedia Computer Science, 57, 1199-1210.
https://doi.org/10.1016/j.procs.2015.07.415Gregorio, A.D., Food and Agriculture Organization of the United Nations, and the United Nations Environment Programme (2005) Land Cover Classification System: Classification Concepts and User Manual: LCCS. Food and Agriculture Organization of the United Nations. http://www.fao.org/docrep/008/y7220e/y7220e00Lillesand, T.M., Kiefer, R.W. and Chipman, J.W. (2004) Remote Sensing and Image Interpretation. Wiley, Hoboken.Mitchell, A. (Technical Writer) (1999) The ESRI Guide to GIS Analysis. Environmental Systems Research Institute, Redlands.Rodriguez, E., Morris, C.S., Belz, J.E., Chapin, E.C., Martin, J.M., Dafeer, W. and Hensely, S. (2005) An Assessment of the SRTM Topographic Products. Technical Report JPL D-31639. Jet Propulsion Laboratory, Pasadena.Salih, A. (2018) Classification and Mapping of Land Cover Types and Attributes in Al-Ahssa Oasis, Eastern Region, Saudi Arabia Using Landsat-7 Data. Journal of Remote Sensing & GIS 2018 (February), 7, 228.
https://doi.org/10.4172/2469-4134.1000228Al-Elawy, I.S. (1976) The Influence of Oil upon Settlement in Al-Hassa Oasis, Saudi Arabia. Unpublished Ph.D. Thesis, University of Durham, Durham.Ministry of Planning (1980) Third Development Plan 1400/1405 A.B. (1980/1985 A.D). Ministry of Planning, Riyadh.Allbed, A., Kumar, L. and Aldakheed, Y. (2014) Assessing Soil Salinity Using Soil Salinity and Vegetation Indices Derived from IKONOS High-Spatial Resolution Imageries: Applications in a Date Palm Dominated Region. Geoderma, 230, 1-8.
https://doi.org/10.1016/j.geoderma.2014.03.025Hussain, N., Al-Rawahy, A.S., Rabee, J. and Al-Amri, M. (2006) Causes, Origin, Genesis, and Extent of Soil Salinity in the Sultan of Oman. Pakistan Journal of Agricultural Sciences, 43, 1-2.Lunetta, R.S. and Lyon, J.G. (2004) Remote Sensing and GIS Accuracy Assessment. CRC Press, London, New York, Washington DC.
https://doi.org/10.1201/9780203497586Gutman, G., Janetos, A.C., Justice, C.O., Moran, E.F., Mustard, J.F., Rindfuss, R.R., Skole, D., II, B.L.T. and Cochrane, M.A. (Eds.) (2005) Land Change Science: Observing, Monitoring and Understanding Trajectories of Change on the Earth’s Surface. 2004 Edition, Springer, Dordrecht.Riordon, C.J., (1980) Non-Urban to Urban Land Cover Change Detection Using Landsat Data. Summary Report of the Colorado Agricultural Research Experiment Station, For Collins.