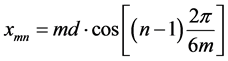
<?xml version="1.0" encoding="UTF-8"?><!DOCTYPE article  PUBLIC "-//NLM//DTD Journal Publishing DTD v3.0 20080202//EN" "http://dtd.nlm.nih.gov/publishing/3.0/journalpublishing3.dtd"><article xmlns:mml="http://www.w3.org/1998/Math/MathML" xmlns:xlink="http://www.w3.org/1999/xlink" dtd-version="3.0" xml:lang="en" article-type="research article"><front><journal-meta><journal-id journal-id-type="publisher-id">OPJ</journal-id><journal-title-group><journal-title>Optics and Photonics Journal</journal-title></journal-title-group><issn pub-type="epub">2160-8881</issn><publisher><publisher-name>Scientific Research Publishing</publisher-name></publisher></journal-meta><article-meta><article-id pub-id-type="doi">10.4236/opj.2016.68B006</article-id><article-id pub-id-type="publisher-id">OPJ-70296</article-id><article-categories><subj-group subj-group-type="heading"><subject>Articles</subject></subj-group><subj-group subj-group-type="Discipline-v2"><subject>Chemistry&amp;Materials Science</subject><subject> Engineering</subject><subject> Physics&amp;Mathematics</subject></subj-group></article-categories><title-group><article-title>
 
 
  Evaluation of the Coherent Combining Lasers Array by the Power in the Bucket of the Main Lobe Method
 
</article-title></title-group><contrib-group><contrib contrib-type="author" xlink:type="simple"><name name-style="western"><surname>Yang</surname><given-names>Liu</given-names></name><xref ref-type="aff" rid="aff1"><sup>1</sup></xref></contrib><contrib contrib-type="author" xlink:type="simple"><name name-style="western"><surname>Xi</surname><given-names>Zhang</given-names></name><xref ref-type="aff" rid="aff1"><sup>1</sup></xref></contrib><contrib contrib-type="author" xlink:type="simple"><name name-style="western"><surname>Debao</surname><given-names>Zhang</given-names></name><xref ref-type="aff" rid="aff1"><sup>1</sup></xref></contrib><contrib contrib-type="author" xlink:type="simple"><name name-style="western"><surname>Wenqin</surname><given-names>Huang</given-names></name><xref ref-type="aff" rid="aff1"><sup>1</sup></xref></contrib><contrib contrib-type="author" xlink:type="simple"><name name-style="western"><surname>Chang’an</surname><given-names>Qiao</given-names></name><xref ref-type="aff" rid="aff1"><sup>1</sup></xref></contrib><contrib contrib-type="author" xlink:type="simple"><name name-style="western"><surname>Bo</surname><given-names>Wang</given-names></name><xref ref-type="aff" rid="aff1"><sup>1</sup></xref></contrib></contrib-group><aff id="aff1"><addr-line>Wuhan Mechanical Technology College, Wuhan, China</addr-line></aff><pub-date pub-type="epub"><day>25</day><month>08</month><year>2016</year></pub-date><volume>06</volume><issue>08</issue><fpage>30</fpage><lpage>36</lpage><history><date date-type="received"><day>25</day>	<month>April</month>	<year>2016</year></date><date date-type="rev-recd"><day>accepted</day>	<month>19</month>	<year>August</year>	</date><date date-type="accepted"><day>25</day>	<month>August</month>	<year>2016</year></date></history><permissions><copyright-statement>&#169; Copyright  2014 by authors and Scientific Research Publishing Inc. </copyright-statement><copyright-year>2014</copyright-year><license><license-p>This work is licensed under the Creative Commons Attribution International License (CC BY). http://creativecommons.org/licenses/by/4.0/</license-p></license></permissions><abstract><p>


   Coherent combination of laser beam is an important and challenging area of high power laser science. And how to evaluate the high power laser by coherent beam combination is a new research spot. Formulas for the radiated intensity distributions of coherent combined Gaussian beam array are derived via Fraunhofer scalar diffraction model by utilizing representations of the cross-spectral density of the far field. Effects of beam array numbers and separate distances etc. on far field radiated profiles are shown and analyzed. A new conception named power in the bucket of the main lobe (PIMm) is advanced to measure the beam quality of combined beams. This evaluation method is useful for efficiently determining the peak irradiance and power in the bucket for single emitting apertures of general shape. 
  
 
</p></abstract><kwd-group><kwd>Coherent Combination</kwd><kwd> Beam Shape</kwd><kwd> Fill Factor</kwd><kwd> Power in the Bucket</kwd></kwd-group></article-meta></front><body><sec id="s1"><title>1. Introduction</title><p>Achieving high optical power and high brightness has always been the major goals in the development of laser technologies. A natural means of increasing the power and especially the brightness should be to combine many individual lasers into arrays. In recent years, coherent and incoherent combinations of laser beams have been intensively studied theoretically and experimentally due to their wide applications in long-range energy delivering, etc. Since then, beam quality and divergence angle of laser arrays in the far field have also been investigated, and how to evaluate the high power laser by coherent beam combination is a new research hotspot [<xref ref-type="bibr" rid="scirp.70296-ref1">1</xref>] [<xref ref-type="bibr" rid="scirp.70296-ref2">2</xref>].</p><p>In this paper, based on the representations of the cross-spectral density of the far field, the radiated intensity distributions of coherent and incoherent combined Gaussian laser arrays are formulated and depicted. Effects of beam array numbers and separate distances between each source element on far-field radiated profiles are illustrated by numerical examples.</p><p>The important motivation for combining multiple lasers is to obtain high on-axis peak beam intensity, so the combination effect is evaluated by combining effect factor defined as the power in the bucket of the main lobe (<inline-formula><inline-graphic xlink:href="http://html.scirp.org/file/70296x5.png" xlink:type="simple"/></inline-formula>) at the far field target. The <inline-formula><inline-graphic xlink:href="http://html.scirp.org/file/70296x6.png" xlink:type="simple"/></inline-formula> is defined as</p><disp-formula id="scirp.70296-formula233"><label>(1)</label><graphic position="anchor" xlink:href="http://html.scirp.org/file/70296x7.png"  xlink:type="simple"/></disp-formula><p><inline-formula><inline-graphic xlink:href="http://html.scirp.org/file/70296x8.png" xlink:type="simple"/></inline-formula>is the ratio of the power in the main lobe to the total power of the array in the far filed intensity distribution. On this basis, a new conception is advanced to measure the beam quality of combined beams.</p></sec><sec id="s2"><title>2. Theory Model</title><p>According to Fraunhofer diffraction theory, the diffraction field that collimated beam passing through lens can be calculated by Fraunhofer diffraction formula. In this paper, we established a laser combination array of several individual Gaussian beams with a near-field intensity profile arranged of a hexagonally packed group of emitters on a circle in a “bolt-hole” beam pattern as shown in <xref ref-type="fig" rid="fig1">Figure 1</xref>, and the far field beam profile calculation is based on scalar diffraction theory. The far field complex amplitude distribution is sensitive to near field beam relative phase relationship; array areal fill factor and array number [<xref ref-type="bibr" rid="scirp.70296-ref3">3</xref>]-[<xref ref-type="bibr" rid="scirp.70296-ref5">5</xref>]. We assume that every beam in the array has same intensity distribution with different beam center positions, and every beam waist width is equal</p><p>as<inline-formula><inline-graphic xlink:href="http://html.scirp.org/file/70296x9.png" xlink:type="simple"/></inline-formula>, the distance between nearest beams is d, the total number of the laser array is N，<inline-formula><inline-graphic xlink:href="http://html.scirp.org/file/70296x10.png" xlink:type="simple"/></inline-formula>，m is the circle number of the array.</p><p>The coordinate location of each beam can be referred as (x<sub>mn</sub>, y<sub>mn</sub>),</p><p><img src="http://html.scirp.org/file/70296x11.png" />,<img src="http://html.scirp.org/file/70296x12.png" /> (2)</p><p>The intensity of the laser array in the near field pattern can be written as</p><disp-formula id="scirp.70296-formula234"><label>(3)</label><graphic position="anchor" xlink:href="http://html.scirp.org/file/70296x13.png"  xlink:type="simple"/></disp-formula><p>where, <inline-formula><inline-graphic xlink:href="http://html.scirp.org/file/70296x14.png" xlink:type="simple"/></inline-formula>, <inline-formula><inline-graphic xlink:href="http://html.scirp.org/file/70296x15.png" xlink:type="simple"/></inline-formula>is the complex amplitude and initial phase of each beam respectively. The far field profile is the spatial Fourier transform of the near field pattern, and the far field complex amplitude of coherent combined Gaussian laser array can be expressed as</p><disp-formula id="scirp.70296-formula235"><label>(4)</label><graphic position="anchor" xlink:href="http://html.scirp.org/file/70296x16.png"  xlink:type="simple"/></disp-formula><fig id="fig1"  position="float"><label><xref ref-type="fig" rid="fig1">Figure 1</xref></label><caption><title> Arrangement of array beams</title></caption><graphic mimetype="image"   position="float"  xlink:type="simple"  xlink:href="http://html.scirp.org/file/70296x17.png"/></fig><p>The far field cross-spectral intensity distribution pattern is the square of the complex amplitude model. For simplicity, we neglected the constant items, and the far field intensity distribution pattern of the array is easy to get as</p><disp-formula id="scirp.70296-formula236"><label>(5)</label><graphic position="anchor" xlink:href="http://html.scirp.org/file/70296x18.png"  xlink:type="simple"/></disp-formula><p>where<inline-formula><inline-graphic xlink:href="http://html.scirp.org/file/70296x19.png" xlink:type="simple"/></inline-formula>，and we will see that the far field cross-spectral intensity distribution pattern is the product of the intensity of the laser array in the near field pattern with a single Gaussian beam. We induce a spatial coherence degree factor <inline-formula><inline-graphic xlink:href="http://html.scirp.org/file/70296x19.png" xlink:type="simple"/></inline-formula><inline-formula><inline-graphic xlink:href="http://html.scirp.org/file/70296x20.png" xlink:type="simple"/></inline-formula> which is defined as a fuzzy function of phase difference, complex amplitude, and polarization etc. Note that, the value of the coherence degree factor <inline-formula><inline-graphic xlink:href="http://html.scirp.org/file/70296x19.png" xlink:type="simple"/></inline-formula><inline-formula><inline-graphic xlink:href="http://html.scirp.org/file/70296x20.png" xlink:type="simple"/></inline-formula><inline-formula><inline-graphic xlink:href="http://html.scirp.org/file/70296x21.png" xlink:type="simple"/></inline-formula> is ranged from 0 to 1. When<inline-formula><inline-graphic xlink:href="http://html.scirp.org/file/70296x19.png" xlink:type="simple"/></inline-formula><inline-formula><inline-graphic xlink:href="http://html.scirp.org/file/70296x20.png" xlink:type="simple"/></inline-formula><inline-formula><inline-graphic xlink:href="http://html.scirp.org/file/70296x21.png" xlink:type="simple"/></inline-formula><inline-formula><inline-graphic xlink:href="http://html.scirp.org/file/70296x22.png" xlink:type="simple"/></inline-formula>, it refers that the array is completely coherent combined and when<inline-formula><inline-graphic xlink:href="http://html.scirp.org/file/70296x19.png" xlink:type="simple"/></inline-formula><inline-formula><inline-graphic xlink:href="http://html.scirp.org/file/70296x20.png" xlink:type="simple"/></inline-formula><inline-formula><inline-graphic xlink:href="http://html.scirp.org/file/70296x21.png" xlink:type="simple"/></inline-formula><inline-formula><inline-graphic xlink:href="http://html.scirp.org/file/70296x22.png" xlink:type="simple"/></inline-formula><inline-formula><inline-graphic xlink:href="http://html.scirp.org/file/70296x23.png" xlink:type="simple"/></inline-formula>, the array is completely incoherent combined. In this paper, what we consider is the relative distribution of light intensity on far field, so we investigated the sensitive factors of array arrangement, coherence degree factor and the laser beam number which may influence the far field intensity distribution pattern. According to the above Formulas (2)-(5), we can simulate the far field distributions of the laser array and present the concept of <inline-formula><inline-graphic xlink:href="http://html.scirp.org/file/70296x19.png" xlink:type="simple"/></inline-formula><inline-formula><inline-graphic xlink:href="http://html.scirp.org/file/70296x20.png" xlink:type="simple"/></inline-formula><inline-formula><inline-graphic xlink:href="http://html.scirp.org/file/70296x21.png" xlink:type="simple"/></inline-formula><inline-formula><inline-graphic xlink:href="http://html.scirp.org/file/70296x22.png" xlink:type="simple"/></inline-formula><inline-formula><inline-graphic xlink:href="http://html.scirp.org/file/70296x23.png" xlink:type="simple"/></inline-formula><inline-formula><inline-graphic xlink:href="http://html.scirp.org/file/70296x24.png" xlink:type="simple"/></inline-formula> to evaluate the coherent combining system’s performances.</p></sec><sec id="s3"><title>3. The Far Filed Characters upon Sensitive Factors</title><p>According to Fraunhofer diffraction theory, the diffraction field that collimated beam passing through lens can be calculated by Formula (5), where i is imaginary unit, k is wave number <inline-formula><inline-graphic xlink:href="http://html.scirp.org/file/70296x25.png" xlink:type="simple"/></inline-formula> is the incident field coordinates, <inline-formula><inline-graphic xlink:href="http://html.scirp.org/file/70296x25.png" xlink:type="simple"/></inline-formula><inline-formula><inline-graphic xlink:href="http://html.scirp.org/file/70296x26.png" xlink:type="simple"/></inline-formula>is the angle away from the normal, N is the total number of wavelets, d is the diameter of circular beams. For convenience, we demonstrate every sensitive factor assuming the other factors are constant.</p><sec id="s3_1"><title>3.1. The Array Arrangement</title><p>In this section, we study the performance of the array arrangement to the far field distribution. Suppose that there are only static phase distortions due to the laser path length differences between the different channels. Numerical calculations will be carried out to correct those phase distortions by finite number of iterations. We will consider hexagonal distributed laser arrays containing seven lasers as an example. We suppose that each fiber laser beam has a single Gaussian mode output. The beam waist of each laser is<inline-formula><inline-graphic xlink:href="http://html.scirp.org/file/70296x27.png" xlink:type="simple"/></inline-formula>, and lasers are arranged in an array with the nearest neighbor separated by a distance d. Vacancy factor <inline-formula><inline-graphic xlink:href="http://html.scirp.org/file/70296x27.png" xlink:type="simple"/></inline-formula><inline-formula><inline-graphic xlink:href="http://html.scirp.org/file/70296x28.png" xlink:type="simple"/></inline-formula> can be used to describe the compactness of the array. A smaller f corresponds to a more compact array. The numerical calculation of the far field distribution with variable <inline-formula><inline-graphic xlink:href="http://html.scirp.org/file/70296x27.png" xlink:type="simple"/></inline-formula><inline-formula><inline-graphic xlink:href="http://html.scirp.org/file/70296x28.png" xlink:type="simple"/></inline-formula><inline-formula><inline-graphic xlink:href="http://html.scirp.org/file/70296x29.png" xlink:type="simple"/></inline-formula> is shown in <xref ref-type="fig" rid="fig2">Figure 2</xref>.</p><p>From results it is found that, for coherent combination of Gaussian laser array, its intensity distributions would turn out to be occupy many rough lobes around the a central lobe. For example, when<inline-formula><inline-graphic xlink:href="http://html.scirp.org/file/70296x30.png" xlink:type="simple"/></inline-formula>, the far field distribution is the Gaussian type. With f increases, more side-lobes appear which are induced by effects of interference of many separate source elements. While the vacancy factor decreased, the number of circle fringes increased but the radius of the central far-field lobe also decreased. What is most important is that the power in the bucket of the main lobe made the same corresponding changes. For certain f, the radius of the central far-field lobe can be calculated and the power in the bucket of the main lobe is the integration of such radius in the power domain.</p></sec><sec id="s3_2"><title>3.2. The Coherence Degree</title><p>We induce a spatial coherence degree factor <inline-formula><inline-graphic xlink:href="http://html.scirp.org/file/70296x31.png" xlink:type="simple"/></inline-formula> which is defined as a fuzzy function of phase difference, complex amplitude, and polarization etc. [<xref ref-type="bibr" rid="scirp.70296-ref6">6</xref>]. From the Formula (5), it is easy to know that the factor <inline-formula><inline-graphic xlink:href="http://html.scirp.org/file/70296x31.png" xlink:type="simple"/></inline-formula><inline-formula><inline-graphic xlink:href="http://html.scirp.org/file/70296x32.png" xlink:type="simple"/></inline-formula> has no contributions to the far filed distribution pattern, but it is sensitive to the on axis density and the power of the main lobe. Assuming laser arrays containing seven lasers and its vacancy factor<inline-formula><inline-graphic xlink:href="http://html.scirp.org/file/70296x31.png" xlink:type="simple"/></inline-formula><inline-formula><inline-graphic xlink:href="http://html.scirp.org/file/70296x32.png" xlink:type="simple"/></inline-formula><inline-formula><inline-graphic xlink:href="http://html.scirp.org/file/70296x33.png" xlink:type="simple"/></inline-formula>, the numerical calculation of the far field transverse plane distribution with variable <inline-formula><inline-graphic xlink:href="http://html.scirp.org/file/70296x31.png" xlink:type="simple"/></inline-formula><inline-formula><inline-graphic xlink:href="http://html.scirp.org/file/70296x32.png" xlink:type="simple"/></inline-formula><inline-formula><inline-graphic xlink:href="http://html.scirp.org/file/70296x33.png" xlink:type="simple"/></inline-formula><inline-formula><inline-graphic xlink:href="http://html.scirp.org/file/70296x34.png" xlink:type="simple"/></inline-formula> value is shown in <xref ref-type="fig" rid="fig3">Figure 3</xref>.</p><p>The computed results indicate that the radius of the main lobe of the far field distribution is consistent despite the variation of coherence degree factor<inline-formula><inline-graphic xlink:href="http://html.scirp.org/file/70296x35.png" xlink:type="simple"/></inline-formula>. For a laser array with the coherence degree from 0 - 1, the axial intensity vary approximately linearly with coherence, but the radius of the central far-field lobe is nearly unchanged as coherence decreases from one to nearly zero at which point the lobe disappears completely. Which</p><fig id="fig2"  position="float"><label><xref ref-type="fig" rid="fig2">Figure 2</xref></label><caption><title> Far field distribution with various f: (a) f = 1.0 (b) f = 0.8 (c) f = 0.5 (d) f = 0.25</title></caption><graphic mimetype="image"   position="float"  xlink:type="simple"  xlink:href="http://html.scirp.org/file/70296x36.png"/></fig><fig id="fig3"  position="float"><label><xref ref-type="fig" rid="fig3">Figure 3</xref></label><caption><title> Far field distribution with various γ</title></caption><graphic mimetype="image"   position="float"  xlink:type="simple"  xlink:href="http://html.scirp.org/file/70296x37.png"/></fig><p>may be the most important character is that, the fringe visibility at the far field does depend on the coherence degree but that dependence varies strongly with the array arrangement and the number of laser beams in the array.</p></sec><sec id="s3_3"><title>3.3. The Number of Array Beams</title><p>The equations are an exception to the prescribed specifications of this template. You will need to determine whether or not your equation should be typed using either the Times New Roman or the Symbol font (please no other font). Equations should be edited by Mathtype, not in text or graphic versions. You are suggested to use Mathtype 6.0 (or above version).</p><p>From the Formula (5) of the theory model, total number of wavelets of the combination array does some effect to the far field intensity [<xref ref-type="bibr" rid="scirp.70296-ref7">7</xref>]. In this section, we computed the power of the main lobe versus the variable number of beams at a certain value of f. <xref ref-type="fig" rid="fig4">Figure 4</xref> shows the calculated <inline-formula><inline-graphic xlink:href="http://html.scirp.org/file/70296x38.png" xlink:type="simple"/></inline-formula> versus m when f = 1.0, 0.8 and 0.5 independently.</p><p>In the graph, m is the circle number of the array arrangement and the total number of the array is<inline-formula><inline-graphic xlink:href="http://html.scirp.org/file/70296x39.png" xlink:type="simple"/></inline-formula>. For example, if m = 0, the total array number is 1, if m = 5, the total number is 91. It is clear</p><p>that, the effect to the <inline-formula><inline-graphic xlink:href="http://html.scirp.org/file/70296x40.png" xlink:type="simple"/></inline-formula> by m is very small, and the <inline-formula><inline-graphic xlink:href="http://html.scirp.org/file/70296x40.png" xlink:type="simple"/></inline-formula><inline-formula><inline-graphic xlink:href="http://html.scirp.org/file/70296x41.png" xlink:type="simple"/></inline-formula> is fluctuating high and low irregularly with the variation of m. The fluctuating range is so limited that it even can be ignored compared with the effect of the array arrangement. <xref ref-type="fig" rid="fig5">Figure 5</xref> gives the near and far field intensity distribution of array arrangement and the calculated <inline-formula><inline-graphic xlink:href="http://html.scirp.org/file/70296x40.png" xlink:type="simple"/></inline-formula><inline-formula><inline-graphic xlink:href="http://html.scirp.org/file/70296x41.png" xlink:type="simple"/></inline-formula><inline-formula><inline-graphic xlink:href="http://html.scirp.org/file/70296x42.png" xlink:type="simple"/></inline-formula> value when m = 1, 3, 5. For rough evaluation of coherent laser array combination, the computed <inline-formula><inline-graphic xlink:href="http://html.scirp.org/file/70296x40.png" xlink:type="simple"/></inline-formula><inline-formula><inline-graphic xlink:href="http://html.scirp.org/file/70296x41.png" xlink:type="simple"/></inline-formula><inline-formula><inline-graphic xlink:href="http://html.scirp.org/file/70296x42.png" xlink:type="simple"/></inline-formula><inline-formula><inline-graphic xlink:href="http://html.scirp.org/file/70296x43.png" xlink:type="simple"/></inline-formula> seems to have little difference within 0.5%.</p></sec></sec><sec id="s4"><title>4. Power in the Bucket of the Main Lobe</title><p>In this section we discuss the way how to rough evaluate the coherent beam combination by the method of power in the main lobe of the array’s far field distribution. From the above analysis in Section 2 and Section 3, we know that for a given laser array, its far filed intensity distribution is determined by the factors of<inline-formula><inline-graphic xlink:href="http://html.scirp.org/file/70296x44.png" xlink:type="simple"/></inline-formula>. For the far field intensity distribution shape, the main lobe almost consistent if the f is arranged. The <inline-formula><inline-graphic xlink:href="http://html.scirp.org/file/70296x44.png" xlink:type="simple"/></inline-formula><inline-formula><inline-graphic xlink:href="http://html.scirp.org/file/70296x45.png" xlink:type="simple"/></inline-formula> of the array is the ratio of the power in the main lobe to the total power of the array in the far filed intensity distribution.</p><fig id="fig4"  position="float"><label><xref ref-type="fig" rid="fig4">Figure 4</xref></label><caption><title> PIB<sub>m</sub> versus various m at certain f</title></caption><graphic mimetype="image"   position="float"  xlink:type="simple"  xlink:href="http://html.scirp.org/file/70296x46.png"/></fig><fig id="fig5"  position="float"><label><xref ref-type="fig" rid="fig5">Figure 5</xref></label><caption><title> Near and far filed distribution and the PIB<sub>m</sub> value when m = 1, 3, 5</title></caption><graphic mimetype="image"   position="float"  xlink:type="simple"  xlink:href="http://html.scirp.org/file/70296x47.png"/></fig><p>By the Formulas (4) and (5), we can calculate the <inline-formula><inline-graphic xlink:href="http://html.scirp.org/file/70296x48.png" xlink:type="simple"/></inline-formula> in the ideal coherent combination state, and then take trap-hole method to measure the actual power in the bucket, the ratio of the actual power to the ideal calculated power is useful to evaluate the coherent combination effect of the sub lasers [<xref ref-type="bibr" rid="scirp.70296-ref8">8</xref>] [<xref ref-type="bibr" rid="scirp.70296-ref9">9</xref>]. A higher ration corresponds to a good coherent combination array. Laser’s coherent combining is focused in high-energy laser field because of its increasing focal spot power density in evidence. Traditional evaluation criterion of beam quality can't represent predominance of coherent combining over incoherent combining. According to character of coherent combining, this <inline-formula><inline-graphic xlink:href="http://html.scirp.org/file/70296x48.png" xlink:type="simple"/></inline-formula><inline-formula><inline-graphic xlink:href="http://html.scirp.org/file/70296x49.png" xlink:type="simple"/></inline-formula> method we presented for evaluation system of beam quality is constructed. This new evaluation system can represent significant predominance of coherent combining and improvement of laser's coherent combining system's performance.</p></sec><sec id="s5"><title>5. Conclusion</title><p>In this paper, we have presented formulas for the radiated intensity distributions of coherent combined Gaussian beam array via Fraunhofer scalar diffraction model. We then deduced a set of formulae useful for efficiently determining the peak irradiance and power in the bucket for single emitting apertures of hexagonal distributed laser arrays. The far-field intensity distribution for coherent combination is numerically calculated and the sensitive factors are discussed in detail. A new conception named power in the bucket of the main lobe (<inline-formula><inline-graphic xlink:href="http://html.scirp.org/file/70296x50.png" xlink:type="simple"/></inline-formula>) is proposed to measure the beam quality of combined beams. This evaluation method is useful for efficiently determining the peak irradiance and power in the bucket for single emitting apertures of general shape. Compared with other beam quality parameters, <inline-formula><inline-graphic xlink:href="http://html.scirp.org/file/70296x50.png" xlink:type="simple"/></inline-formula><inline-formula><inline-graphic xlink:href="http://html.scirp.org/file/70296x51.png" xlink:type="simple"/></inline-formula>has many advantages on physical concept, feasibility and measurement in the project.</p></sec><sec id="s6"><title>Cite this paper</title><p>Yang Liu,Xi Zhang,Debao Zhang,Wenqin Huang,Chang’an Qiao,Bo Wang, (2016) Evaluation of the Coherent Combining Lasers Array by the Power in the Bucket of the Main Lobe Method. Optics and Photonics Journal,06,30-36. doi: 10.4236/opj.2016.68B006</p></sec></body><back><ref-list><title>References</title><ref id="scirp.70296-ref1"><label>1</label><mixed-citation publication-type="other" xlink:type="simple">Fan, T.Y. (2005) Laser Beam Combining for High-Power High Radiance Sources. IEEE J. Quantum. Electron., 11, 567-577. http://dx.doi.org/10.1109/JSTQE.2005.850241</mixed-citation></ref><ref id="scirp.70296-ref2"><label>2</label><mixed-citation publication-type="other" xlink:type="simple">Li, Y.Z., Qian, L.J., Lu, D.Q., Fan, D.Y., Wen, S.C. (2007) Coherent and Inco-herent Combining of Fiber Array with Hexagonal Ring Distribution. Opt Laser Tech, 39, 957-63. http://dx.doi.org/10.1016/j.optlastec.2006.06.010</mixed-citation></ref><ref id="scirp.70296-ref3"><label>3</label><mixed-citation publication-type="other" xlink:type="simple">Zhou, Y., Liu, L.P., Peng, Q.J., et al. (2005) Phase Locking of Laser Array. SPIE, 6028, 602803.</mixed-citation></ref><ref id="scirp.70296-ref4"><label>4</label><mixed-citation publication-type="other" xlink:type="simple">Evans, G.A. and Hammer, J.M. (1993) Surface Emitting Semiconductor Lasers And Arrays. Academic Press, New York.</mixed-citation></ref><ref id="scirp.70296-ref5"><label>5</label><mixed-citation publication-type="other" xlink:type="simple">Nabors, C.D. (1994) Effects of Phase Errors on Coherent Emitter Arrays. Appl Opt, 33, 2284-2289. 
http://dx.doi.org/10.1364/AO.33.002284</mixed-citation></ref><ref id="scirp.70296-ref6"><label>6</label><mixed-citation publication-type="other" xlink:type="simple">Renwick, S.P. (2005) What Makes a Coherence Curve Change? Proc. of SPIE, 5754, 1537-1547.  
http://dx.doi.org/10.1117/12.598939</mixed-citation></ref><ref id="scirp.70296-ref7"><label>7</label><mixed-citation publication-type="other" xlink:type="simple">Li, J., Chen, Y.R., Xu, S.X., et al. (2009) Far-Field Radiation of Coherent and Incoherent Combined Lorentz-Gaussian Laser Array. Proc. of SPIE, 7749, 1-6</mixed-citation></ref><ref id="scirp.70296-ref8"><label>8</label><mixed-citation publication-type="other" xlink:type="simple">Smith, I.W. (2011) Beam Shape of Coherently-Combined Optical Arrays. Proc. of SPIE, 8052, 1-15. 
http://dx.doi.org/10.1117/12.883402</mixed-citation></ref><ref id="scirp.70296-ref9"><label>9</label><mixed-citation publication-type="other" xlink:type="simple">Tan, Y. and Li, X.Y. (2012) Numerical Analysis of Beam Quality Factor β on Coherent. Proc. of SPIE, 8551, 85511-1-9.</mixed-citation></ref></ref-list></back></article>