Togolese agriculture is predominantly rain-fed and hence fundamentally dependent on the vagaries of weather. Thus, it is negatively affected by climate change. The present study assesses farmers’ perceptions and adaptation to climate change to enhance policy towards tackling the challenges climate change poses to the farmers in the study area. Descriptive statistics and multinomial logit (MNL) were used to analyze data obtained from a cross-sectional survey executed during the 2013/2014 agricultural production year in the maritime, plateau and savannah regions of Togo. The analysis of farmers’ perception to climate change reveals high increase in temperature and decrease in rainfall. These results are in line with the trend analysis of climate data that records from 1961 to 2013 about the study area especially on the temperature. Furthermore, the results show that crop diversification, change in crops, find off-farm jobs, change of the amount of land, change of the planting date and plant short season variety are the adaptation methods employed by the farmers. Moreover, with respect to the multinomial logit analysis, the results highlight that education level, farming experience, access extension services, access to credit and access to climate information are the factors that enhance farmers’ adaptive capacity to climate change and variability. Thus, there is room for better adaptation if government intensifies activities of extension workers and ensures that farmers have access to affordable credit schemes to increase their ability and flexibility to adopt adaptation measures. There is also a need to include climate change communication to facilitate exchange of climatic information that could enable smallholder farmers to adapt to changing planting dates. Finally, investment in education systems and creation of off-farm job opportunities in the rural areas can be underlined as a good policy option.
The Intergovernmental Panel on Climate Change [1] defined climate change as statistically significant variations in climate that persisted for an extended period, typically decades or longer. It includes shifts in the frequency and magnitude of sporadic weather events as well as the slow continuous rise in global mean surface temperature. Climate change is predicted to have the main impact on agriculture, economy and livelihood of the populations of under-developed world and mainly in Sub-Saharan West Africa (SSWA) [2] . Studies [3] [4] have shown that the developing countries, in which Togo is one, are the most vulnerable regions to climate change and vulnerabilities in the world because of their dependence almost on weather.
Agriculture in Togo stands to be a major economic sector as it contributes about 38% of the nation’s GDP. More than 70% of the population of the country depends on agricultural sector for their livelihood. In addition, agriculture supplies more than 20% of the exportation revenues of the country. Despite its high contribution to the overall economy, agriculture in Togo is predominantly rain-fed and hence fundamentally dependent on the vagaries of weather [5] . Furthermore, this sector is dominated by small-scale mixed crops and livestock production, with very low productivity. However, Togolese farmers have a low capacity to adapt to such changes.
Adaptation is widely recognized as a vital component of any policy response to climate change. It is a way of reducing vulnerability, increasing resilience, moderating the risk of climate impacts on lives and livelihoods, and taking advantage of opportunities posed by actual or expected climate change [6] . The literature on adaptations also makes it clear that perception is a necessary prerequisite for adaptation. However, perceptions are influenced not only by actual conditions and changes, but are also influenced by other factors. For instance, a study by [7] found that education seemed to decrease the probability that the farmer would perceive long-term changes in rainfall. Thus, educated farmers are more likely to see that rainfall does not have a significant trend over the long run. In addition, with experience, farmers are more likely to perceive change in temperature. Moreover, farmers who have access to water for irrigation purposes are unlikely to perceive any change in the climate whether in temperature or rainfall. Also, access to extension, on the other hand, increases the probability of perceiving change in temperature. Finally, farmers with highly fertile soil are less likely to perceive change in temperature but more likely to perceive change in rainfall. Another study by [8] assessed perception of farmers in the Sekyedumase district in Ghana on changes in temperature and rainfall. They observed that more than 80% of farmers interviewed perceived an increasing temperature and a decreasing precipitation. In addition, they concluded that these results were consistent with the trend analysis of historical climate data of Sekyedumase district especially on temperature.
In addition, [9] used the Multinomial Logit Model to analyse crop and livestock choice as climate change adaptation options in Burkina Faso, Cameroon, Ghana, Niger, Senegal, Egypt, Ethiopia and Kenya, South Africa, Zambia and Zimbabwe. The results of this study revealed that crop choice was climate sensitive and farmers adapted to changes in climate by switching crops. Also, [10] examined farmers’ adaptation strategies in South Africa, Zambia and Zimbabwe. The results of this study showed that using different crop varieties, crop diversification, changing planting dates, switching from farm to non-farm activities, increased use of irrigation, and increased water and soil conservation techniques were the different adaptation measures employed by farmers in these countries.
Despite the importance of perceptions and adaptations to climate change, in the context of Togo, a very few studies have examined rural smallholder farmers’ perceptions and adaptations to climate change. This study therefore analyses how farmers perceive and adapt to climate change. Especially, this paper intends to capture the extent of farmers’ awareness and perceptions of climate variability and change and the types of adjustments they have made in their farming practices in response to these changes.
2. Materials and Methods2.1. Study Area
The study was conducted in the maritime, plateau and savannah regions of Togo (Appendix 1). The maritime and plateau regions are located at the southern part of Togo while the savannah region is at the extreme northern part. The maritime region covers an area of about 6329 km2 of land and has 373 people per km2 as population density, whereas, the plateau region covers 17,323 km2 and has 75 people per km2. Last but not least, the savannah region covers 8688 km2 of land and has 99 people per km2 as population density. Furthermore, according to [11] , 31.1% of the agricultural population of Togo are living in the plateau region, 20.75% in the maritime region and 19.85% in the savannah region.
2.2. Sampling Procedure and Sample Size
The current study is based on a cross-sectional household survey data of mixed crops and livestock farmers collected during the month of August 2014 in the Maritime, Plateaux and Savannah regions of Togo. The sample regions were purposely selected for this study based on a study by [12] entitled “L’impact des changementsclimatiques: analyse des voletsrelatifs à la pauvreté au Togo”. In this study, they came out with three vulnerable zones to climate change impact in Togo. These are: zone 1 (Maritime region and Plateaux region), zone 2 (Central region and Kara region) and zone 3 (Savannah region). Also, they disclosed that the zone 1 and zone 2 are more likely vulnerable to decrease in rainfall at 2025 horizon whereas, the zone 3 is concerned with an increase in temperature. Hence, in order to take into account both concerns―decrease in rainfall and increase in temperature―the zone 1 and zone 3 were chosen for the current study. A three stage sampling technique was applied to select sample households. In the first stage, two districts were randomly selected in the Maritime region (Zio and Vo); three from the Plateaux region (Haho, Ogou and Est-Mono) and two from the Savannah region (Tone and Kpendjal). In the second stage, two peasant associations were selected randomly from every chosen district. In the third stage, at least 20 farmers were randomly selected from each peasant association. Equally, some farmers who are not members of an association were interviewed in every district. Finally, 100 farmers were interviewed in the Savannah region as well as in the Plateaux region while 120 were interviewed in the Maritime region. In sum, a total of 320 households were selected randomly using probability proportional to size sampling technique.
2.3. Data Collection
Besides collecting data on different socioeconomic and environmental attributes, the survey also included information on farmers’ perceptions of climate change and adaptation methods. The surveyed farmers were asked questions about their observation in the temperature and rainfall patterns over the past 20 years. Also, monthly rainfall and temperature data were obtained from the Togolese main Meteorological Service in Lomé. The data cover the period from January 1961 to December 2013 for all the meteorological services located within each of three regions selected for this study.
2.4. Data Analysis
Descriptive statistics and logistic regression analysis were the main analytical techniques used in this study. Data were analyzed using the Stata 13.1 software. Correlation analysis was used to analyse the association between different variables. The hypothesized explanatory variables were checked for the existence of multi-col- linearity problem. When the absolute value of Pearson correlation coefficient between two variables is greater than 0.8, there is multi-collinearity problem. So, one of these two variables will be drop from the model.
Farmers’ Perception of Climate Change
The logit model was employed due to the nature of the decision variable; whether farmers perceived change in the temperature and/or the rainfall or not. The logit model considers the relationship between a binary dependent variable and a set of independent variables, whether binary or continuous. It is given by [13] :
where Pi is the probability of perceiving a change in the climate and Xi an independent variables. Therefore, the parameter βi gives the log odds of the dependent variable and β0 is a constant.
The probability of occurrence of an event relative to non-occurrence is called odds ratio and is given by [13] :
Farmers’ Adaptation to Climate Change
Given that we investigate several adaptation choices, the appropriate econometric model would, thus, be either a multinomial logit (MNL) or multinomial probit (MNP) regression model. Both models estimate the effect of explanatory variables on a dependent variable involving multiple choices with unordered response categories. In this study, therefore, an MNL specification is adopted to model climate change adaptation behaviour of farmers involving discrete dependent variables with multiple choices. The advantage of the MNL is that it permits the analysis of decisions across more than two categories, allowing the determination of choice probabilities for different categories [14] . So, the MNL model is used in this study for farmers’ adaptation analysis.
The multinomial log it model is useful in investigating consumer choice behaviour and has become increasingly popular in marketing research. Let C be a set of n choices, denoted by {1; 2; ∙∙∙; n}. A subject is present with alternatives in C and is asked to choose the most preferred alternative. Let xi be a covariate vector associated with the alternative i. The multinomial logit model for the choice probabilities is given by
where β is a vector of unknown regression parameters.
Unbiased and consistent parameters estimates of the MNL model in Equation (3) require the assumption of independence of irrelevant alternatives (IIA) to hold. The property of the logit model whereby Pj/Pk is independent of the remaining probabilities is called the independence from irrelevant alternatives (IIA) [13] . Specifically, the IIA assumption requires that the likelihood of a household’s using a certain adaptation measure needs to be independent of other alternative adaptive measures used by the same household. Thus, the IIA assumption involves the independence and homoscedastic disturbance terms of the adaptation model in Equation (3). The validity of the IIA assumption could be tested using Hausman’s specification, which is based on the fact that if a subset of the choice set is truly irrelevant, omitting it from the model altogether will not change parameter estimates systematically [7] . Exclusion of these choices will be inefficient but will not lead to inconsistency. But if the remaining odds ratios are not truly independent from these alternatives, then the parameter estimates obtained when these choices are included will be inconsistent [13] . The shortcoming of this technique is that all multinomial replications of a multivariate choice system have problems in interpreting the influence of explanatory variables on the original separate adaptation measures.
3. Results and Discussion3.1. Perceptions of Changes in Climate and Meteorological Stations’ Recorded Data3.1.1. Temperature Changes
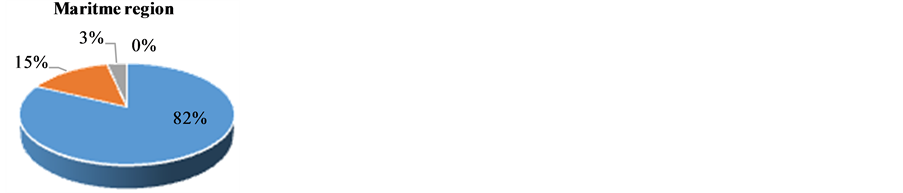
Across the three regions, about 85% of the farmers interviewed perceive changes in temperature. In the Maritime region, this percentage is 97, while in the Plateaux region it is 80 and 76 in Savannah region (Appendix 2). About 72% of the farmers perceive increases in temperature, while only 12.85% notice the contrary, a decrease in temperature. However, 9.72% of the farmers do not perceive any change in temperature (Figure 1). The statistical record of temperature data from the three regions between 1961 and 2013 shows increasing trends which are all significant at 1% level. In 53 years, the temperature has risen by 1.7 degree Celsius in the Maritime region, 0.65 degree Celsius in the Plateaux region and 1.5 degree Celsius in the Savannah region (Table 1 and Figure 2). Thus, farmers’ perceptions appear to be in accordance with the statistical record in the three regions. So, smallholder farmers in the aforementioned regions are well aware about change in the temperature.
3.1.2. Rainfall Changes
In total, 85.58% of the respondents observed changes in rainfall patterns over the past 20 years. The distribution of the farmers’ perceptions regarding changes in rainfall patterns revealed that 74.61% perceived a decrease in rainfall. In the Maritime region, 95% of farmers perceived decrease in rainfall, while in the Plateaux region it is 62% and 63% in the Savannah region (Appendix 3). Despite higher perception of the farmers interviewed on changes in rainfall patterns, 6.58% of the farmers interviewed did not see any change in rainfall patterns (Figure 3). The recorded data on rainfall from 1961 to 2013 showed a slight decreasing trend for Maritime and Plateaux regions while for savannah region, the trend is slightly increasing (Figure 4). In addition, all these trends are not
Farmers’ perceptions of changes in temperature
Linear trend of temperature data: 1961-2013
Analysis of temperature data from 1961 to 2013
Yearly Temperature
Maritime Region
Plateaux Region
Savannah Region
Mean (˚C)
27.54
25.45
28.27
Standard deviation (˚C)
0.574
0.405
0.560
Minimum temperature (˚C)
26.4
24.5
27.1
Maximum temperature (˚C)
28.8
26.2
29.5
Trend (˚C/year)
0.0334***
0.0125***
0.0286***
Correlation
0.8813
0.4882
0.7907
Total change calculated from the trend (˚C/53 years)
1.737
0.650
1.487
***p < 0.01 Student’s t-test, N = 53. Total change is the difference between the trend line value of the first and last year.
Farmers’ perceptions of changes in rainfall
Rainfall linear trend 1961-2013
statistically significant. The correlation between rainfall and time is also insignificant. Indeed, there is a large variability in the amount of precipitation from year to year. The same pattern is observed in each district (Table 2). Therefore, farmers’ perceptions of a reduction in rainfall over the past 20 years is explained by the fact that, as [15] noticed, some farmers place more weight on recent information than is efficient.
3.2. Logistic Regression of Determinants of Perception of Changes in the Climate
Table 3 presents the correlations between all the variables hypothesized to influence farmers’ perception of changes in the climate.
Among the variables, the age of the farmer was found to be correlated inversely with education (ρ = −0.035), while it was highly positive and significant at p < 0.01 level of significance with farming experience (ρ = 0.825). By the same token, there has been a strong positive association between gender and land tenure at p < 0.01.
Most importantly, the analysis showed that there is multi-collinearity problem between age and farming experience. Thus, the variable age was dropped from the model because most of farmers are old and variable farming experience is more relevant for the study than the latter.
The independent variables are gender, education, farming experience, farm size, land tenure, soil fertility, access to extension services, access to climate information, access to credit, farmers’ group membership, and region dummy for Plateaux and Savannah with Maritime being the reference region for comparison.
The results displayed in Table 4 below showed the following:
Farming experience seems to decrease the probability that the farmer will perceive long-term changes in rainfall and temperature. Thus, educated farmers are more likely to see that rainfall does not have a significant trend and less likely to perceive that temperature does not have a significant trend over the long run.
Analysis of the rainfall data from 1961 to 2013
Yearly total rainfall
Maritime region
Plateaux region
Savannah region
Mean (mm)
942.7
1514.2
1054.4
Standard deviation (mm)
193.06
263.86
120.99
Minimum rainfall (mm)
557.1
982.6
808.6
Maximum rainfall (mm)
1528.2
2150.7
1323.4
Trend (mm/year)
−1.142
−2.625
0.181
Correlation
−0.0913
−0.1537
0.0231
Total change calculated from the trend (mm/53 years)
−59.38
−136.52
9.42
Total change calculated from the trend (%)
−6.11
−8.63
0.89
Correlation matrix of the independent variables
Gender
Age
Education
Farming experience
Farm
Land tenure
Soil fertility
Extension
Credit
Farmers’ group
Climate information
Gender
1.0000
Age
−0.0959
1.0000
Education
0.1767*
−0.0351
1.0000
Farming experience
−0.1311*
0.8253*
−0.0466
1.0000
Farm size
−0.0186
0.1274*
0.0912
0.1372*
1.0000
Land tenure
0.3535*
0.0445
−0.0639
−0.0420
−0.1305*
1.0000
Soil fertility
0.1150*
0.0485
−0.0470
0.0343
−0.0210
0.2594*
1.0000
Extension
−0.0292
0.1840*
0.0252
0.2648*
0.2433*
−0.0798
−0.0515
1.0000
Credit
−0.0348
0.1524*
0.1183*
0.1294*
0.1294*
−0.0003
−0.0342
0.3576*
1.0000
Farmers’ Group
0.2197*
−0.0046
0.0047
−0.0957
−0.1052
0.2409*
0.1068
0.0496
0.1057
1.0000
Climate information
0.0839
0.0860
0.0734
0.1098
0.2011*
0.0008
0.0763
0.3085*
0.1534*
−0.0202
1.0000
*p < 0.01. All correlations are Pearson’s r.
Logistic regression of farmers’ perception of changes in the climate in the study area
Total change is the difference between the trend line value of the first and last year
Male farmers are more likely to perceive change in temperature than female farmers;
Farm land ownership, on the other hand, increases the probability of perceiving change in temperature;
The results also confirm that being in the Plateaux Region or the Savannah Region decreases the probability of perceiving climate change (in temperature and rainfall) than being in the Maritime region;
Also, farm size, access to credit, access to extension services, being member of farmers’ association, and soil fertility influence positively farmers’ perception of changes in the climate of the study area.
3.3. Farmers’ Adaptation Analysis3.3.1. Adaptation Strategies by Farmers in the Face of Increased Temperature, Reduced Rainfall and Disrupted Rainfall Patterns
The adaptation methods employed by farmers in the study area are indicated in Table 5. Even though a large number of farmers interviewed noticed changes in climate as mentioned above, the results show that almost 42% did not undertake any remedial actions.
Indeed, seven adaptation measures could be identified in the study area as farmers’ responses to increased temperature, reduced rainfall and disrupted rainfall patterns. Planting short season variety (20.38%) and changing crop planting dates (17.87%) were identified as the major adaptation strategies to climate change in the study area, while only a few (9.72%) opted for crop diversification. As indicated, planting short season variety is most commonly used method, whereas changing type of crops is the least practiced among the major adaptation methods identified in the study area. Greater use of planting short varieties as an adaptation method could be associated with the access to extension services (ICAT and NGOs) and the ongoing PNIASA project in agriculture sector in Togo that provided farmers with improved seeds.
3.3.2. Determinants of Farmers’ Adaptation Choices
In this section, the MNL model for adaptation choices to climate change in the study area was estimated. The MNL adaptation model was run and tested for the IIA assumption, using the Hausman specification test. As a result, the test failed to reject the null hypothesis of independence of odds of other alternative (Appendix 4), suggesting that there is no evidence against the correct specification for the adaptation model. Therefore, the application of the MNL specification to the data set for modelling climate change adaptation behavior of farmers is justified. The estimation of the multinomial logit model for this study was undertaken by normalizing one category, which is normally referred to as the “reference state,” or the “base category.” In this analysis, the first category (no adaptation) is the reference state. Thus, Table 6 displays the estimated coefficients which should be compared with the base category that is “no adaptation”. The likelihood ratio statistics as indicated by χ2 = 301.39 are highly significant at 1%, suggesting strong explanatory power of the model. The following summarizes the results from the MNL analysis.
Adaptations strategies in response to change in temperature and precipitation (%)
Adaptation strategies
Increase in temperature and Decrease in rainfall (%)
Education level of the farmers increases the probability of uptake of adaption options to climate change. As can be observed in Table 6, education level significantly increases planting short season variety as an adaptation method in the study area. Moreover, the coefficient of change in crops is positive indicating a positive relationship between education and change in crops as adaptation method to climate change. These results are consistent with findings by [14] [16] [17] , who reported that education increases the probability of adapting to climate change.
Farmer experience increases the probability of uptake of crop diversification, changing planting dates and planting short season variety as adaptation measures. Experienced farmers are more likely to adopt changing planting dates and planting short season variety and less likely to diversify crops in the study area. These results confirm the findings of [7] [10] [16] . The import is that highly experienced farmers are likely to have more information and knowledge on changes in climatic conditions. Experienced farmers are usually leaders and progressive farmers in rural communities and these can be targeted in promoting adaptation management to other farmers who do not have such experience and are not yet adapting to changing climatic conditions.
Access to extension services: the results show that Access to extension services significantly increases the probability of taking up adaptation options in the study area. Indeed, farmers who have access to extension services are more likely to adopt planting short season variety and less likely to diversify crops and to change planting dates as adaptation options. Extension services provide an important source of information on climate change as well as agricultural production and management practices. Farmers who have significant extension contacts have better chances to be aware of changing climatic conditions and also of the various management practices that they can use to adapt to changes in climatic conditions. Similarly, [18] reported the significant determination of access to extension services for farmers to plant trees in response to perceived climate change. [17] also found that access to agricultural extension services affected farmers’ climate change adaptation choices significantly.
Access to credit: As expected, the results show that having access to credit increases the propensity of farmers to adapt to climate change. Farmers who have access to credit are more likely to adopt planting short season variety and less likely to find off-farm jobs in the study area. The import is that poverty or lack of financial resources is one of the main constraints to adjustment to climate change and thus having access to credit counteracts these constraints. Also, with more financial and other resources at their disposal, farmers are able to change their management practices in response to changing climatic conditions. Similarly, the reports from [14] explained that access to credit increases the likelihood that farmers will employ adaptation measures. Moreover, [19] disclosed that affordable credit increases financial resources of farmers and their ability to meet transaction costs associated with various adaptation options they might want to adopt.
Access to climate information: As expected, the results show that access to information on climate change (temperature and rainfall) has a significant and positive impact on farmers’ adoption of changing planting dates and planting short season varieties. These results are in line with findings by [14] [16] Moreover, almost all of the coefficients of access to climate information are positive across all the manifold adaptation options in the study area indicating a positive relationship between climate information and adaptation to climate change. Surprisingly, land tenure, soil fertility and membership in farmers’ group have decreased the farmers’ propensity to adopt crop diversification, off-farm jobs, planting short season variety and changing planting dates as adaptation measures to climate change in the study area.
4. Conclusions and Policy Implications
The study analyzed the factors affecting the farmers’ perceptions and choice of adaptation methods to climate change based on a cross-sectional survey data collected during the 2013/2014 agricultural production year in the maritime, plateau and savannah regions of Togo. The surveyed farmers were asked if they had observed any change in temperature and rainfall over the past 20 years. As a result, about 85% of the farmers perceived increase in temperature while in total, 85.58% of the respondents observed changes in rainfall patterns over the past 20 years. These results are in line with the climatic data that records in the study area because the statistical analysis of temperature data from 1961 to 2013 showed an increasing trend in the three regions and rainfall data showed decreasing trends for maritime and plateau regions while for savannah region, the trend was slightly increasing.
Regarding the determinants of farmers’ perceptions of climate change, male gender farmers are more likely to perceive change in temperature than female gender; owing a farm land, on the other hand, increases the probability of perceiving change in temperature; and farming in plateau region or savannah region decreases the probability of perceiving climate change (in temperature or rainfall) unlike farming in maritime region.
Although farmers appear to be well aware of climate change, few seem to actively undertake adaptation measures to counteract climate change. Indeed, almost 42% did not undertake any remedial actions. The adaptation options observed in the study area are manifold but the main adaptation strategies of farmers identified include planting short season variety and changing crop planting dates.
The study used the multinomial logit (MNL) model to assess the factors influencing farmers’ choices of climate change and variability adaptation methods. In the model, the dependent variables include different adaptation methods and the explanatory variables include household, farm and institutional characteristics and other factors. The results highlighted that education level, farming experience, access extension services, access to credit and access to climate information are the factors that enhance farmers’ adaptive capacity to climate change and variability.
This study demonstrates the importance of government policies and strategic investment plans which should support improved access to climate forecasting and dissemination, ensure that farmers have access to affordable credit schemes to increase their ability and flexibility to adopt adaptation measures in response to the forecasted climate conditions. Moreover, given that extension services are inadequate in the study area, improving the knowledge and skills of extension service personnel and making the extension services more accessible to farmers appear to be some of the key elements of a fruitful adaptation program. Finally, investment in education systems and creation of off-farm job opportunities in the rural areas can be underlined as a policy option regarding reduction of the adverse impacts of climate change in the study area.
Acknowledgements
I wish to express my profound gratitude to West African Science Service Centre on Climate Change and Adapted Land Use (WASCAL) for financing this research. I also thank the WASCAL management team at Université de Lomé for their technical support.
Cite this paper
AgossouGadédjisso-Tossou, (2015) Understanding Farmers’ Perceptions of and Adaptations to Climate Change and Variability: The Case of the Maritime, Plateau and Savannah Regions of Togo. Agricultural Sciences,06,1441-1454. doi: 10.4236/as.2015.612140
Appendices
Appendix 1. Study area.
Appendix 2. Farmers’ perceptions of changes in temperature per region.
Appendix 3. Farmers’ perceptions of changes in rainfall per region.
Appendix 4. Hausman Tests of IIA Assumption (MNL Model).
ReferencesIPCC (Core Writing Team, Pachauri, R.K. and Reisinger, A., Eds.) (2007) Climate Change 2007: Synthesis Report. Contribution of Working Groups I, II and III to the Fourth Assessment Report of the Intergovernmental Panel on Climate Change. IPCC, Geneva.Akponikpe, P., Johnston, P. and Agbossou, E.K. (2010) Farmers’ Perceptions of Climate Change and Adaptation Strategies in Sub-Sahara West Africa. 2nd International Conference on Climate, Sustainability and Development in Arid Regions, Fartaleza, Brazil, 16-20 August 2010, Page.IPCC (2001) Incidences de l’évolution du climat dans les régions: Rapport spécial sur l’Evaluation de la vulnérabilité en Afrique. Island Press, Washington DC, 53 p.Mendelsohn, R., Dinar, Y. and Dalfelt, A. (2000) Climate Change Impacts on African Agriculture. Yale University and World Bank, USA.MERF (Ministère de l’Environnement et des Ressources Forestières) (2010) Deuxième Communication Nationale sur les changements climatiques: Convention-Cadre des Nations Unies sur les Changements Climatiques. Presse de l’Université de Lomé, Togo.Acquah-de Graft, H. and Onumah, E. (2011) Farmers’ Perceptions and Adaptations to Climate Change: An Astimation of Willingness to Pay. Agris, 3, 31-39.Gbetibouo, G.A. (2009) Understanding Farmers’ Perceptions and Adaptations to Climate Change and Variability, the Case of the Limpopo Basin, South Africa: IFPRI Discussion Paper 00849, IFPRI, Washington DC.
http://www.ifpri.org/publication/understanding-farmers-perceptions-and-adaptationsclimate-change-and-variabilityFosu-Mensah, B., Vlek, P. and Manschadi, M. (2010) Farmers’ Perceptions and Adaptations to Climate Change: A Case Study of Sekyedumase District in Ghana. A Contributed Paper Presented at World Food Systems Conference, Tropentag, 14-16 September 2010.Kurukulasuriya, P. and Mendelson, R. (2006) Crop Selection: Adapting to Climate Change in Africa. CEEPA. Discussion Paper No. 26. Centre for Environmental Economics and Policy in Africa, Pretoria.Nhemachena, C. and Hassan, R. (2007) Micro-Level Analysis of Farmers’ Adaptations to Climate Change in Southern Africa. Environment and Production Technology Division, International Food Policy Research Institute, Washington DC.DSID (2013) Des principaux indicateurs socio-économiques du secteur rural au Togo. FAO, Rome.PNUD (2011) L’impact des changements climatiques: analyse des volets relatifs à la pauvreté au Togo. Rapport Final.Greene, W.H. (2003) Econometric Analysis. 5th Edition, Prentice Hall, Upper Saddle River, 1026.Deressa, T.T., Hassan, R.M., Ringler, C., Alemu, T. and Yusuf, M. (2009) Determinants of Farmers’ Choice of Adaptation Methods to Climate Change in the Nile Basin of Ethiopia. Global Environmental Change, 19, 248-255.
http://dx.doi.org/10.1016/j.gloenvcha.2009.01.002Maddison, D. (2006) The Perception of and Adaptation to Climate Change in Africa. CEEPA. Discussion paper No. 10, Centre for Environmental Economics and Policy in Africa, University of Pretoria, Pretoria.Ajao, A. and Ogunniyi, L. (2011) Farmers’ Strategies for Adapting to Climate Change in Ogbomoso Agricultural Zone of Oyo State. Agris On-Line Papers in Economics and Informatics, 3, 3-13.Getachew, S., Tilahun, T. and Teshager, M. (2014) Determinants of Agro-Pastoralist Climate Change Adaptation Strategies: Case of Rayitu Woredas, Oromiya Region, Ethiopia. Research Journal of Environmental Sciences, 8, 300-317. http://dx.doi.org/10.3923/rjes.2014.300.317Bryan, E., Deressa, T.T., Gbetibouo, G.A. and Ringler, C. (2009) Adaptation to Climate Change in Ethiopia and South Africa: Options and Constraints. Environmental Science & Policy, 12, 413-426.Hassan, R. and Nhemachena, C. (2008) Determinants of African Farmers’ Strategies for Adapting to Climate Change: Multinomial Choice Analysis. African Journal of Agricultural and Resource Economics, 2, 83-104.