Results on the regional variances of university-industry patent licensing activities had been arranged in the following subsections: First, we look into the local knowledge transferring patterns of each region; second, the patterns of regional universities out licensing patents to industry had been studied; finally, the patterns of regional industries receiving patents from universities had been investigated. These three sections had classified the university-industry knowledge flow into three directions: local universities to local industries, local universities to non-local industries and non-local universities to local industries.
The fourth column in
The second column had shown the local licensing data and the regions in the first column were ranked by this category. Local licensing data represented the total volume of patents that had been transferred from universities to companies in the same ego district. Numbers in this category had two implications. First, they indicated the knowledge contribution of universities to the local economy. Second, they indicated the efficiency of local knowledge utilization of industries. The average local licensing number was 113.98, with a standard deviation of 168.10. Jiangsu, Guangdong, Anhui, Zhejiang and Shanghai ranked top 5 in local licensing numbers. Inference from these data was that both universities and companies in these regions had actively involved in the academic invention commercialization process.
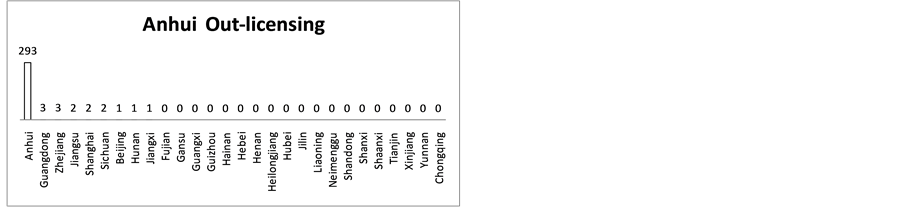
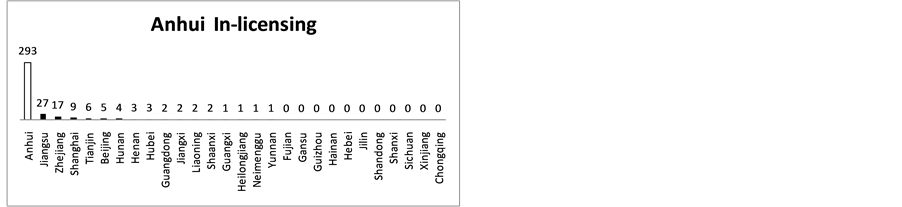
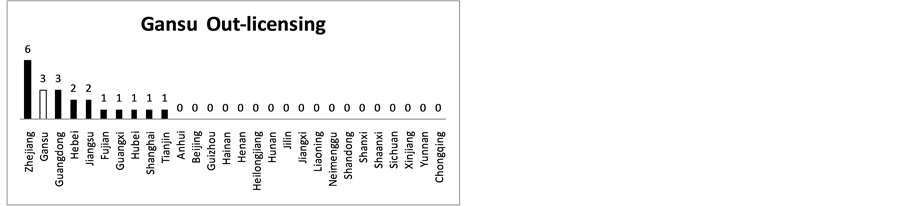
Besides, the average local licensing ratio in this dataset equaled to 56.18% (113.96/2022.86), larger than 50%. In the aspect of academic knowledge out-licensing, 25 of these 28 regions’ universities had transferred the largest amount of patents to local industries, except for Gansu, Shanxi and Hainan. Hainan had no academic patents transferred out therefore was not account. The largest amount of knowledge transferring in Gansu and Shanxi had been generated from Gansu to Zhejiang and from Shanxi to Guangdong. In the aspect of academic knowledge receiving, 26 of 28 regions’ industries had absorbed the largest amount of patents from local universities, except for Hainan and Xinjiang, in which the largest amount of knowledge transferring had been generated from Jiangsu to Hainan and from Jiangsu to Xinjiang. These results indicated that relatively large portion of academic patents bad been transferred into local industries. This result had supported the academic perspective of localization effects on knowledge flow [
| Region | Local licensing | Total out-licensing | Total in-licensing | Local out-licensing ratio | Local in-licensing ratio |
|---|---|---|---|---|---|
| Jiangsu | 818 | 1080 | 1416 | 75.74% | 57.77% |
| Guangdong | 386 | 469 | 903 | 82.30% | 42.75% |
| Anhui | 293 | 308 | 379 | 95.13% | 77.31% |
| Zhejiang | 273 | 433 | 595 | 63.05% | 45.88% |
| Shanghai | 158 | 580 | 234 | 27.24% | 67.52% |
| Shandong | 146 | 229 | 293 | 63.76% | 49.83% |
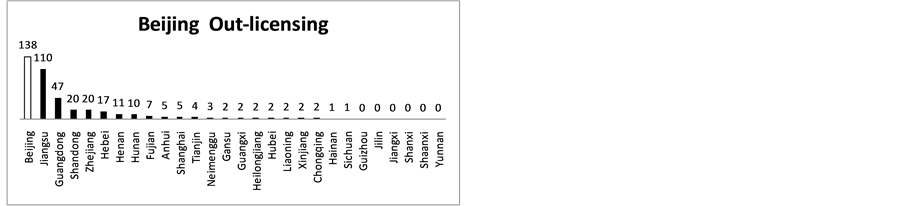
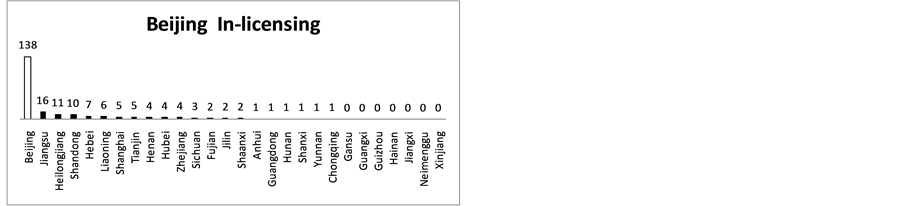
| Beijing | 138 | 413 | 225 | 33.41% | 61.33% |
| Hubei | 122 | 240 | 208 | 50.83% | 58.65% |
| Tianjin | 122 | 303 | 144 | 40.26% | 84.72% |
| Hunan | 118 | 176 | 191 | 67.05% | 61.78% |
| Fujian | 104 | 117 | 207 | 88.89% | 50.24% |
| Hebei | 81 | 119 | 184 | 68.07% | 44.02% |
| Heilongjiang | 73 | 191 | 89 | 38.22% | 82.02% |
| Shaanxi | 68 | 299 | 73 | 22.74% | 93.15% |
| Chongqing | 64 | 137 | 71 | 46.72% | 90.14% |
| Sichuan | 55 | 137 | 88 | 40.15% | 62.50% |
| Liaoning | 47 | 106 | 71 | 44.34% | 66.20% |
| Jilin | 34 | 62 | 44 | 54.84% | 77.27% |
| Guangxi | 19 | 38 | 72 | 50.00% | 26.39% |
| Henan | 19 | 57 | 58 | 33.33% | 32.76% |
| Shanxi | 14 | 93 | 25 | 15.05% | 56.00% |
| Yunnan | 14 | 27 | 26 | 51.85% | 53.85% |
| Jiangxi | 9 | 23 | 24 | 39.13% | 37.50% |
| Neimenggu | 8 | 10 | 23 | 80.00% | 34.78% |
| Gansu | 3 | 21 | 6 | 14.29% | 50.00% |
| Guizhou | 3 | 10 | 8 | 30.00% | 37.50% |
| Xinjiang | 2 | 2 | 10 | 100.00% | 20.00% |
| Hainan | 0 | 0 | 13 | NA | 0.00% |
| Mean | 113.96 | 202.86 | 202.86 | ||
| SD | 168.10 | 233.96 | 309.04 |
Data in local licensing number, total out-licensing number, total in-licensing number had been shown in a bar diagram in
bers added up the number of patents that the local universities had transferred to companies in other regions. The total in-licensing numbers were the results of local licensing numbers added up the number of patents that the local industries received from universities in other regions. Therefore, as long as a region had a large number in local licensing, the total out-licensing number and total in-licensing number, which could not be less than local licensing number, would also be large.
To conclude, universities had licensed out more amounts of patents to local industries and the local patents transferred from local universities to local industries through licensing channel were unevenly distributed. Although all 28 regions had local licensing, a small number of regions had been actively involved in local academic licensing than the other regions.
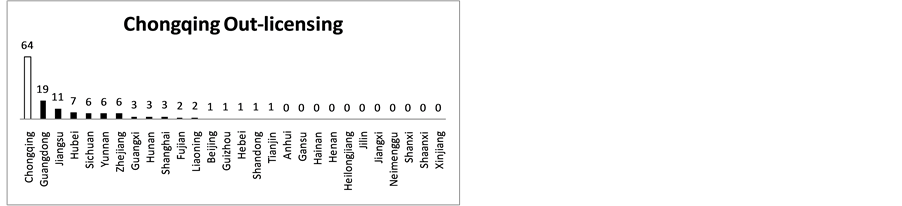
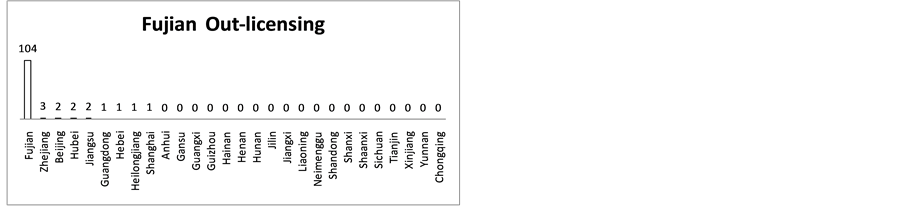
Local licensing numbers could only reveal the academic knowledge transferred from local universities to local industries. Considering each region as a set of academic resources, there had been other patents transferred from ego region to other regions. Some region had transferred more knowledge to other regions and some regions had not. The knowledge out transferring intensity and directions could reflect a region’s ability as the main academic knowledge producer and practitioner. Regions that had transferred more knowledge to other regions had much academic impact on the other region’s industry. The capacity of each region’s knowledge out transferring would be studied in this part.
| Label | Non-local out-licensing | Total out-licensing | Non-local out-licensing ratio |
|---|---|---|---|
| Shanghai | 422 | 580 | 72.76% |
| Beijing | 275 | 413 | 66.59% |
| Jiangsu | 262 | 1080 | 24.26% |
| Shaanxi | 231 | 299 | 77.26% |
| Tianjin | 181 | 303 | 59.74% |
| Zhejiang | 160 | 433 | 36.95% |
| Heilongjiang | 118 | 191 | 61.78% |
| Hubei | 118 | 240 | 49.17% |
| Guangdong | 83 | 469 | 17.70% |
| Shandong | 83 | 229 | 36.24% |
| Sichuan | 82 | 137 | 59.85% |
| Shanxi | 79 | 93 | 84.95% |
| Chongqing | 73 | 137 | 53.28% |
| Liaoning | 59 | 106 | 55.66% |
| Hunan | 58 | 176 | 32.95% |
| Hebei | 38 | 119 | 31.93% |
| Henan | 38 | 57 | 66.67% |
| Jilin | 28 | 62 | 45.16% |
| Guangxi | 19 | 38 | 50.00% |
| Gansu | 18 | 21 | 85.71% |
| Anhui | 15 | 308 | 4.87% |
| Jiangxi | 14 | 23 | 60.87% |
| Fujian | 13 | 117 | 11.11% |
| Yunnan | 13 | 27 | 48.15% |
| Guizhou | 7 | 10 | 70.00% |
| Neimenggu | 2 | 10 | 20.00% |
| Hainan | 0 | 0 | NA |
| Xinjiang | 0 | 2 | 0.00% |
| Mean | 88.89 | 202.86 | |
| SD | 102.70 | 233.96 |
side means that a large number of regions didn’t transferred patents to outside regions. Hainan and Xinjiang, in particular, had no patents licensed to other regions. The fourth column in
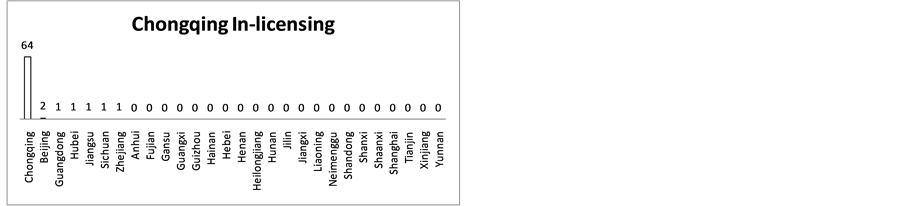
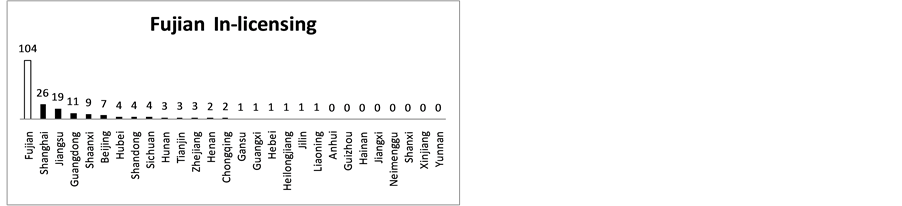
Besides the capacity of local university knowledge exportation, the capacity of local industries absorbing and utilizing academic inventions also mattered. Private companies in some regions could find more academic resources and make good use of them. The absorptive capacity capture by these companies could generate competitive advantage for them. Results in