Based on 2022 and 2023 hydrometric data and satellite images (Sentinel 2022, SPOT 2010), this study aims to present the Nokoué Lake and its channels’ re-cent hydromorphological characteristics. Integrating flow, tributary morphology, and topography data determined specific power values along the axes studied. The values obtained range from 2.69 to 12.92 W/m2 for Ouémé River and 2.46 to 10.99 W/m2 for Sô River. The resulting water erosion on banks and bottoms is of linear, areolar, or gully and claw types. Lake bathymetry varies from -0.5 to -2.6 m (low flow period) and -1 to -4 m; in the Ouémé, Sô, and Totchè rivers, it varies from -5 m to -7 m, reaching -10 m at the Cotonou channel entrance (flood period). Bathymetric profiles reveal varied “U”, “V” and “Intermediate” bottom morphologies, influenced by erosion/sedimentation processes and human activities. The flow facies identified are lentic in the northern tributaries and lotic in the Cotonou and Totchè canals. Spatial analysis identified nine (09) thematic classes. In 2022, the surface area of the water body has increased from 274 km2 at low water to 280 km2 at high water, whereas in 2010 (a recent year of exceptional flooding), the surface area was 270 km2 at low water and 277 km2 at high water. Significant changes in land use are observed between 2010 and 2022. The floodplain area decreased slightly, from 421 km2 in 2010 (year of exceptional flooding) to 419 km2 in 2022. The evolution of land use shows a progressive expansion of the urban environment to the detriment of the natural environment. In the medium to long term, this trend could threaten the hydromorphological balance and even the existence of this important lagoon ecosystem.
Nokoué Lake Ouémé River Sô River Cotonou Channel Hydromorphology1. Introduction
Hydromorphological studies are of paramount importance for the sustainable management of watercourses and associated ecosystems. They offer the prospect for preserving aquatic ecosystems, flood risk prevention, sustainable river development planning, rehabilitation and balanced management of water resources [1] [2] .
In Benin, Nokoué lake and its tributaries have been the subject of several research studies, which have shown that this complex has a seasonal hydrological regime, with a low-water period from December to April and a high-water period from September to November [3] - [15] . Exchanges between the lake and its tributaries are significant. Bathymetric analyses over the last ten years have revealed a considerable reduction in depth, mainly due to sedimentary input and anthropogenic activities. According to [16] , a reduction in depth of around 0.6 m was observed after 20 years (from 1986 to 2006), i.e. around 0.03 m/year. This gradual filling of the lake could be linked to the enormous sediment inputs from the Ouémé River into the lake during high-water periods [17] and to the effect of fishing plant encumbrances [10] . This study integrates hydrological and satellite data from 2010, 2022 and 2023 to present the current hydromorphological status of Nokoué lake and its tributaries. The objective is to establish a robust foundation for comprehending the recent evolution of the hydromorphological system of Nokoué Lake and its channels, while identifying potential risk factors associated with the observed changes.
2. Presentation of Study Area
Situated between parallels 6˚34’ and 6˚57’ North and meridians 2˚34’ and 2˚57’, the study area comprises Nokoué lake and the termini of its main tributaries: Ouémé and Sô rivers, Totchè canal and Cotonou channel [4] [18] (Figure 1). With a surface area of around 150 km2 at low water, Nokoué lake is separated from the Atlantic Ocean by a long, wide-barrier beach on which the city of Cotonou is built. It extends for around 20 km from east to west and 11 km from north to south [19] [20] . It is a peri-urban lake bordering three major conurbations, namely Cotonou, Abomey-Calavi and Sémè-Podji with a population of
over 1.5 million [21] [22] . The lake is linked to the Porto-Novo lagoon to the east by the Totchè canal of 5 km long and around 200 m to 300 m wide; to the south by the Cotonou channel of 4.5 km long and around 300 m wide; and to the north by the Sô and the Ouémé rivers [19] [23] . The Ouémé River, 523 km long and between 42 m and 125 m wide, rises in the Donga department in northern Benin and drains a watershed of 46,500 km2 [19] . The Sô River, 70 km long and between 25 m and 80 m wide, drains a catchment area of 1000 km2 and is connected to the Ouémé River during high-water periods. The riparian forest bordering the channels is made up of swampy forest and savannah, crops and fallow land, with or without palm trees. At Nokoué Lake, the vegetation consists of Paspalum vaginatum, Cyperus articulenius, Phragmites australis, Eichornia crassipes, Crotalaria retusa, Penisetum palystachion and Pista stratiotes. Soils are ferralitic, slightly denatured, impoverished and hydromorphic or low-humus to pseudo-gley at tributary level. Around the lake, clayey soils and littoral sands are present [18] .
The Table 1 summarizes the characteristics of the main tributaries and the linear lengths considered in this study.
3. Materials and Methods
The methodological approach adopted began by a selection of existing hydrological data (water levels; flows) present within the office of Benin General Directorate for Water (DGEau). This was followed by in situ several campaigns of measurement of flows and bathymetry, and finally by processing of the data collected and satellite images acquired.
3.1. Materials
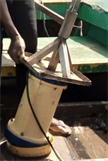
The equipment used for this study includes a Garmin GPS for georeferencing, a “Rio Grande” Acoustic Doppler Current Profilers (ADCP), equipped with four acoustic transducers emitting at a frequency of 1200 kHz, for flow measurements by gaging and a Garmin 521s dual-frequency Doppler echosounderbathymeter for bathymetric measurements (Plate 1).
3.2. Methods
· Selection of hydrological data
Flow data for the years 2010 to 2022 from the Bonou station located on the Ouémé River and upstream of the study area were collected from the DGEau. Water level data were from Bonou station located at the North of the study area as well as from stations of Hêtin-sota, Sô-Ava and Fisheries Directorate located in our study area.
Lengths of the studied tributaries and linear features
Nokoué Lake
Total Length
Study Line
Catchment Area
River Ouémé
523 km
15.011 km
46,500 km2
Sô River
70 km
12.30 km
1000 km2
Totchè Canal
5 km
4.019 km
-
Cotonou Channel
4.5 km
4.010 km
-
(a) (b) (c)
Plate 1. Views of the ADCP (a) et (b) and Garmin 521s echosounder (c) deployed on the Ouémé River and Nokoué lake (July 2022).
· Field work
The seasonal field campaigns took place in July, September, November 2022 and March 2023 for flow measurements and bathymetry.
○ Flow measurements and specific power estimation
Stream flow can be calculated in a number of ways. According to [2] , flow can be determined by:
Q = ∑ ( V × A ) (1)
where: Q—flow (in cubic meters per second); V—current velocity measured at each cell by the ADCP (in meters per second); A—cross-sectional area of the flow corresponding to each cell (in square meters).
Flow data acquired during the 2022 and 2023 seasonal gaging campaigns, have been processed to obtain campaign and river averages values. Additional flow and water level data from stations close to the study area were used. Monthly and multi-year averages from 2010 to 2022 were calculated and some hydrographs were produced. This enabled a comparative analysis of flows in the various tributaries. In addition, flow data were used to determine total and specific power values along the studied watercourses [24] .
A river power is used to measure a river’s efficiency in sediment transport and bed modification. It can be determined by:
Ω = γ Q J (2)
where: Ω—power in W/m; γ—water density in N/m3 (9810 N/m3): J—slope of the energy line in m/m and Q—flow rate considered in m3/s.
The specific power ω is defined as the quantity of energy transported by the water flow per unit width of the river. It thus characterizes the dynamic potential of erosive processes per river section (energy) for a given flood and cross-section [24] .
ω = Ω / L (3)
where: ω—specific power in W/m2; Ω—power in W/m; L—bed width for flow Q.
○ Bathymetric measurements
Bathymetric measurements were carried out in October 2022 and March 2023.
These measurements concerned Nokoué lake, Sô and Ouémé Rivers, Cotonou channel and Totchè canal.
The bathymetric data collected were processed with various software programs to produce bathymetric maps and profiles [25] [26] [27] .
○ Spatial analysis
Satellite images (SPOT5 from 2010 and Sentinel 2A and 2B from 2022) were downloaded from the ESA website (https://scihub.copernicus.eu/dhus/#/home)
Relationship between specific power and stream bank erodibility
Specific Power
>100 W/m2
100 - 30 W/m2
30 - 10 W/m2
<10 W/m2
Bank Erodibility
Strong
Average
Low
None
and used to analyze land and water distributions around Nokoué lake, Ouémé and Sô Rivers from 2010 to 2022 (Figure 2). An object-oriented classification approach based on pseudo-spectral bands was adopted [28] [29] (Table 2).
The characteristics of the satellites are summarized in Table 3 below.
Object-oriented classification with the hierarchical classification algorithm is an effective method for classifying areas where land use is fragmented and complex [29] . The implementation steps led to change detection, using transition matrices to represent changes from one category to another [4] [19] . The methodological approach made it possible to present the spatio-temporal variations of the different classes in 2010 and in 2022-2023.
4. Results4.1. Hydrological Regime
· Water levels and flows
Water level measurements have shown that the hydrological regime of the various tributaries is linked to seasonal variations. The monthly average of water levels on the tributaries from 2010 to 2022 is shown on Figure 3. During the year, the peaks are reached in September but the highest water levels (over 300 cm), is noted in October at the Fisheries Directorate station which is located at the southern part of the study area. For the Bonou station located upstream of our zone, the peak recorded is 440 cm.
Characteristics of the multispectral satellite data used for the study
Satellites
Agency
Year of Launch
Type Sensor
Broke
Spatial Resolution (m)
Bands Spectral
Frequency Acquisition
SPOT5
(CNES)
2002/2015
Optics
60 km wide
Multispectral: 10 meters
Visible and close infrared (4 bands)
1 to 3 days
SENTINEL 2A and 2B
ESA (Euopean Space Agency)
2015/2017
Optics
290 km
Multi spectral: 10, 20, 60
Visible and close infrared (13 bands)
5 days
Comparative analysis of water level and flow data clearly shows a unimodal regime, with perfect correlation between these parameters (Figure 4). The Ouémé River, in accordance with his morphological and hydrological characteristics, exhibits higher flows and water levels than the Sô River, indicating greater water transport capacity.
Average of flows measured during the 2022-2023 campaigns vary from −185.19 m3/s in Totchè canal to 1404.15 m3/s in Cotonou channel (Figure 5). The negative flow values on the Totchè canal indicate the inversion of the usual water flow direction, resulting from the daily influences of the tides. This observation underlines the importance of the tides in the hydrological dynamics of the region, and their effects on flows near coastal areas. The average of flood flow obtained on the studied Ouémé River is 415.21 m3/s, (compared with 773.35 m3/s recorded at Bonou during the exceptional flood of 2010), making it the most important tributary in terms of flow. This underlines the importance of the Ouémé River in hydro-sedimentary transfer processes toward Nokoué lake, particularly during flood periods.
· Specific power and bank erosion
Specific powers and bank erosion have been estimated for Ouémé and So tributaries. Bank erosion processes are a function of specific power (Table 2) and soil type. The coordinates of the measurement points and corresponding values are shown in (Table 4). The highest specific power values are noted upstream and decreasing downstream as the river approaches its mouth. On the Ouémé River, the highest specific power (12.92 W/m2) comes from a segment with a section of 92.39 m wide. This value corresponds to a relatively high flow rate of 608.57 m3/s and a bed topography, that favours increased conversion of potential
Measurement points and their specific powers
Ouémé River
Sô River
Points
X_Long
Y_Lat
Flow (m3/s)
Power (W/m)
Specific Power (W/m2)
Points
X_Long
Y_Lat
Flow (m3/s)
Power (W/m)
Specific Power (W/m2)
O8
448,579
723,142
671.35
1317.19
12.54
S4
433,757
725,356
289.36
567.72
7.34
O9
448,868
721,661
653.97
1283.09
11.83
S5
434,193
722,994
342.37
671.73
8.53
O10
448,826
718,917
608.57
1194.02
12.92
S6
434,108
720,945
357.10
700.64
10.99
O11
449,925
717,986
588.26
1154.16
11.82
S7
434,105
719,398
288.63
566.29
6.61
O12
449,986
717,219
280.03
549.42
9.68
S8
433,578
718,757
332.46
652.28
8.96
O13
449,933
715,120
242.49
475.76
9.08
S9
433,558
717,694
300.28
589.16
8.49
O14
449,422
713,356
146.43
287.30
4.90
S10
433,600
717,508
227.40
446.16
5.60
O15
449,144
713,365
106.71
209.36
2.91
S11
434,489
717,377
247.48
485.56
6.39
O16
447,897
713,286
112.10
219.95
2.69
S14
434,567
717,081
151.99
298.21
4.55
S15
434,334
716,332
137.03
268.86
4.13
S18
434,786
720,121
43.35
85.05
2.46
energy into kinetic energy, is capable to induce more significant erosion and geomorphological modification processes. The lowest specific power, 2.69 W/m2, comes from a segment with a section of 81.72 m wide, and reflects a lower level of energy per unit width. This value corresponds to a low flow rate (112.10 m3/s) and a bed topography that restricts the transformation of potential energy into kinetic energy. On the Sô River, the hightest specific power is 10.99 W/m2 for a segment with a section of 63.73 m wide, while the minimum specific power is 2.46 W/m2 is related to a segment with a section of 34.54 m wide.
Segments colored in red along our studied sections of tributaries represent areas of high erosion, mainly due to high flows and soil characteristics. Segments colored in salmon-pink correspond to areas of moderate erosion, while segments colored in blue represent areas of low-bank erosion (Figure 6).
Different types of water erosion were observed in the study area. Areolar type of erosion (wash load) is observed in large sections, notably on the Cotonou channel and on certain tributary stretches (segment). Linear type of erosion is dominant and mainly observed in the northern part of the study area where removal of solid particles from the banks and the bottoms of watercourses and collapse of banks are noticeable (Plate 2). Near the lake, depending of the power of the flows, erosion is of gully or claw types. While runoff causes significant soil loss and watershed degradation, it also defines areas of deposition and erosion. Along the studied sectors, the sections with low specific powers are determined by a low erosion capacity, a zone of deposition and accumulation of fine sediments and a relatively flat bottom.
Plate 2. Views of eroded sections bank on the Sô and Ouémé rivers.
4.2. Morphology of the Study Area
· Bathymetry
At flood stage (October 2022), the bathymetry of Nokoué lake and its channels shows significant depths of up to 10 m in some sectors (Figure 7). At lake level, the edges have shallow depths, generally between −1 m and −2 m, while the center of the lake has average depths between −2 m and −4 m.
During the low-water period (March 2023), the bathymetry of Nokoué lake
and its channels shows depths of up to −6 m and −7 m on the Ouémé and Cotonou channels studied (Figure 8). At lake level, the edges have depths of between −0.5 m and −1.2 m, and the center of the lake has average depths of between −1.6 m and −2.4 m.
The bathymetric results for October 2022 and March 2023 highlight significant seasonal variations in depths in Nokoué lake and its channels. These variations reflect the influence of the hydrological regime, essentially controlled by rainfall, dredging activities and the clogging of the lake with plant debris.
· Bottom morphology
To present the bottom morphology of Nokoué lake, bathymetric data from seven (07) transects (four oriented North-South and three West-East) were acquired during low-water conditions. This made it possible to present the corresponding bathymetric profiles at non-standardized scales.
○ Lake bottom morphology
For depths not exceeding 3 m in the lowest central zone, the profiles show, overall, three types of morphology at Nokoué lake level: “V”, “U” and “Intermediate” (Figure 9 and Figure 10). The north-south profiles (Figure 9) show a relatively gentle slope from north to center, and a steeper slope from the center
of the lake to the south. The eastern sector (profiles AA’ and BB’) is less indented than the western sector (profiles CC’ and DD’), which has a “V”-shaped bottom with clearer variations in depth due to significant hydro-sedimentary inputs from tributaries. The different bottom shapes correspond to flow zones.
The lake bottom in a west-east direction has an intermediate, almost flat morphology (Figure 10). In the eastern and western sectors, the erosive effect of the tributaries becomes less pronounced from north to south (profiles GG’ and FF’), leading to a significant accumulation of sediment on either side of the central zone in the southern part (profile EE’). The central zone, which is less notched in the northern sector of the lake, is heavily notched in the transition zone with the Cotonou channel. Notched areas are associated with sectors close to tributary mouths and flow corridors. “U” shapes are associated with weaker currents, favouring sedimentation, while “V” shapes can be observed at mouths and along flow corridors.
○ Longitudinal profiles of tributaries
Cross transects on tributaries essentially yielded asymmetrical “U” and “V” profiles. Longitudinal profiles were produced to observe morphological variations along the studied river courses.
1) The longitudinal profile of the main tributary, the Ouémé River, shows a variation in depth from −6 m to −4 m upstream and from −4 m to −2 m downstream (Figure 11). There is a gradual decrease in depth towards the lake. The numerous gradients observed mainly reflect the connection zones with the multiple branches observed along the linear route. Also, flow corridors and dredging activities should not be overlooked.
2) The longitudinal profile of the Sô River shows a relatively flat bottom of around -4 m in depth over the more or less straight northern half, with almost no branches. Over the last six (6) kilometers of the river’s length, there is a gradual decrease in depth, with two major drops of almost 3 m each marking the junction with the Ganvié and Vêkky branches (Figure 11).
The Ganvié and Vêkky arms, shown in green and blue respectively (Figure 12), have almost flat bottoms with depths of less than −4 m. These depths gradually decrease towards the lake, reaching −2 m. Only the connection zones with the Sô River are marked by deep notches ranging from −6 to −4 m.
3) The longitudinal profile of the Cotonou channel can be divided into two topographically homogeneous sectors with varying gradients (Figure 12). The upstream section has a relatively steep, non-rectilinear gradient over the first half of its length. The second half is characterized by a gradual rise of around 1 m over the remaining 2 km of the linear section. The bottom profile is highly variable, with gradients that punctuate the profile. This unevenness in the central zone may be the result of development work carried out to install structures (bridges) on the linear section.
4) The longitudinal profile of the Totchè canal shows a gentle slope from west to east, resulting in an increase in the depth of the lake towards the Porto-Novo lagoon. Two notches at 500 m and 2500 m from the lake are probably linked to junction points between the canal and river branches of unequal size (Figure 13).
4.3. Flow Facies
Flow facies are generally linked to the hydrodynamic conditions and morphological characteristics of the watercourse. The simplified key to determining flow facies is based on four criteria: depth, flow velocity, cross-sectional profile and longitudinal profile of the stretches of the studied segment [30] . Based on these criteria, the Ouémé river, the Totchè canal and the Cotonou channel can be characterized by wetland-type facies which, depending on the section, can be subdivided into lentic channels, concave wetlands and lotic channels. The Sô River as a whole displays flow facies of the lotic channel type upstream and flat lentic to running downstream. These flow facies, generated by the geodynamic processes of erosion and solid transport, are one of the main tools for linking the hydromorphological and ecological functioning of rivers.
4.4. Remote Sensing Contributions
For the spatial analysis of 2010 and 2022 satellite images of the study area, the visible spectral bands (blue, green, red) were used to visualize the presence of water, the near-infrared bands to map vegetation, and the mid-infrared bands to study soil composition (Figure 14). Classification was used to present the different classes of features or areas present in the images. The spatial analysis made it possible to identify nine (09) thematic classes. The results were then compared, class by class, in order to evaluate the changes. The information quality evaluation criteria calculated for each image gave values close to 1, validating the methodology used in image processing and indicating high information reliability. For the 2010 SPOT image, the kappa is 0.88 and the overall accuracy is 0.90. For the Sentinel 2B image from 2022, the kappa is 0.90 and the overall accuracy is 0.92. The classifications made it possible to obtain quantitative information on land occupation during these periods and on the temporal and spatial evolution of this occupation in the study area.
For the year 2010, variations in water distribution within the study area are highlighted by comparing low-water and flood periods. These variations are shown in blue. The surface area of all the water bodies is 270 km2 at low water (Figure 15(a)), and 277 km2 at high water, with a floodplain (wetland) of around 421 km2 (Figure 15(b)).
For the year 2022, the surface area of the water bodies is 274 km2 at low water and 280 km2 at high water, with a floodplain (wetland) of 419 km2. The results of processing SPOT5 and Sentinel 2B satellite images show that morphological variation in the study area over a 12-year period is not very significant, with only minor changes to the shape of the lake (Figure 15(a) and Figure 16(a)). At the scale of the maps presented (Figure 15 and Figure 16), the channels show virtually no morphological variation.
Changes in land use over the period 2010-2022 were assessed. Among the factors influencing land cover change, human factors are more important than physical ones. Firstly, there is a significant and gradual expansion of the urban environment associated with a densification of existing areas then, a spatial expansion of this environment. The results show a trend towards an increase in anthropogenic formations at the expense of natural formations. Barren land and built-up areas have not undergone any conversion, but have increased at a rate of 3.6% and 69.15% respectively. Forest formations as a whole regressed by 4.29% and converted by 4.82%. Much of the vegetation has been destroyed for agricultural purposes, handicrafts (acadjas) or even domestic use (firewood).
5. Discussion
The results obtained show that the hydrological regime of our study area is strongly influenced by rainfall variations. This hydrological pattern confirms the results of some previous work [3] [9] [15] [31] [32] [33] . Indeed, the seasonal regimes of the Ouémé and Sô rivers determine freshwater inflows to the lake, with flows of up to 671.35 m3/s on the Ouémé and 357.10 m3/s on the Sô. Variations in flow along the Ouémé and Sô rivers have enabled us to calculate the specific power of each section and determine the type of erosion that characterizes it.
Bathymetric results revealed that most of the lake has less than −2 m depths, and 20% of its surface area displays less than −1 m depths. In 1978, areas less than −1 m accounted for 18.5% of the total lake area, but by 2015 they had almost doubled to 31.7% [19] [20] . Currently, these shallow areas are growing steadily (40%). This spatio-temporal evolution of the lake’s bathymetry is an important indicator of environmental changes and hydrological conditions in the region [34] . It is thought to be linked both to the significant sediment inputs from the tributaries, and to the increasing use of traditional fishing systems known as “acadjas”, which continue to encumber the lake. Different current velocities, stream depths and section morphology have led to the identification of lentic and lotic flow facies.
The mapping of the evolution of land use showed the change in classes distribution over the period 2010 to 2022. The year 2010 was marked by an exceptional flood. The lake area increased from 270 km2 in 2010 to 274 km2 in 2022. Morphological change is difficult to perceive, due to the expansion of settlements around most of the lake. The floodplain area was 421 km2 in 2010 and 419 km2 in 2022. The various results validation indices show values close to 1, indicating the conformity of our results with the reality on the ground small objects, which have a similar spectral value or the same texture, have been well distinguished. For future studies, it should be noted that field campaigns are really necessary. The information obtained in the field would allow us to fully understand the land use types of the territory and to create an appropriate hierarchy of classes for object-oriented classification, while allowing better validation of the classifications. A land use mapping approach that would integrate classifications from high-resolution images should also be considered.
All the results presented can be used for predictions linked to the hydrological cycle and hydrological modeling of the study area.
6. Conclusion
This study is a major contribution assessment of the current hydromorphological features of Nokoué lake and its main tributaries. The hydrological and morphological data for Nokoué lake show that the high flows measured in September, reaching up to 653.79 m3/s on the Ouémé and 357.10 m3/s on the Sô, were identified as the main cause of this large flooded area. The specific powers obtained reveal different types of erosion. Bathymetric results showed that Nokoué lake has mainly shallow depths ranging from −0.5 to −2.4 m, while the channels present greater depths, resulting from erosional processes and artisanal dredging activities to meet local needs. Bathymetric profiles revealed various lake-bottom shapes. The lake has relatively flat bottom morphology, except at its various mouths. The flow facies identified are of wet type (concavity wetland, lotic channel and flat lentic facies). Spatial analysis revealed little variation in the lake’s surface area over twelve-years. The surface increased from 270 km2 in 2010 to 274 km2 in 2022. However, during flood periods, water surface was of 421 km2 in 2010 and 419 km2 in 2022. The change in land use showed that there is a significant and gradual expansion of the urban environment associated with a densification of existing areas then, a spatial expansion of this environment. The analysis of variations in water and land use between low and high flows periods is an important step in integrated water resource management, environmental preservation and adaptation to climate change.
Acknowledgements
The authors thank the Institute of Research for Development (IRD) team, both in Benin and in Marseille. We would also like to thank the IRHOB and DGEau (in Benin) for their collaboration.
Funding
This work has received financial support from the African Centers of Excellence (ACE Partner) project, which is part of the funding programme of the World Bank and French Development Agency (AFD) through Institute of Research for Development (IRD).
Data Availability Statement
The data presented in this study is available on request from the corresponding author. The data is not accessible to the public as it is the property of the ACE Partner project and the General Direction for Water of Benin.
Conflicts of Interest
The authors declare no conflicts of interest regarding the publication of this paper.
Cite this paper
Yonouwinhi, T.J.-B., d’Almeida, G.A.F.A., Abagale, F.K. and Akowanou, A.V.O. (2024) Assessment of the Recent Hydromorphological Features of Nokoue Lake and Its Channels (South-East Benin). Open Journal of Modern Hydrology, 14, 33-55. https://doi.org/10.4236/ojmh.2024.141003
ReferencesVivier, A., et al. (2022) Principes fondamentaux et exemple d’application du «Guide pour l’élaboration des suivis d’opérations de restauration hydromorphologique en cours d’eau». Naturae, No. 5, 101-111.
https://doi.org/10.5852/naturae2022a5Kuss, D., Queffelean, Y., Carladous, S. and Martin, R. (2022) EVOFOND: Un modèle 1D pour la simulation des processus d’ érosion et de dépôt survenant au cours de crues torrentielles intenses.
https://www.barrages-cfbr.eu/IMG/pdf/c2pres_colloque_tsmr-cfbr_2022__kuss.pdfGu, G. and Adler, R.F. (2004) Seasonal Evolution and Variability Associated with the West African Monsoon System. Journal of Climate, 17, 3364-3377.
https://doi.org/10.1175/1520-0442(2004)017<3364:SEAVAW>2.0.CO;2Villanueva, M.C.S. (2004) Biodiversité et relations trophiques dans quelques milieux estuariens et lagunaires de l’Afrique de l’ouest: Adaptations aux pressions environnementales. http://ethesis.inp-toulouse.fr/archive/00000115/Chouti, W., Mama, D. and Alapini, F. (2010) Etude des variations spatio-temporelles de la pollution des eaux de la lagune de Porto-Novo (sud Bénin). International Journal of Biological and Chemical Sciences, 4, 1017-1029.
https://doi.org/10.4314/ijbcs.v4i4.63040Sossou-Agbo, A.L. (2013) La mobilité des populations dans le complexefluvio-lagunaire de la bassevallée de l’Ouémé au Bénin, enAfrique de l’Ouest. Master’s Thesis, Université de Grenoble, Grenoble.Zandagba, J., Moussa, M., Obada, E. and Afouda, A. (2016) Hydrodynamicmodeling of Nokoué Lake in Benin. Hydrology, 3, Article 44.
https://doi.org/10.3390/hydrology3040044Chouti, K., Atchichoe, W., Tometin, L. and Daouda, M. (2017) Biodisponibilité et mobilité du phosphore des sédiments de la lagune de Porto-Novo. Journal of Applied Biosciences, 114, 11276-11288. https://doi.org/10.4314/jab.v114i1.1Attogouinon, A., Lawin, A.E., M’Po, Y.N.T. and Houngue, R. (2017) Extreme Precipitation Indices Trend Assessment over the Upper Oueme River Valley-(Benin). Hydrology, 4, Article 36. https://doi.org/10.3390/hydrology4030036Djihouessi, M.B. and Aina, M.P. (2018) A Review of Hydrodynamics and Water Quality of Lake Nokoué: Current State of Knowledge and Prospects for Further Research. Regional Studies in Marine Science, 18, 57-67.
https://doi.org/10.1016/j.rsma.2018.01.002Djihouessi, B., Bernauld, M. and Aina, M.P. (2018) A Review of Habitat and Biodiversity Research in Lake Nokoué, Benin Republic: Current State of Knowledge and Prospects for Further Research. Ecohydrology & Hydrobiology, 19, 131-145.
https://doi.org/10.1016/j.ecohyd.2018.04.003Administratif Régional, C. (2022) Glossaire inondation à destination des DREAL de bassin dans le cadre de l’élaboration des PGRI Terme Sigle Définition Références et sources. https://rhone-mediterranee.eaufrance.fr/gestion/inondations/pgri-2022-2027Lawin, A.E., Hounguè, R., M’Po, Y.N.T., Hounguè, N.R., Attogouinon, A. and Afouda, A.A. (2019) Mid-Century Climate Change Impacts on Ouémé River Discharge at Bonou Outlet (Benin). Hydrology, 6, Article 72.
https://doi.org/10.3390/hydrology6030072Chaigneau, A., et al. (2021) Impact du changement global sur les systèmes lagunaires en Afrique de l’ Ouest: Le cas du lac Nokoué au Bénin.
https://www.esiwace.eu/services/dyamodChaigneau, A., et al. (2022) From Seasonal Flood Pulse to Seiche: Multi-Frequency Water-Level Fluctuations in a Large Shallow Tropical Lagoon (Nokoué Lagoon, Benin). Estuarine, Coastal and Shelf Science, 267, Article ID: 107767.
https://doi.org/10.1016/j.ecss.2022.107767Yantikoua, S., Laïbi, R., Adechina, R., Kaki, C., Mama, D. and Laleye, P. (2021) Dynamique hydrologique et évolution morpho sédimentaire du lac Ahémé au Sud-Ouest du Bénin. European Scientific Journal, 17, 77-98.
https://doi.org/10.19044/esj.2021.v17n10p77Mama, D., et al. (2011) Caractérisation d ’ un Système Lagunaire en Zone Tropicale: Cas du lac Nokoué (Bénin). European Journal of Scientific Research, 56, 516-528.Gadey, F. and Texierb, H. (1986) Distribution and Nature of Organic Matter in Recent Sediments of Lake NokouC , Benin (West Africa). Estuarine, Coastal and Shelf Science, 22, 767-784. https://doi.org/10.1016/0272-7714(86)90098-3Mama, D. (2010) Méthodologie et résultats du diagnostic de l’eutrophisation du lac Nokoue (bénin). Master’s Thesis, Université de Limoges, Limoges.Zandagba, J. (2017) GestionIntégrée des Ressources en Eau: Fonctionnement hydrodynamique et qualité physico-chimique du lac Nokoué.Ph.D. Thesis, Université d’Abomey-Calavi, d’Abomey-Calavi.Aina, M.P., Djihouessi, B., Vissin, E.W., Kpondjo, N.M., Gbèdo, V. and Sohounhloué, K.C.D. (2012) Characterization of the Domestic Wastewaters and Dimensionality of a Pilot Treatment Station by Lagooning at Abomey Calavi City-Benin. Journal of Engineering Sciences, 1, 45-50.Cotonou-bénin, D., Adjahouinou, D.C., Liady, N.D. and Fiogbe, D. (2012) Diversité phytoplanctonique et niveau de pollution des eaux du collecteur de Dantokpa (Cotonou-Bénin). International Journal of Biological and Chemical Sciences, 6, 1938-1949.
https://doi.org/10.4314/ijbcs.v6i5.4Gnohossou, P.M. (2006) La faune benthique d’une lagune Ouest Africaine (Le lac Nokoue au Bénin), diversité, abondance, variations temporelles et spatiales, place dans la chaine trophique. Master’s Thesis, Institut National Polytechnique de Toulouse, Toulouse.Eau, E. (2016) Evaluation de l’efficience probable du projet de restauration. Marché de maîtrise d’œuvre relatif à la création de deux zones de surinondation sur le ru de Gally—Avant Projet (AVP).Gbinibou Andemi, H., d’Almeida, G.A.F., Bio Djara, M., Accalogoun, L., Adechina, R.A. and Kaki, C. (2021) Hydro-Sedimentary Dynamics of the Grand-Popo Lagoon Located Upstream of the Mobile Embouchure “Bouche du Roy” in South-Western Benin. Journal of Geoscience and Environment Protection, 9, 98-112.
https://doi.org/10.4236/gep.2021.911008Iradukunda, P., Sang, J.K., Nyadawa, M.O. and Maina, C.W. (2021) Effet de la sédimentation sur la capacité de stockage du lac Nakuru, Kenya. Journal of Sustainable Research in Engineering, 5, 149-158.Iradukunda, P. and Bwambale, E. (2021) Reservoir Sedimentation and Its Effect on Storage Capacity—A Case Study of Murera Reservoir, Kenya. Cogent Engineering, 8, Article ID: 1917329. https://doi.org/10.1080/23311916.2021.1917329Humaines, S., Pr, S., Costel, L. and Universit, E. (2012) Contribution de la télédétection à l’ évaluation des fonctions des zones humides: De l’observation à la modélisation prospective. https://theses.hal.science/tel-00731169Botroh, A.M. (2020) Apport de la télédétection pour l’identification des anciens méandres des cours d’ eau. https://hal.inrae.fr/hal-02602062Malavoi, J.R. and Souchon, Y. (2002) Standardized Description of Streams and Rivers Channel Geomorphic Units: Qualitative Description Key and Physical Measurements. Knowledge and Management of Aquatic Ecosystems, No. 365-366, 357-372.Zandagba, J., Adandedji, F.M., Mama, D., Chabi, A. and Afouda, A. (2016) Assessment of the Physico-Chemical Pollution of a Water Body in a Perspective of Integrated Water Resource Management: Case Study of Nokoué Lake. Journal of Environmental Protection, 7, 656-669. https://doi.org/10.4236/jep.2016.75059Ahokpossi, D.P., Atangana, A. and Vermeulen, P.D. (2018) Hydro-Geochemical Characterizations of a Platinum Group Element Groundwater System in Africa. Journal of African Earth Sciences, 138, 348-366.
https://doi.org/10.1016/j.jafrearsci.2017.11.032Sultan, B. and Janicot, S. (2023) Laboratoire de Météorologie Dynamique, Ecole Polytechnique, 91128 Palaiseau Cedex, Franc.Fran, A. and Developpement, A.D.E. (2018) Marché subséquent n° CZZ2197/MS/ 2018/06 ayant pour objet la réalisation de l’ étude de faisabilité complémentaire. Réinventer la cité lacustre de Ganvié, 33, 214.