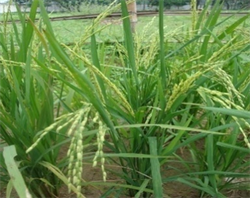
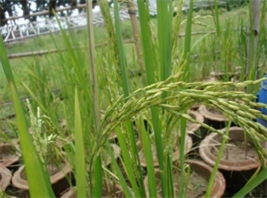
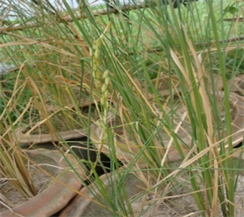
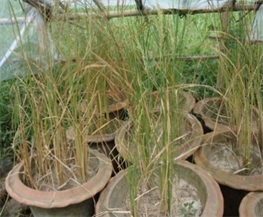
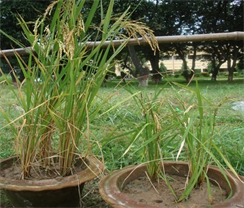
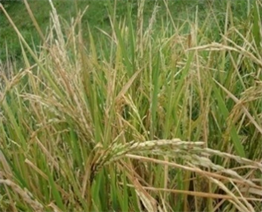
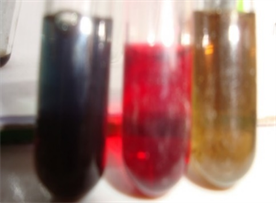
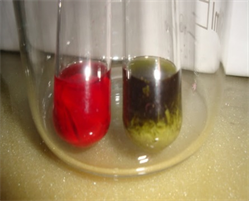
<?xml version="1.0" encoding="UTF-8"?><!DOCTYPE article  PUBLIC "-//NLM//DTD Journal Publishing DTD v3.0 20080202//EN" "http://dtd.nlm.nih.gov/publishing/3.0/journalpublishing3.dtd"><article xmlns:mml="http://www.w3.org/1998/Math/MathML" xmlns:xlink="http://www.w3.org/1999/xlink" dtd-version="3.0" xml:lang="en" article-type="research article"><front><journal-meta><journal-id journal-id-type="publisher-id">AJPS</journal-id><journal-title-group><journal-title>American Journal of Plant Sciences</journal-title></journal-title-group><issn pub-type="epub">2158-2742</issn><publisher><publisher-name>Scientific Research Publishing</publisher-name></publisher></journal-meta><article-meta><article-id pub-id-type="doi">10.4236/ajps.2022.136060</article-id><article-id pub-id-type="publisher-id">AJPS-118236</article-id><article-categories><subj-group subj-group-type="heading"><subject>Articles</subject></subj-group><subj-group subj-group-type="Discipline-v2"><subject>Biomedical&amp;Life Sciences</subject></subj-group></article-categories><title-group><article-title>
 
 
  Water Stress Effect on Biochemical Processes of Aus Rice Genotypes
 
</article-title></title-group><contrib-group><contrib contrib-type="author" xlink:type="simple"><name name-style="western"><surname>Halima</surname><given-names>Sayeed Jasmine</given-names></name><xref ref-type="aff" rid="aff1"><sup>1</sup></xref></contrib><contrib contrib-type="author" xlink:type="simple"><name name-style="western"><surname>Kamal</surname><given-names>Uddin Ahamed</given-names></name><xref ref-type="aff" rid="aff2"><sup>2</sup></xref></contrib><contrib contrib-type="author" xlink:type="simple"><name name-style="western"><surname>Jiban</surname><given-names>Krishna Biswas</given-names></name><xref ref-type="aff" rid="aff3"><sup>3</sup></xref></contrib></contrib-group><aff id="aff1"><addr-line>Sher-e-Bangla Agricultural Research System (SAURES), Sher-e-Bangla Agricultural University (SAU), Dhaka, Bangladesh</addr-line></aff><aff id="aff3"><addr-line>Bangladesh Rice Research Institute (BRRI), Gazipur, Bangladesh</addr-line></aff><aff id="aff2"><addr-line>Department of Agricultural Botany, Sher-e-Bangla Agricultural University (SAU), Dhaka, Bangladesh</addr-line></aff><pub-date pub-type="epub"><day>13</day><month>06</month><year>2022</year></pub-date><volume>13</volume><issue>06</issue><fpage>912</fpage><lpage>927</lpage><history><date date-type="received"><day>7,</day>	<month>March</month>	<year>2022</year></date><date date-type="rev-recd"><day>27,</day>	<month>June</month>	<year>2022</year>	</date><date date-type="accepted"><day>30,</day>	<month>June</month>	<year>2022</year></date></history><permissions><copyright-statement>&#169; Copyright  2014 by authors and Scientific Research Publishing Inc. </copyright-statement><copyright-year>2014</copyright-year><license><license-p>This work is licensed under the Creative Commons Attribution International License (CC BY). http://creativecommons.org/licenses/by/4.0/</license-p></license></permissions><abstract><p>
 
 
  An experiment was carried out at Sher-e-Bangla Agricultural University, Dhaka, Bangladesh during the period from March to July 2014. Plants were grown in the rain
  -
  protected polyethylene shelter or shed to avoid rain under natural conditions. The experiment was conducted on biochemical characters of aus rice varieties in various soil moisture levels in three rice genotypes as BRRI dhan55 (V<sub>1</sub>), BR6976-2B-15 (V<sub>2</sub>)
  ,
   and tolerant check Hashikalmi (V<sub>3</sub>)
  ,
   and seven water stress w
  ere
   imposed as treatments. Treatments were 0 days 
  of 
  water stress (control) irrigated continuously throughout the experimental period (T<sub>0</sub>). From twenty days onwards water stress was imposed for seven days when the age of the seedling was 20 days (T<sub>1</sub>), 35 days (T<sub>2</sub>), 55 days (T<sub>3</sub>), 75 days (T<sub>4</sub>), 95 days (T<sub>5</sub>)
  ,
   and 115 days (T<sub>6</sub>). Our findings suggest that the proline, starch
  ,
   and sugar content w
  ere
   also found comparatively higher in BRRI dhan55 and Hashikalmi among the genotypes under water stress conditions. Under water stress conditions
  ,
   proline w
  as
   accumulated, sugar
  ,
   and starc
  h were decreased. The soluble sugar content was much lower under water stress condition
  s
   due to lower RWC, chlorophyll content, stomatal conductance
  ,
   and higher leaf rolling. Leaf accumulates anthocyanins under drought conditions and the red color increased as the intensity of water stress increased.
 
</p></abstract><kwd-group><kwd>Water Stress</kwd><kwd> Genotypes</kwd><kwd> Proline</kwd><kwd> Starch and Sugar</kwd></kwd-group></article-meta></front><body><sec id="s1"><title>1. Introduction</title><p>Water deficit is a major problem in growing rice, especially in the low rainfall seasons [<xref ref-type="bibr" rid="scirp.118236-ref1">1</xref>]. Biochemical processes were massively affected by drought and the activities of antioxidant enzymes and proline accumulation were associated with the dry mass production and consequently with the drought tolerance of the upland rice varieties [<xref ref-type="bibr" rid="scirp.118236-ref2">2</xref>]. It was also reported that water deficit is one of the major environmental threats to rice (Oryzasativa L.) cultivation and production [<xref ref-type="bibr" rid="scirp.118236-ref3">3</xref>]. Rice is more susceptible to drought than any other crop. It is estimated that the world needs to produce 40% more rice to feed the population by 2025 [<xref ref-type="bibr" rid="scirp.118236-ref4">4</xref>].</p><p>In agriculture, mild to severe drought has been one of the major production limiting factors. Drought reduces plant growth by affecting various physiological and biochemical processes, such as photosynthesis, respiration, translocation, ion uptake, carbohydrates and nutrient metabolism, and growth promoters [<xref ref-type="bibr" rid="scirp.118236-ref5">5</xref>]. Metabolic changes during drought affect the reduction of nutrients such as carbohydrates, nitrates, and potassium concentration decreases [<xref ref-type="bibr" rid="scirp.118236-ref6">6</xref>]. It is also suggested that the high relative water content could help the tolerant variety to perform physio-biochemical processes more efficiently under water stress treatments than the susceptible variety [<xref ref-type="bibr" rid="scirp.118236-ref7">7</xref>]. Progressive drought stress induced a considerable accumulation of proline in water stressed maize plants. Proline accumulation was the first response of plants exposed to water-deficit stress in order to reduce injury to cells [<xref ref-type="bibr" rid="scirp.118236-ref8">8</xref>]. In the case of rice, shoot accumulate proline in water stress conditions, and also ABA accumulates in water stress conditions [<xref ref-type="bibr" rid="scirp.118236-ref9">9</xref>].</p><p>Anthocyanin content was increased under water stress conditions. Leaf accumulates anthocyanins under drought conditions and the color increased as the intensity of water deficit conditions. Anthocyanin was water-soluble pigment found in all plant tissues [<xref ref-type="bibr" rid="scirp.118236-ref10">10</xref>]. Anthocyanins had been located in the root, shoot and leaves. Anthocyanins had been found in or just below the upper epidermis of leaves and often appear at specific developmental stages found that anthocyanins usually appear red in leaf cells, but depending on their chemical nature and concentration, the vacuolar p<sup>H</sup>, and interactions with other pigments, they can result in pink, purple, blue, orange, brown, and even black leaf colors [<xref ref-type="bibr" rid="scirp.118236-ref11">11</xref>] [<xref ref-type="bibr" rid="scirp.118236-ref12">12</xref>].</p><p>There is an urgent need to increase rice production to meet global demand [<xref ref-type="bibr" rid="scirp.118236-ref4">4</xref>]. Severe water stress may result in the arrest of photosynthesis, disturbance of metabolism and finally, the death of plants [<xref ref-type="bibr" rid="scirp.118236-ref5">5</xref>]. Hence, water stress management strategies need to be taken for better yield and improved varieties that are more resilient to abiotic stresses. Agricultural technology related to crop production has to be developed according to specific location. Considering the above-mentioned facts, the present research work was undertaken to achieve the following objectives to find out the responses of biochemical processes of aus rice genotypes under water deficit conditions.</p></sec><sec id="s2"><title>2. Materials and Methods</title><sec id="s2_1"><title>2.1. Experimental Site</title><p>The experiment was conducted at the Plant Physiology Laboratory (central laboratory) and Agricultural research field of Agricultural Botany, Sher-e-Bangla Agricultural University, Dhaka-1207, Bangladesh under polythene shed controlling the intrusion of rainfall.</p></sec><sec id="s2_2"><title>2.2. Experimental Period</title><p>The experiment was conducted during the period from March 2014 to July 2014</p></sec><sec id="s2_3"><title>2.3. Genotypes and Treatments</title><p>Three BRRI materials as BRRI dhan55 (V<sub>1</sub>), BR6976-2B-15 (V<sub>2</sub>) and tolerant check Hashikalmi (V<sub>3</sub>) were collected from Genetic Resource and Seed Division, Bangladesh Rice Research Institute. Seven drought conditions were used as treatments that started from 20 days of seedling age.</p><p>T<sub>0</sub> = Irrigated continuously throughout the experimental period (control).</p><p>T<sub>1</sub> = Drought condition during 7 days, when the age of the seedling was 20 days.</p><p>T<sub>2</sub> = Drought condition was applied for second 7 days, when the age of the seedling was 35 days.</p><p>T<sub>3</sub> = Drought condition was applied for third 7 days, when the age of the plant was 55 days.</p><p>T<sub>4</sub> = Drought condition was applied for fourth 7 days, when the age of the plant was 75 days.</p><p>T<sub>5</sub> = Drought condition was applied for fifth 7 days, when the age of the plant was 95 days.</p><p>T<sub>6</sub> = Drought condition was applied for sixth 7 days, when the age of the plant was 115 days.</p></sec><sec id="s2_4"><title>2.4. Experimental Design, Replications</title><p>The experiment was designed as RCBD, three replications, three genotypes and seven water deficit treatments (63 pots) were used.</p></sec><sec id="s2_5"><title>2.5. Seed Treatment and Sowing</title><p>Seeds of uniform size and shape of each genotype were treated with Bavistin 5 gm for 20 minutes. The solution was prepared by dissolving 5 g of Bavistin in 1/2 liter of water. Treated seeds were place in the Petridish with water (Plate 1). Pre-soaked sprouted seeds were sown on March, 2014 in earthen pots under the rain protected polyethylene shade.</p></sec><sec id="s2_6"><title>2.6. Pot Preparation and Fertilizer Management</title><p>Earthen pots of 38 cm &#215; 25 cm in size were used and filled up with 10 kg sandy loam soil. The soil of the experimental area was sandy and sandy loam (Plate 2). The soil of the pot was fertilized uniformly with 0.9, 0.8, 0.8 g urea, triple super phosphate and muriate of potash corresponding to 160-150-150 kg urea, triple super phosphate and muriate of potash per hectare, respectively [<xref ref-type="bibr" rid="scirp.118236-ref13">13</xref>]. Experimental duration was March to July, 2014. After seedling establishment, three uniform and healthy seedlings were allowed to grow per pot. The sprouted seeds were normally irrigated for ensuring normal growth. Water stress was imposed for seven days, when the age of the plant was 20, 35, 55, 75, 95 and 115 days.</p><disp-formula id="scirp.118236-formula20"><graphic  xlink:href="//html.scirp.org/file/13-2605263x2.png?20220629175827802"  xlink:type="simple"/></disp-formula><p>Plate 1. Treated seeds were place in the Petridish with water.</p><disp-formula id="scirp.118236-formula21"><graphic  xlink:href="//html.scirp.org/file/13-2605263x3.png?20220629175827802"  xlink:type="simple"/></disp-formula><p>Plate 2. Soil preparation, filled up with 10 kg sandy loam soil and fertilized.</p></sec><sec id="s2_7"><title>2.7. The Biochemical Parameters Determined</title><p>Plant growth under drought were influenced by altered photosynthesis, respiration, translocation, ion uptake, leaf proline accumulation, soluble sugar (carbohydrates), insoluble sugar (starch), nutrient metabolism, and hormones. In this study, leaf proline accumulation, soluble sugar (carbohydrates), insoluble sugar (starch), proline was determined in the Agricultural Botany laboratory under central laboratory of Sher-e-Bangla Agricultural University.</p><p>1) Leaf proline accumulation</p><p>At the end of the stress, the middle portion of flag leaf was collected for proline estimation following nin-hydrin method [<xref ref-type="bibr" rid="scirp.118236-ref14">14</xref>]. The protocol is based on the formation of red colored form zone by proline with ninhydrin in acidic medium, which is soluble in organic solvents like toluene.</p><p>Instruments, glassware and reagents</p><p>Test-tube, Test-tube stand, micro-pipettes (20 - 200 ml, 100 - 1000 ml and 5 ml), Whatman No. 1 filter paper, visible range spectrophotometer, centrifuge tube, centrifuge machine. Reagents were Glacial acetic acid (Analytical grade), Salfosalycylic acid (3%): Three gram of sulphosalycylic acid was dissolved in 100 ml of distilled water. Orthophoohoric acid (6 N): Required volume of orthophoric acid (38.1) were taken the volume were made to 100 ml, using distilled water to get 6 N orthophoohoric acid. Ninhydrin: Ninhydrin (1.25 g) were dissolved in a blend of 30 ml of glacial acetic acid 20 ml of 6N orthophoric acid.</p><p>Procedure</p><p>1) Plant tissue 0.5 g was homogenized in 5 ml of 3% sulphosalycylic acid using pre washed mortar and pestle.</p><p>2) The homogenate was filtered through Whatman No. 1 filter paper and collect filtrate for the estimation of proline content.</p><p>3) 2 ml of extract were taken in the test tube and add 2 ml of glacial acetic acid and 2 ml of ninhydrin reagent.</p><p>4) Heat reaction mixture in a boiling water bath at 100˚C for 1 hour. Brick red color was developed.</p><p>5) After cooling the reaction mixtures, 4 ml of toluene were added and then transferred to a separating funnel.</p><p>6.) After mixing, the chromospheres containing toluene were separated and absorbance was read at 520 nm in spectrometer against toluene blank.</p><p>7) Standard curve of proline was taking 5 to 100 &#181;g&#183;ml<sup>−1</sup> concentration.</p><p>8) Free proline content was estimated by referring to a standard curve made from known concentrations of proline by taking following formula.</p><p>μmoles proline / g of fresh plant materials = { ( μg proline / ml &#215; ml toluene ) / 115 . 5   μ g / μ moles } / g sample / 5</p><p>Preparation of proline standard curve</p><p>80 mg of pure proline was dissolved into 100 mL of distilled water to get 800 ppm proline stock solution for preparing proline standard curve. By diluting this solution, 50 ppm, 100 ppm, 200 ppm, 400 ppm and 800 ppm solution were prepared in 20 mL each. The absorbance was measured with the help of Spectrophotometer at 520 nm. By plotting the concentration of proline (ppm) in “X” axis and obtained absorbance reading in “Y” axis a standard curve was prepared. From the absorbance reading obtained from samples, their respective proline content was estimated in ppm by using proline standard curve and converted into micro gram per gram (&#181;g/g) unit using the following formula:</p><p>Amount of proline ( μ g / g ) = x 2 &#215; 10 500 &#215; 1000</p><p>2) Estimation of soluble sugar</p><p>Dried composite sample were grounded finely with mortar and pastel. 100 mg finely ground sample place in 15 ml centrifuge tube and 10 ml of 80% ethanol were added. The tubes were covered with aluminum and kept in a boiling water bath 80˚C - 85˚C for 30 minutes. Then the sample were centrifuged at 5000 rpm (by G-13 Centrifuge Machine, Model: NF 200, Turkey) for 10 minutes at room temperature) and decanted in to a 50 ml beaker. These extractions were repeated three or more 3 times. The alcohol extract was evaporated on a boiling water bath 80˚C - 85˚C until most of the alcohol were removed (the volume was reduced to about 3 ml.). The volume was made up to 25 ml with distilled water. 5 ml of this diluted sugar extract were taken in to 100 ml volumetric flask and should be made up the volume with distilled water. 5 ml diluted sugar take into Pyrex test tube which containing standard glucose (0, 0.01, 0.025, 0.05, 0.1, 0.2 and 0.3 mg/5ml) were put into ice bath. 10ml anthron reagents were added slowly in each test tube. Anthron reagents were prepared, 2 g anthrone were dissolved in one-liter concentrated sulfuric acid and stored in a refrigerator and a fresh solution. A Fresh solution was prepared every day. Reagent run down the side of the test tube and stirred slowly with a glass rod. Then the tubes were put in boiling water bath for exactly 7.5 minutes and cool down immediately in ice. Then the absorbance measured at 630 nm and sugar content was estimated using standard curve.</p><p>Calculation:The regression equation obtained from the standard curve is given below: Y = 0.3x – 0.14, Where, Y = absorbance at 630 nm, X = amount of glucose in mg</p><p>The amount of sugar in the extracts was obtained from the regression equation by putting the respective absorbance values of the extracts and taking into consideration the appropriate dilution factor.</p><p>3) Estimation of starch</p><p>The residue left in the centrifuge tube after collecting starch extract were dried in an oven at 80˚C and 2 ml distilled water were added to each centrifuge tube. The tubes were put in boiling water bath for 15 minutes and stirred occasionally. Then the tubes were allowed to cool and 2 ml 9.2 N HClO<sub>4</sub> (perchloric acid) were added to each tube while were stirred occasionally or 15 minutes and made up 10 ml of distilled water. The supernatant was collected and add 2 m 4.6 N HClO<sub>4</sub> were added to the residue and stirred for 15 minute and the solution made up 10 ml distilled water. Then suspension centrifuge and made up 50 with distilled water. 5 ml starch extract were transferred to 50 ml volumetric flask and made up the volume with distilled water. 5 ml diluted extract starch taken into separate 50 ml Pyrex test tubes which contains standard glucose (0.1, 0.25, 0.50, 0.75, 1 and 1.5 mg/5ml including 0.6 ml 0.46 N HCl04 solution for each tube) were put into ice bath and add 10 ml anthron reagent were added slowly, the reagent being allowed to run down the side of the test tubes. The solution was stirred slowly with a glass rod. Then the tubes were put in boiling water bath for exactly 7.5 minutes and cool down immediately in ice. Then the absorbance measured at 630 nm and sugar content was estimated using standard curve.</p><p>Calculation</p><p>The regression equation obtained from the standard curve is given below:</p><p>Y = 0. 165 x + 0.0 15</p><p>where, Y = absorbance at 630 nm.</p><p>X = amount of glucose in mg.</p><p>The amount of starch in the extracts was obtained from the regression equation by putting the respective absorbance values of the extracts and taking into consideration the appropriate dilution factor.</p><disp-formula id="scirp.118236-formula22"><graphic  xlink:href="//html.scirp.org/file/13-2605263x7.png?20220629175827802"  xlink:type="simple"/></disp-formula><p>Calibration curve for the estimation of starch concentration</p><p>Extraction of anthocyanins</p><p>According to [<xref ref-type="bibr" rid="scirp.118236-ref15">15</xref>], anthocyanins were extracted from rice leaves. In the study, total anthocyanins were extracted from rice leaves using methanol and 1% HCL. Just after collection fresh sample were grounded finely with mortar and pastel. After grinding, samples were incubated overnight at room temperature in extraction buffer. 0.5 g finely ground sample place in 15 ml centrifuge tube and 60 ml of methanol were added with 1.6 ml HCL. Homogenates/ extracts were centrifuged at 16,000 g for 15 min and absorption of the extracts was determined at 530 and 657 nm by spectrometer. Then, anthocyanins were quantified according to the formula proposed by [<xref ref-type="bibr" rid="scirp.118236-ref15">15</xref>] as follows: Q<sub>Anthocyanins</sub> = (A<sub>530</sub> – 0.25 &#215; A<sub>657</sub>) &#215; M<sup>−1</sup>; Q<sub>Anthocyanins</sub>: amount of anthocyanins, A<sub>530</sub>: absorption at 530 nm wavelength, A<sub>657</sub>: absorption at 530 nm wavelength, M: fresh weight (g) of the tissues, (60 ml MEOH and 1.6 ML 37% HCL).</p><p>Data analysis</p><p>The data were statistically analyzed following MSTAT-C software package and the mean differences were adjusted by Duncan’s Multiple Range Test (DMRT) at 5% level of significance [<xref ref-type="bibr" rid="scirp.118236-ref16">16</xref>].</p></sec></sec><sec id="s3"><title>3. Results and Discussions</title><p>The results with discussion of the experiments are presented in this chapter.</p><sec id="s3_1"><title>3.1. Proline Accumulation</title><p>Proline content (&#181;g/g) of different rice genotypes under drought condition has been shown (Tables 1-3). Significant difference among the genotypes, the treatments and interaction effect for the character of proline content were found. In this study, in case of varietal affect the highest proline content found was 2.15 (&#181;g/g) in BRRI dhan55 (V<sub>1</sub>) followed by 2.14 (&#181;g/g) in Hashikalmi (V<sub>3</sub>) and the lowest proline content found was 2.13 in BR6976 2B-15. In case of interaction effect the highest proline content found was 2.26 (&#181;g/g) in V<sub>1</sub>T<sub>0</sub> and the lowest proline content found was 1.4 (&#181;g/g) in V<sub>3</sub>T<sub>3</sub> and in V<sub>2</sub>T<sub>6</sub> under drought condition.</p><p>Due to drought condition (Plate 3) higher proline accumulation in BRRI dhan55 (V<sub>1</sub>) and comparatively lowest proline content was in BR6976 2B-15 (V<sub>2</sub>) which was significantly different among the genotypes. This result agrees with the result of [<xref ref-type="bibr" rid="scirp.118236-ref8">8</xref>] that proline accumulation was the first response of plants exposed to water-deficit stress in order to reduce injury to cells. Progressive drought stress induced a considerable accumulation of proline in water stressed maize plants. A similar finding was observed with the results of [<xref ref-type="bibr" rid="scirp.118236-ref17">17</xref>] that tolerant cultivar showed the highest accumulation of proline in bean plants. The highest accumulation of proline due to water stress (Plate 4 and Plate 5) was observed in genotype BB24 (382%) followed by BB43 (368%) and the lowest accumulation was in BB04 (163%). Genotype BARI bushbean-2 exhibited an intermediate behavior in proline accumulation. Accumulation of proline content under water stress indicates accumulated proline might act as a compatible solute regulating and reducing water loss from the plant cell during water deficit [<xref ref-type="bibr" rid="scirp.118236-ref18">18</xref>]. Decreasing of turgor pressure is the first reason for proline accumulation under drought stress condition. One of the physiological responses that plants use against drought is proline accumulation [<xref ref-type="bibr" rid="scirp.118236-ref19">19</xref>]. The proline accumulated in plants under water stress can protects the cell by balancing the osmotic potential of cytosol with that of vacuole and external environment [<xref ref-type="bibr" rid="scirp.118236-ref20">20</xref>]. The level of increase in the proline concentration in response to water stress varied between the rice varieties. Thus, the proline content (Plate 6) is a good indicator for screening drought tolerant varieties in water stress condition [<xref ref-type="bibr" rid="scirp.118236-ref21">21</xref>] and [<xref ref-type="bibr" rid="scirp.118236-ref22">22</xref>].</p><table-wrap id="table1" ><label><xref ref-type="table" rid="table1">Table 1</xref></label><caption><title> Varietal effects of proline, soluble sugar and starch content genotypes under water stress condition</title></caption><table><tbody><thead><tr><th align="center" valign="middle" >Variety</th><th align="center" valign="middle" >Proline(&#181;g/g)</th><th align="center" valign="middle" >Soluble sugar (mg/g)</th><th align="center" valign="middle" >Starch (mg/g)</th></tr></thead><tr><td align="center" valign="middle" >V<sub>1</sub> (BRRI dhan55)</td><td align="center" valign="middle" >2.15 a</td><td align="center" valign="middle" >0.20 a</td><td align="center" valign="middle" >0.057 b</td></tr><tr><td align="center" valign="middle" >V<sub>2</sub> (BR 6976-2B-15)</td><td align="center" valign="middle" >2.16 b</td><td align="center" valign="middle" >0.18 b</td><td align="center" valign="middle" >0.054 b</td></tr><tr><td align="center" valign="middle" >V<sub>3</sub> (Hashikalmi)</td><td align="center" valign="middle" >2.14 ab</td><td align="center" valign="middle" >0.19 ab</td><td align="center" valign="middle" >0.067 a</td></tr><tr><td align="center" valign="middle" >CV (%)</td><td align="center" valign="middle" >0.013</td><td align="center" valign="middle" >0.766</td><td align="center" valign="middle" >0.012</td></tr><tr><td align="center" valign="middle" >LSD <sub>(0.05)</sub></td><td align="center" valign="middle" >0.7327</td><td align="center" valign="middle" >2.081</td><td align="center" valign="middle" >1.972</td></tr></tbody></table></table-wrap><p>Values followed by some letter(s) indicate significantly different from each other by DMRT at 5% level.</p><table-wrap id="table2" ><label><xref ref-type="table" rid="table2">Table 2</xref></label><caption><title> Treatment effects of proline, soluble sugar and starch content genotypes under water stress condition</title></caption><table><tbody><thead><tr><th align="center" valign="middle" >Drought treatment</th><th align="center" valign="middle" >Proline(&#181;g/g)</th><th align="center" valign="middle" >Soluble sugar (mg/g)</th><th align="center" valign="middle" >Starch mg/g</th></tr></thead><tr><td align="center" valign="middle" >T<sub>0</sub> (control)</td><td align="center" valign="middle" >2.13 a</td><td align="center" valign="middle" >0.199 a</td><td align="center" valign="middle" >0.062 ab</td></tr><tr><td align="center" valign="middle" >T<sub>1</sub> (15 to 21 days)</td><td align="center" valign="middle" >1.81 bc</td><td align="center" valign="middle" >0.171 bc</td><td align="center" valign="middle" >0.057 bc</td></tr><tr><td align="center" valign="middle" >T<sub>2</sub> (35 to 41 days)</td><td align="center" valign="middle" >1.91 bc</td><td align="center" valign="middle" >0.198 ab</td><td align="center" valign="middle" >0.058 bc</td></tr><tr><td align="center" valign="middle" >T<sub>3</sub> (55 to 61 days)</td><td align="center" valign="middle" >1.73 c</td><td align="center" valign="middle" >0.168 c</td><td align="center" valign="middle" >0.062 ab</td></tr><tr><td align="center" valign="middle" >T<sub>4</sub> (75 to 81 days)</td><td align="center" valign="middle" >1.81 bc</td><td align="center" valign="middle" >0.190 bc</td><td align="center" valign="middle" >0.054 bc</td></tr><tr><td align="center" valign="middle" >T<sub>5</sub> (95 to 101 days)</td><td align="center" valign="middle" >1.90 bc</td><td align="center" valign="middle" >0.13 c</td><td align="center" valign="middle" >0.060 b</td></tr><tr><td align="center" valign="middle" >T<sub>6</sub> (115 to 121 days)</td><td align="center" valign="middle" >2.00 b</td><td align="center" valign="middle" >0.193 b</td><td align="center" valign="middle" >0.063 ab</td></tr><tr><td align="center" valign="middle" >CV (%)</td><td align="center" valign="middle" >0.671</td><td align="center" valign="middle" >0.766</td><td align="center" valign="middle" >0.012</td></tr></tbody></table></table-wrap><p>Values followed by some letter(s) indicate significantly different from each other by DMRT at 5% level.</p><table-wrap id="table3" ><label><xref ref-type="table" rid="table3">Table 3</xref></label><caption><title> Interaction effect of proline, sugar and starch of three rice genotypes under water stress condition</title></caption><table><tbody><thead><tr><th align="center" valign="middle"  colspan="2"  >Interaction</th><th align="center" valign="middle" >Proline (&#181;g/g)</th><th align="center" valign="middle" >Soluble sugar mg/g</th><th align="center" valign="middle" >Starch mg/g</th></tr></thead><tr><td align="center" valign="middle" >V<sub>1</sub></td><td align="center" valign="middle" >T<sub>0</sub></td><td align="center" valign="middle" >2.26 a</td><td align="center" valign="middle" >0.20 a</td><td align="center" valign="middle" >0.067 a</td></tr><tr><td align="center" valign="middle" >V<sub>1</sub></td><td align="center" valign="middle" >T<sub>1</sub></td><td align="center" valign="middle" >1.57 ghi</td><td align="center" valign="middle" >0.187 a</td><td align="center" valign="middle" >0.056 bc</td></tr><tr><td align="center" valign="middle" >V<sub>1</sub></td><td align="center" valign="middle" >T<sub>1</sub></td><td align="center" valign="middle" >1.77 def</td><td align="center" valign="middle" >0.184 a</td><td align="center" valign="middle" >0.061 ab</td></tr><tr><td align="center" valign="middle" >V<sub>1</sub></td><td align="center" valign="middle" >T<sub>2</sub></td><td align="center" valign="middle" >1.89 cde</td><td align="center" valign="middle" >0.124 b</td><td align="center" valign="middle" >0.060 ab</td></tr><tr><td align="center" valign="middle" >V<sub>1</sub></td><td align="center" valign="middle" >T<sub>3</sub></td><td align="center" valign="middle" >1.80 def</td><td align="center" valign="middle" >0.171 a</td><td align="center" valign="middle" >0.060 abc</td></tr><tr><td align="center" valign="middle" >V<sub>1</sub></td><td align="center" valign="middle" >T<sub>4</sub></td><td align="center" valign="middle" >1.91 cd</td><td align="center" valign="middle" >0.198 a</td><td align="center" valign="middle" >0.063 ab</td></tr><tr><td align="center" valign="middle" >V<sub>1</sub></td><td align="center" valign="middle" >T<sub>5</sub></td><td align="center" valign="middle" >2.00 ab</td><td align="center" valign="middle" >0.168 a</td><td align="center" valign="middle" >0.062 ab</td></tr><tr><td align="center" valign="middle" >V<sub>2</sub></td><td align="center" valign="middle" >T<sub>6</sub></td><td align="center" valign="middle" >2.13 ab</td><td align="center" valign="middle" >0.199 a</td><td align="center" valign="middle" >0.067 a</td></tr><tr><td align="center" valign="middle" >V<sub>2</sub></td><td align="center" valign="middle" >T<sub>0</sub></td><td align="center" valign="middle" >1.59 ghi</td><td align="center" valign="middle" >0.193 a</td><td align="center" valign="middle" >0.057 bc</td></tr><tr><td align="center" valign="middle" >V<sub>2</sub></td><td align="center" valign="middle" >T<sub>1</sub></td><td align="center" valign="middle" >1.73 defg</td><td align="center" valign="middle" >0.200 a</td><td align="center" valign="middle" >0.058 bc</td></tr><tr><td align="center" valign="middle" >V<sub>2</sub></td><td align="center" valign="middle" >T<sub>2</sub></td><td align="center" valign="middle" >1.92 cd</td><td align="center" valign="middle" >0.112 b</td><td align="center" valign="middle" >0.061 abc</td></tr><tr><td align="center" valign="middle" >V<sub>2</sub></td><td align="center" valign="middle" >T<sub>3</sub></td><td align="center" valign="middle" >1.81 cdef</td><td align="center" valign="middle" >0.190 a</td><td align="center" valign="middle" >0.060 abc</td></tr><tr><td align="center" valign="middle" >V<sub>2</sub></td><td align="center" valign="middle" >T<sub>4</sub></td><td align="center" valign="middle" >1.70 efg</td><td align="center" valign="middle" >0.196 a</td><td align="center" valign="middle" >0.060 abc</td></tr><tr><td align="center" valign="middle" >V<sub>2</sub></td><td align="center" valign="middle" >T<sub>5</sub></td><td align="center" valign="middle" >1.40 i</td><td align="center" valign="middle" >0.180 a</td><td align="center" valign="middle" >0.060 abc</td></tr><tr><td align="center" valign="middle" >V<sub>3</sub></td><td align="center" valign="middle" >T<sub>0</sub></td><td align="center" valign="middle" >2.25 a</td><td align="center" valign="middle" >0.200 a</td><td align="center" valign="middle" >0.067 a</td></tr><tr><td align="center" valign="middle" >V<sub>3</sub></td><td align="center" valign="middle" >T<sub>6</sub></td><td align="center" valign="middle" >1.92 cd</td><td align="center" valign="middle" >0.197 a</td><td align="center" valign="middle" >0.053 bc</td></tr><tr><td align="center" valign="middle" >V<sub>3</sub></td><td align="center" valign="middle" >T<sub>1</sub></td><td align="center" valign="middle" >1.70 efg</td><td align="center" valign="middle" >0.193 a</td><td align="center" valign="middle" >0.060 abc</td></tr><tr><td align="center" valign="middle" >V<sub>3</sub></td><td align="center" valign="middle" >T<sub>2</sub></td><td align="center" valign="middle" >1.70 efg</td><td align="center" valign="middle" >0.200 a</td><td align="center" valign="middle" >0.050 bc</td></tr><tr><td align="center" valign="middle" >V<sub>3</sub></td><td align="center" valign="middle" >T<sub>3</sub></td><td align="center" valign="middle" >1.50 hi</td><td align="center" valign="middle" >0.137 a</td><td align="center" valign="middle" >0.600 abc</td></tr><tr><td align="center" valign="middle" >V<sub>3</sub></td><td align="center" valign="middle" >T<sub>4</sub></td><td align="center" valign="middle" >1.63 fgh</td><td align="center" valign="middle" >0.193 a</td><td align="center" valign="middle" >0.060 abc</td></tr><tr><td align="center" valign="middle" >V<sub>3</sub></td><td align="center" valign="middle" >T<sub>5</sub></td><td align="center" valign="middle" >2.20 ab</td><td align="center" valign="middle" >0.200 a</td><td align="center" valign="middle" >0.057 bc</td></tr><tr><td align="center" valign="middle"  colspan="2"  >CV (%)</td><td align="center" valign="middle" >0.671</td><td align="center" valign="middle" >7..66</td><td align="center" valign="middle" >10.16</td></tr></tbody></table></table-wrap><p>Values followed by some letter(s) indicate significantly different from each other by DMRT at 5% level.</p><p><img src="//html.scirp.org/file/13-2605263x9.png?20220629175827802" /><img src="//html.scirp.org/file/13-2605263x8.png?20220629175827802" /></p><p>Plate 3. Different rice genotypes before drought treatment at reproductive stage.</p><p><img src="//html.scirp.org/file/13-2605263x11.png?20220629175827802" /><img src="//html.scirp.org/file/13-2605263x10.png?20220629175827802" /></p><p>Plate 4. Different rice genotypes after water stress treatment at reproductive stage.</p><p><img src="//html.scirp.org/file/13-2605263x13.png?20220629175827802" /><img src="//html.scirp.org/file/13-2605263x12.png?20220629175827802" /></p><p>Plate 5. Effect of water stress of different rice genotypes at reproductive stage.</p><p><img src="//html.scirp.org/file/13-2605263x15.png?20220629175827802" /><img src="//html.scirp.org/file/13-2605263x14.png?20220629175827802" /></p><p>Plate 6. Leaf proline analysis of different rice genotypes under water stress conditions.</p></sec><sec id="s3_2"><title>3.2. Soluble Sugar Content</title><p>Soluble sugar content of leaf of different rice genotypes under drought condition have been shown in the Tables 1-3. Significant difference among the genotypes, the treatments and interaction effect for soluble sugar content were found. In case of varietal effect, the highest sugar content found was 0.20 mg/g in BRRI dhan55 (V<sub>1</sub>) followed by 0.19 mg/g Hashikalmi and the lowest sugar content found was 0.18 mg/g in BR 6976-2B-15 (V<sub>2</sub>). In case of treatment effect, the highest varietal effect of proline, soluble sugar and starch content of three rice sugar content found was 0.199 mg/g in T<sub>0</sub> and the lowest sugar content found was 0.13 mg/g in T<sub>5</sub>. In case of combination effect the highest sugar, content found was 0.200 mg/g in V<sub>2</sub>T<sub>0</sub> and the lowest sugar content found was 0.112 mg/g in V<sub>2</sub>T<sub>2</sub>. Due to water stress conditions, soluble sugar content of leaf of different rice genotypes was found significantly much lower. BRRI dhan55 and tolerant check Hashikalmi which was less affected and the lowest soluble sugar content was found in BR 6976-2B-15 (V<sub>2</sub>). The soluble sugar content was much lower under water stress condition and this might be due to lower RWC, chlorophyll content, stomatal conductance and higher leaf rolling. Similar observations have been reported [<xref ref-type="bibr" rid="scirp.118236-ref15">15</xref>] who showed that under severe drought, growth was inhibited by high concentration of ABA and sugar, whereas low concentrations promote growth. ABA applications enhanced the percentage recovery of drought plants.</p></sec><sec id="s3_3"><title>3.3. Starch Content</title><p>Starch content of different rice genotypes under drought condition have been shown in Tables 1-3. In case of varietal effect, the highest starch content found was 0.067 mg/g in Hasikalmi (V<sub>3</sub>) followed by 0.057 mg/g in BRRI dhan55 (V<sub>1</sub>) and the lowest starch content found was 0.054 mg/g in BR 6976-2B-15 (V<sub>2</sub>) which was significant difference among the genotypes. In case of treatment effect, the highest starch content was 0.063 mg/g in T<sub>6</sub> and the lowest starch content was 0.054 mg/g in T<sub>0</sub> which were significantly different among the treatment. In case of combination effect the highest starch, content found was 0.067 mg/g and the lowest starch content found was 0.053 mg/g which were not significantly different from each other. Due to water stress treatments starch content of different rice genotypes was significantly different among the genotypes. But the reduction was comparatively lower in BR 6976-2B-15 (V<sub>2</sub>) compared to other genotypes. Among the genotypes, in drought plant, the starch content was also found comparatively higher in BRRI dhan55 among the genotypes under water stress conditions, due to limitation of gas diffusion and reduced stomatal conductance, the production of carbohydrate is hampered. So, the rice genotypes that maintained higher carbohydrate before drought, they develop new leaves more quickly and accumulated greater biomass during recovery [<xref ref-type="bibr" rid="scirp.118236-ref23">23</xref>].</p><p>Anthocyanin content of leaf</p><p>Anthocyanin content (Q<sub>Anthocyanins</sub> = (A<sub>530</sub> – 0.25 &#215; A<sub>657</sub>) &#215; M<sup>−1</sup>) of different rice genotypes under drought condition (Plate 7) have been shown in <xref ref-type="fig" rid="fig1">Figure 1</xref>. Here the highest anthocyanin content was found in 0.464 in BRRI dhan55 (V1) followed by 0.402 in Hashikalmi (V<sub>3</sub>) and the lowest found was 0.305 in BR6976-2B-15 (V<sub>2</sub>). Anthocyanin content was increased under water stress condition. The lowest anthocyanin content was 0.0062 which was well water green color leaf.</p><p>In the study, anthocyanin content was increased under water stress condition. Leaf accumulates anthocyanins under drought conditions and the red color increased as the intensity of water deficit increased. Under drought condition BRRI dhan55 (V<sub>1</sub>) produced more anthocyanins followed by Hashikalmi (V<sub>3</sub>) to survive plant against stress conditions. This result has the similarity with the results who stated that anthocyanin were water soluble pigments found in all plant tissues due to stress condition [<xref ref-type="bibr" rid="scirp.118236-ref10">10</xref>]. Anthocyanins usually appear red color in</p><p><img data-original="//html.scirp.org/file/13-2605263x17.png?20220629175827802" /><img data-original="//html.scirp.org/file/13-2605263x16.png?20220629175827802" /></p><p>Plate 7. Leaf anthocyanin analysis of different rice genotypes under water stress conditions.</p><p>leaf cells due to stress condition, but depending on their chemical nature and concentration, the vacuolar pH and interactions with other pigments, they can result in red, pink, purple, blue, orange, brown, and even black leaf colors [<xref ref-type="bibr" rid="scirp.118236-ref24">24</xref>]. Anthocyanins had been located in the root, shoot, and leaves [<xref ref-type="bibr" rid="scirp.118236-ref11">11</xref>] [<xref ref-type="bibr" rid="scirp.118236-ref12">12</xref>]. Anthocyanins had been found in or just below the upper epidermis of leaves published the articles that coloration has assumed red foliage to be the outcome of the production of anthocyanins on plant [<xref ref-type="bibr" rid="scirp.118236-ref25">25</xref>].</p><p>Anthocyanins are polyphenol compounds a group of polyphenolic pigments found in nature, which contribute vivid colors to many fruits and vegetables and act as photo protective light screen, quenching excess photons and, thereby, mitigate photo inhibitory and photo-oxidative damage [<xref ref-type="bibr" rid="scirp.118236-ref26">26</xref>] and [<xref ref-type="bibr" rid="scirp.118236-ref27">27</xref>]. Anthocyanins neutralize reactive oxygen and nitrogen species compounds ascorbic acid and α-tocopherol do [<xref ref-type="bibr" rid="scirp.118236-ref28">28</xref>]. Anthocyanins are synthesized from the flavonoid biosynthetic pathway derived from the general phenylpropanoid pathway. Flavonoids play important roles in plants, such as pigmentation, plant reproduction by recruiting pollinators and seed dispersers and by stress protection. Anthocyanins scavenge free radicals and reducing the oxidative stress. Anthocyanins act as H-atom donator or as single electron transfer. Anthocyanin molecules will change their color depending upon the pH of their environment [<xref ref-type="bibr" rid="scirp.118236-ref29">29</xref>]. Anthocyanins are photo protective agents which shade and protect the photosynthetic apparatus by absorbing excess visible and UV light and scavenging free radicals [<xref ref-type="bibr" rid="scirp.118236-ref30">30</xref>].</p><p>Anthocyanins have a higher antioxidant activity than other flavonoids, due to their positively charged oxygen atom [<xref ref-type="bibr" rid="scirp.118236-ref31">31</xref>]. The antioxidant activity of anthocyanins depends on the degree of hydroxylation at the B-ring as well as the type and extent of acylation and glycosylation [<xref ref-type="bibr" rid="scirp.118236-ref32">32</xref>]. Hydroxylation at the B-ring enhances antioxidant capacity (−OH &gt; −OCH3 ≫ −H), therefore the antioxidant capacity of anthocyanidins decreases in the order of Dp &gt; Pt &gt; Mv = Cy &gt; Pn &gt; Pg [<xref ref-type="bibr" rid="scirp.118236-ref33">33</xref>]. Furthermore, glycosylation reduces the free radical scavenging ability of anthocyanins compared to their aglycone forms, by decreasing their hydrogen-donating, metal-chelating and electron delocalizing abilities [<xref ref-type="bibr" rid="scirp.118236-ref34">34</xref>]. The more sugar units at C<sub>3</sub> and C<sub>5</sub> position, the lower the antioxidant activity is [<xref ref-type="bibr" rid="scirp.118236-ref32">32</xref>]. Finally, acylation of glycosyl moieties may partly circumvent the negative effect of glycosylation [<xref ref-type="bibr" rid="scirp.118236-ref35">35</xref>]. In summary, antioxidant activity increases with the number of hydroxyl groups in the B-ring and decreases with the number of glycosyl groups attached to the A and C ring. The latter effect is less severe when the glycosides are acylated.</p><p>The photo protective role of anthocyanins is seen in juvenile expanding leaves, because anthocyanin accumulation correlates with the development of photo stability [<xref ref-type="bibr" rid="scirp.118236-ref36">36</xref>]. Anthocyanins are thought to act as osmoregulatory under drought stress, because many drought-tolerant plant species contain anthocyanins [<xref ref-type="bibr" rid="scirp.118236-ref37">37</xref>]. In turn, plant tissues containing anthocyanins are usually rather resistant to drought [<xref ref-type="bibr" rid="scirp.118236-ref37">37</xref>]. Consistently, drought stress decreases chlorophyll concentrations [<xref ref-type="bibr" rid="scirp.118236-ref38">38</xref>] and [<xref ref-type="bibr" rid="scirp.118236-ref39">39</xref>]. Furthermore, soluble protein concentrations are reported to decrease under drought stress [<xref ref-type="bibr" rid="scirp.118236-ref38">38</xref>] and [<xref ref-type="bibr" rid="scirp.118236-ref39">39</xref>].</p></sec></sec><sec id="s4"><title>4. Conclusion</title><p>From the above results, the conclusion may be drawn as BRRI dhan55 and Hashikalmi showed better performance in all day’s water stresses. Under water stress conditions, proline was accumulated, and sugar and starch were decreased.</p></sec><sec id="s5"><title>Acknowledgements</title><p>We thank anonymous reviewers for their kind review of the manuscript. This research was supported by Sher-e-Bangla Agricultural University Research System (SAURES) and HEQEP (Higher Education Quality Enhancement Project for providing financial support to conduct the research work.</p></sec><sec id="s6"><title>Authors’ Contributions</title><p>This work was carried out in collaboration among all authors. Author HSJ conducted the research work. KUA designed and supervised the study and edited the manuscript. Author HSJ managed the literature searches and JKB collected genotypes from Genetic Resource and Seed Division, Bangladesh Rice Research Institute. All authors read and approved the final manuscript.</p></sec><sec id="s7"><title>Conflicts of Interest</title><p>The authors declare no conflicts of interest regarding the publication of this paper.</p></sec><sec id="s8"><title>Cite this paper</title><p>Jasmine, H.S., Ahamed, K.U. and Biswas, J.K. (2022) Water Stress Effect on Biochemical Processes of Aus Rice Genotypes. American Journal of Plant Sciences, 13, 912-927. https://doi.org/10.4236/ajps.2022.136060</p></sec></body><back><ref-list><title>References</title><ref id="scirp.118236-ref1"><label>1</label><mixed-citation publication-type="other" xlink:type="simple">Usman, M., Raheem, Z.F., Ahsan, T., Iqbal, A., Sarfaraz, Z.N. and Haq, Z. (2013) Morphological, Physiological and Biochemical Attributes as Indicators for Drought Tolerance in Rice (Oryza sativa L.). European Journal of Biological Sciences, 5, 23-28.</mixed-citation></ref><ref id="scirp.118236-ref2"><label>2</label><mixed-citation publication-type="journal" xlink:type="simple"><name name-style="western"><surname>Lum</surname><given-names> M.S. </given-names></name>,<etal>et al</etal>. (<year>2014</year>)<article-title>Effect of Drought Stress on Growth, Proline and Antioxidant Enzyme Activities of Upland Rice</article-title><source> Journal of Animal and Plant Sciences</source><volume> 24</volume>,<fpage> 1487</fpage>-<lpage>1493</lpage>.<pub-id pub-id-type="doi"></pub-id></mixed-citation></ref><ref id="scirp.118236-ref3"><label>3</label><mixed-citation publication-type="other" xlink:type="simple">IRRI (2005) Annual Report for 2004. International Rice Research Institute, Los Banos.</mixed-citation></ref><ref id="scirp.118236-ref4"><label>4</label><mixed-citation publication-type="other" xlink:type="simple">FAO (2002) Crops and Drops Making the Best Use of Water for Agriculture. Food and Agriculture Organization of the United Nations, Rome.</mixed-citation></ref><ref id="scirp.118236-ref5"><label>5</label><mixed-citation publication-type="other" xlink:type="simple">Jaleel, C.A., Manivannan, P., Murali, P.V., Gomathinayagam, M. and Panneerselvam, R. (2008c) Antioxidant Potential and Indole Alkaloid Profile Variations with Water Deficits along Different Parts of Two Varieties of Catharanthus roseus. Colloids and Surfaces B: Biointerfaces, 62, 312-318.  
https://doi.org/10.1016/j.colsurfb.2007.10.013</mixed-citation></ref><ref id="scirp.118236-ref6"><label>6</label><mixed-citation publication-type="other" xlink:type="simple">Shao, H.B., Chu, L.Y., Shao, M.A., Jaleel, C.A. and Hong-Mei, M. (2008) Higher Plant Antioxidants and Redox Signaling under Environmental Stresses. Comptes Rendus Biologies, 331, 433-441. https://doi.org/10.1016/j.crvi.2008.03.011</mixed-citation></ref><ref id="scirp.118236-ref7"><label>7</label><mixed-citation publication-type="other" xlink:type="simple">Moussa, H.R. and Aziz, S.M.A. (2008) Comparative Response of Drought Tolerant and Drought Sensitive Maize Genotypes to Water Stress. Australian Journal of Crop Science, 1, 31-36.</mixed-citation></ref><ref id="scirp.118236-ref8"><label>8</label><mixed-citation publication-type="other" xlink:type="simple">Anjum, S., Xie, X., Wang, L., Saleem, M., Man, C. and Lei, W. (2011) Morphological, Physiological and Biochemical Responses of Plants to Drought Stress. African Journal of Agricultural Research, 6, 2026-2032.</mixed-citation></ref><ref id="scirp.118236-ref9"><label>9</label><mixed-citation publication-type="other" xlink:type="simple">Peleg, Z. and Blumwald, E. (2011) Hormone Balance and Abiotic Stress Tolerance in Crop Plants. Current Opinion in Plant Biology, 14, 290-295.  
https://doi.org/10.1016/j.pbi.2011.02.001</mixed-citation></ref><ref id="scirp.118236-ref10"><label>10</label><mixed-citation publication-type="other" xlink:type="simple">Scott, L.C. (1999) Invited Review Environmental Significance of Anthocyanins in Plant Stress Responses. Photochemistry and Photobiology, 70, 1-9.  
https://doi.org/10.1111/j.1751-1097.1999.tb01944.x</mixed-citation></ref><ref id="scirp.118236-ref11"><label>11</label><mixed-citation publication-type="other" xlink:type="simple">Krol, M., Gray, G.R., Hurry, V.M., Malek, L. and Huner, N.P.A. (1995) Low Temperature Stress and Photoperiod Affect an Increased Tolerance to Photoinhibition in Pinus bonksiana Seedlings. Canadian Journal of Botany, 73, 1119-1127.  
https://doi.org/10.1139/b95-122</mixed-citation></ref><ref id="scirp.118236-ref12"><label>12</label><mixed-citation publication-type="other" xlink:type="simple">Burger, J. and Edwards, G.E. (1996) Photosynthetic Efficiency and Photodamage by UV and Visible Radiation. In Red versus Green Leaf Coleus Varieties. Plant and Cell Physiology, 37, 395-399. https://doi.org/10.1093/oxfordjournals.pcp.a028959</mixed-citation></ref><ref id="scirp.118236-ref13"><label>13</label><mixed-citation publication-type="other" xlink:type="simple">BRRI (2008) Annual Internal Review for 2007-2008. Bangladesh Rice Research Institute, Gazipur.</mixed-citation></ref><ref id="scirp.118236-ref14"><label>14</label><mixed-citation publication-type="other" xlink:type="simple">Bates, L.S., Waldern, R. and Teare, I.D. (1973) Rapid Determination of Free Proline for Water Stressed Studies. Plant Soil, 39, 205-207.  
https://doi.org/10.1007/BF00018060</mixed-citation></ref><ref id="scirp.118236-ref15"><label>15</label><mixed-citation publication-type="other" xlink:type="simple">Mehrtens, F., Kranz, H., Bednarek, P. and Weisshaar, B. (2005) The Arabidopsis Transcription Factor MYB12 Is a Flavonol-Specific Regulator of Phenylpropanoid Biosynthesis. Plant Physiology, 138, 1083-1096.  
https://doi.org/10.1104/pp.104.058032</mixed-citation></ref><ref id="scirp.118236-ref16"><label>16</label><mixed-citation publication-type="other" xlink:type="simple">Russell, D.F. (1986) MSTAT-C Pakage Programme. Crop and Soil Science Department, Michigan University, Ann Arbor.</mixed-citation></ref><ref id="scirp.118236-ref17"><label>17</label><mixed-citation publication-type="journal" xlink:type="simple"><name name-style="western"><surname>Stoyanov</surname><given-names> Z. </given-names></name>,<etal>et al</etal>. (<year>2005</year>)<article-title>Effects of Water Stress on Leaf Water Relations of Young Bean Plant</article-title><source> Journal of Central European Agriculture</source><volume> 6</volume>,<fpage> 35</fpage>-<lpage>56</lpage>.<pub-id pub-id-type="doi"></pub-id></mixed-citation></ref><ref id="scirp.118236-ref18"><label>18</label><mixed-citation publication-type="other" xlink:type="simple">Yokota, A., Takahara, K. and Akashi, K. (2006) Water Stress Physiology and Molecular Biology of Stress Tolerance in Plants. Springer, Berlin, 15-39.  
https://doi.org/10.1007/1-4020-4225-6_2</mixed-citation></ref><ref id="scirp.118236-ref19"><label>19</label><mixed-citation publication-type="other" xlink:type="simple">Girousse, C., Bournoville, R. and Bonnemain, J.L. (1996) Water Deficit-Induced Changes in Concentrations in Proline and Some Other Amino Acids in the Phoem Sap of Alfalfa. Plant Physiology, 111, 109-119. https://doi.org/10.1104/pp.111.1.109</mixed-citation></ref><ref id="scirp.118236-ref20"><label>20</label><mixed-citation publication-type="other" xlink:type="simple">Pireivatloum, J., Qasimov, N. and Maralian, H. (2010) Effect of Soil Water Stress on Yield and Proline Content of Four Wheat Lines. African Journal of Biotechnology, 9, 36-40.</mixed-citation></ref><ref id="scirp.118236-ref21"><label>21</label><mixed-citation publication-type="other" xlink:type="simple">Bayoumi, T.Y., Manal H.E. and Metwali E.M. (2008) Application of Physiological and Biochemical Indices as a Screening Technique for Drought Tolerance in Wheat Genotypes. African Journal of Biotechnology, 7, 2341-2352.</mixed-citation></ref><ref id="scirp.118236-ref22"><label>22</label><mixed-citation publication-type="other" xlink:type="simple">Rahdari, P. and Hoseini, S.M. (2012) Drought Stress: A Review. International Journal of Agronomy and Plant Production, 3, 443-446.</mixed-citation></ref><ref id="scirp.118236-ref23"><label>23</label><mixed-citation publication-type="other" xlink:type="simple">Singh, S.S., Kumar, S., Dwivedi, S.K., Bhatt, B.P., Mehta, P., Elanchezhian, R., Singh, V.P. and Singh, O.N. (2014) Morpho-Physiological Traits Associated with Reproductive Stage Drought Tolerance of Rice (Oryza sativa L.) Genotypes under Rain-Fed Condition of Eastern Indo-Gangetic Plain. Indian Journal of Plant Physiology, 19, 87-93. https://doi.org/10.1007/s40502-014-0075-x</mixed-citation></ref><ref id="scirp.118236-ref24"><label>24</label><mixed-citation publication-type="book" xlink:type="simple">Anderson, O.M. and Jordheim, M. (2006) The Anthocyanins. In: Anderson, O.M. and Markham, K.R., Eds., Flavonoids: Chemistry, Biochemistry and Applications, CRC Press, Boca Raton, 471-553.</mixed-citation></ref><ref id="scirp.118236-ref25"><label>25</label><mixed-citation publication-type="book" xlink:type="simple">Davies, K.M. (2004) Important Rare Plant Pigments. In: Davies, K.M., Ed., Plant Pigments and Their Manipulation, Annual Plant Reviews, Blackwell, Oxford, 214-247. https://doi.org/10.1002/9781119312994.apr0137</mixed-citation></ref><ref id="scirp.118236-ref26"><label>26</label><mixed-citation publication-type="other" xlink:type="simple">Steyn, W.J., Wand, S.J.E., Holcroft, D.M. and Jacobs, G. (2002) Anthocyanins in Vegetative Tissues: A Proposed Unified Function in Photoprotection. New Phytologist, 155, 349-361. https://doi.org/10.1046/j.1469-8137.2002.00482.x</mixed-citation></ref><ref id="scirp.118236-ref27"><label>27</label><mixed-citation publication-type="other" xlink:type="simple">Merzlyak, M.N., Chivkunova O.B., Solovchenko A.E. and Naqvi, K.R. (2008) Light Absorption by Anthocyanins in Juvenile, Stressed, and Senescing Leaves. Journal of Experimental Botany, 59, 3903-3911. https://doi.org/10.1093/jxb/ern230</mixed-citation></ref><ref id="scirp.118236-ref28"><label>28</label><mixed-citation publication-type="other" xlink:type="simple">Wang, H., Nair, M.G., Strasburg, G.M., Chang, Y.C., Booren, A.M. and Gray, J.I. (1999) Antioxidant and Antiinflammatory Activities of Anthocyanins and Their Aglycon, Cyanidin, from Tart Cherries. Journal of Natural Products, 62, 294-296.  
https://doi.org/10.1021/np980501m</mixed-citation></ref><ref id="scirp.118236-ref29"><label>29</label><mixed-citation publication-type="other" xlink:type="simple">Fossen, T., Cabrita, L. and Andersen, O.M. (1998) Color and Stability of Pure Anthocyanins Influenced by pH including the Alkaline Region. Food Chemistry, 63, 435-440. https://doi.org/10.1016/S0308-8146(98)00065-X</mixed-citation></ref><ref id="scirp.118236-ref30"><label>30</label><mixed-citation publication-type="other" xlink:type="simple">Guo, J., Han, W. and Wang, M.H. (2008) Ultraviolet and Environmental Stresses Involved in the Induction and Regulation of Anthocyanin Biosynthesis: A Review. African Journal of Biotechnology, 7, 4966-4972.  
https://www.ajol.info/index.php/ajb/article/view/59709</mixed-citation></ref><ref id="scirp.118236-ref31"><label>31</label><mixed-citation publication-type="other" xlink:type="simple">Kong, J.M., Chia, L.S., Goh, N.K., Chia, T.F. and Brouillard, R. (2003) Analysis and Biological Activities of Anthocyanins. Phytochemistry, 64, 923-933.  
https://doi.org/10.1016/S0031-9422(03)00438-2</mixed-citation></ref><ref id="scirp.118236-ref32"><label>32</label><mixed-citation publication-type="other" xlink:type="simple">Sadilova, E., Stintzing, F.C. and Carle, R. (2006) Anthocyanins, Colour and Antioxidant Properties of Eggplant (Solanum melongena L.) and Violet Pepper (Capsicum annuum L.) Peel Extracts. Zeitschrift für Naturforschung C, 61, 527-535.  
https://doi.org/10.1515/znc-2006-7-810</mixed-citation></ref><ref id="scirp.118236-ref33"><label>33</label><mixed-citation publication-type="other" xlink:type="simple">Pojer, E., Mattivi, F., Johnson, D. and Stockley, C.S. (2013) The Case for Anthocyanin Consumption to Promote Human Health: A Review. Comprehensive Reviews in Food Science and Food Safety, 12, 483-508.  
https://doi.org/10.1111/1541-4337.12024</mixed-citation></ref><ref id="scirp.118236-ref34"><label>34</label><mixed-citation publication-type="other" xlink:type="simple">Zhao, C.L., Chen, Z.J., Bai, X.S., Ding, C., Long, T.J. and Wei, F.G. (2014) Structure-Activity Relationships of Anthocyanidin Glycosylation. Molecular Diversity, 18, 687-700. https://doi.org/10.1007/s11030-014-9520-z</mixed-citation></ref><ref id="scirp.118236-ref35"><label>35</label><mixed-citation publication-type="other" xlink:type="simple">Lachman, J. and Hamouz, K. (2005) Red and Purple Colored Potatoes as a Significant Antioxidant Source in Human Nutrition—A Review. Plant, Soil and Environment, 51, 477-482. https://doi.org/10.17221/3620-PSE</mixed-citation></ref><ref id="scirp.118236-ref36"><label>36</label><mixed-citation publication-type="other" xlink:type="simple">Drumm-Herrel, H. and Mohr, H. (1985) Photostability of Seedlings Differing in Their Potential to Synthesize Anthocyanin. Physiologia Plantarum, 64, 60-66.  
https://doi.org/10.1111/j.1399-3054.1985.tb01213.x</mixed-citation></ref><ref id="scirp.118236-ref37"><label>37</label><mixed-citation publication-type="other" xlink:type="simple">Chalker-Scott, L. (1999) Environmental Significance of Anthocyanins in Plant Stress Responses. Photochemistry and Photobiology, 70, 1-9.  
https://doi.org/10.1111/j.1751-1097.1999.tb01944.x</mixed-citation></ref><ref id="scirp.118236-ref38"><label>38</label><mixed-citation publication-type="other" xlink:type="simple">Moran, J.F., Becana, M., Iturbe-Ormaetxe, I., Frechilla, S., Klucas, R.V. and Aparicio-Tejo, P. (1994) Drought Induces Oxidative Stress in Pea Plants. Planta, 194, 346-352. https://doi.org/10.1007/BF00197534</mixed-citation></ref><ref id="scirp.118236-ref39"><label>39</label><mixed-citation publication-type="other" xlink:type="simple">Parry, M.A.J., Andralojc, P.J., Khan, S., Lea, P.J. and Keys, A.J. (2002) Rubisco Activity: Effects of Drought Stress. Annals of Botany, 89, 833-839.  
https://doi.org/10.1093/aob/mcf103</mixed-citation></ref></ref-list></back></article>