

Paper Menu >>
Journal Menu >>
 J. Service Science & Management, 2009, 2: 348-352 doi:10.4236/jssm.2009.24041 Published Online December 2009 (www.SciRP.org/journal/jssm) Copyright © 2009 SciRes JSSM The Transmission of Pricing Information of Dually-Listed between Hong Kong and New York Stock Exchange Shuangfei LI, Shou CHEN School of Business Adiministration, Hunan University, Changsha, China Email: [email protected] Received July 31, 2009; revised September 5, 2009; accepted October 29, 2009. ABSTRACT The study investigates the transmission of pricing information between Hong Kong Stock Exchange and New York Stock Exchange. Using the opening and closing stock prices of these two markets from Jan. 2003 to Apr. 2007 with the method of Seemingly Unrelated Regression, we draw the conclusions that: 1) intraday returns of Chinese dually-listed stocks is influenced more obviously by Hang Seng Index than Dow-Jones Average; 2) transmission of pricing informa- tion is only from New York to Hong Kong; 3) intraday returns of stocks from New York Stock Exchange has a remark- able influence on that of the next day in Hongkong market, but the stocks price of Hong Kong Stock Exchange has no relation with which of New York Stock Exchange. Keywords: Information Tra n smi ssi o n, D ually-List ed, St o ck Price 1. Introduction In recent years, there have been quite a number of Chi- nese companies listed in foreign capital markets. Ac- cording to the China Securities Regulatory’s Statistics, up to early 2006, there are a total of 120 Chinese compa- nies listed in foreign capital markets. The market value of China's A-Shares reaches 9 trillion RMB, while the market value of overseas listed enterprises reaches 11 trillion RMB. At the mean time, Along with China's fi- nancial industry is opened to external and to deepen fi- nance reformation, more and more people begin to pay attention to the relationships between Chinese market and overseas securities market. The interdependence of international equity markets has been examined exten- sively. The interdependence of international equity markets has been examined extensively. Using stock market in- dices, Koch and Koch examined relationships between daily closing values of eight national stock indices for the years 1972, 1980 and 1987.Their result suggested that international stock market has grown an more interdep- endent over time, and increased equity market interdep- endence has been concentrated primarily between mark- ets in neighboring countries and between markets whose trading hours overlap [1]. Using multivariate GARCH models, Zhao L. and Wang Y. point out there is anasymmetry in pred ictability of the volatility of A share verses B share. Before the openness to domestic inverstors of B share in Feb. 2001, the volatility of B share and A share are relatively inde- pendent. After that, there is a prominent volatility spill- over effect from A share to B share [2]. However, using the dually-listed stock prices will de- scribe transmission of pricing information better than using the indices [3–4]. Using the daily opening and closing stock prices of seven Japanese corporations that are dually listed on the New York Stock Exchange (NYSE) and the Tokyo Stock Exchange (TSE), Lau and Diltz conclude that market imperfections th at may inhibit information transfer between TSE and NYSE stock re- turns are not readily apparent and that international list- ings do not give rise to arbitrage opportun ities [5]. Bae investigates the transfer of pricing information between the Hong Kong Stock Exchange (HKSE) and the London Stock Exchang e (LSE). They find that HKSE overnight returns respond significantly to changes in LSE intraday returns, but the transmission pro cess is not com- pleted at the opening of the SEHK; LSE overnight re- turns respond significantly to changes in HKSE intraday returns, but the transmission process is not completed at the opening of the LSE, either; the impact is stronger 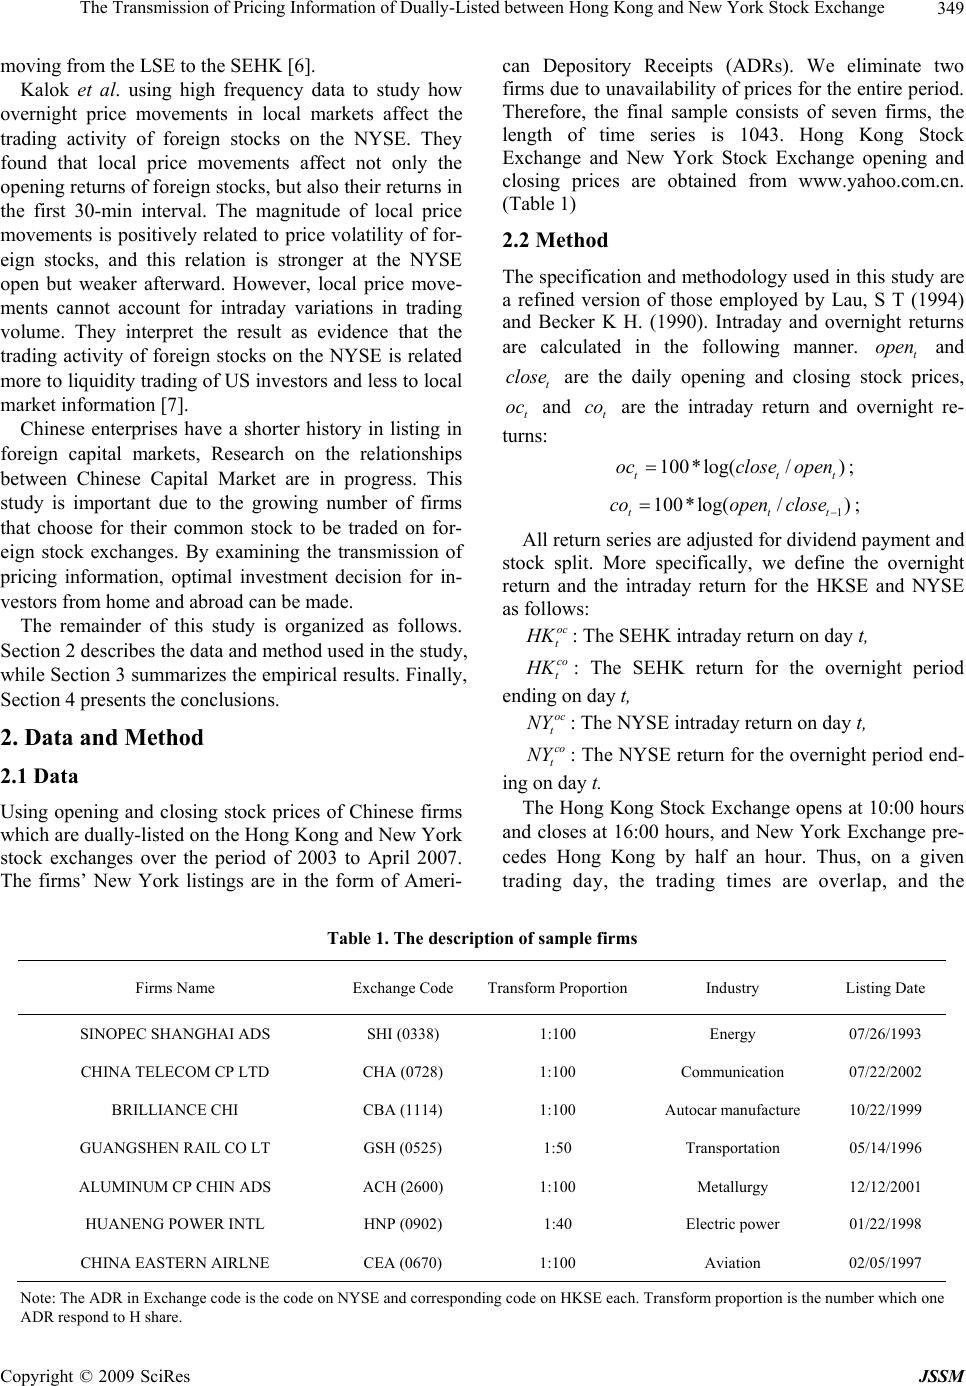 The Transmission of Pricing Information of Dually-Listed between Hong Kong and New York Stock Exchange349 t moving from the LSE to the SEHK [6]. Kalok et al. using high frequency data to study how overnight price movements in local markets affect the trading activity of foreign stocks on the NYSE. They found that local price movements affect not only the opening returns of foreign stocks , but also their returns in the first 30-min interval. The magnitude of local price movements is positively related to price volatility of for- eign stocks, and this relation is stronger at the NYSE open but weaker afterward. However, local price move- ments cannot account for intraday variations in trading volume. They interpret the result as evidence that the trading activity of foreign stocks on the NYSE is related more to liquidity trading of US investors and less to local market information [7]. Chinese enterprises have a shorter history in listing in foreign capital markets, Research on the relationships between Chinese Capital Market are in progress. This study is important due to the growing number of firms that choose for their common stock to be traded on for- eign stock exchanges. By examining the transmission of pricing information, optimal investment decision for in- vestors from home and abroad can be made. The remainder of this study is organized as follows. Section 2 describes the data and method used in the study, while Section 3 summarizes the empirical results. Finally, Section 4 presents the conclus i ons. 2. Data and Method 2.1 Data Using opening and closing stock prices of Chinese firms which are dually-listed on the Hong Kong and New York stock exchanges over the period of 2003 to April 2007. The firms’ New York listings are in the form of Ameri- can Depository Receipts (ADRs). We eliminate two firms due to unavailability of prices for the entire period. Therefore, the final sample consists of seven firms, the length of time series is 1043. Hong Kong Stock Exchange and New York Stock Exchange opening and closing prices are obtained from www.yahoo.com.cn. (Table 1) 2.2 Method The specification and methodology used in this study are a refined version of those employed by Lau, S T (1994) and Becker K H. (1990). Intraday and overnight returns are calculated in the following manner. and are the daily opening and closing stock prices, and are the intraday return and overnight re- turns: t open t close t oc t co 100*log(/ ) tt occlose open ; 1 100*log( /) tt coopenclose t ; All return series are adjusted for dividend payment and stock split. More specifically, we define the overnight return and the intraday return for the HKSE and NYSE as follows: oc t H K: The SEHK intraday return on day t, co t H K: The SEHK return for the overnight period ending on day t, oc t NY : The NYSE intraday return on day t, co t NY : The NYSE return for the overnight period end- ing on day t. The Hong Kong Stock Exchange opens at 10:00 hours and closes at 16:00 hours, and New York Exchange pre- cedes Hong Kong by half an hour. Thus, on a given trading day, the trading times are overlap, and the Table 1. The description of sample firms Firms Name Exchange Code Transform ProportionIndustry Listing Date SINOPEC SHANGHAI ADS SHI (0338) 1:100 Energy 07/26/1993 CHINA TELECOM CP LTD CHA (0728) 1:100 Communication 07/22/2002 BRILLIANCE CHI CBA (1114) 1:100 Autocar manufacture 10/22/1999 GUANGSHEN RAIL CO LT GSH (0525) 1:50 Transportation 05/14/1996 ALUMINUM CP CHIN ADS ACH (2600) 1:100 Metallurgy 12/12/2001 HUANENG POWER INTL HNP (0902) 1:40 Electric power 01/22/1998 CHINA EASTERN AIRLNE CEA (0670) 1:100 Aviation 02/05/1997 Note: The ADR in Exchange code is the code on NYSE and corresponding code on HKSE each. Transform proportion is the number which one ADR respond to H share. Copyright © 2009 SciRes JSSM 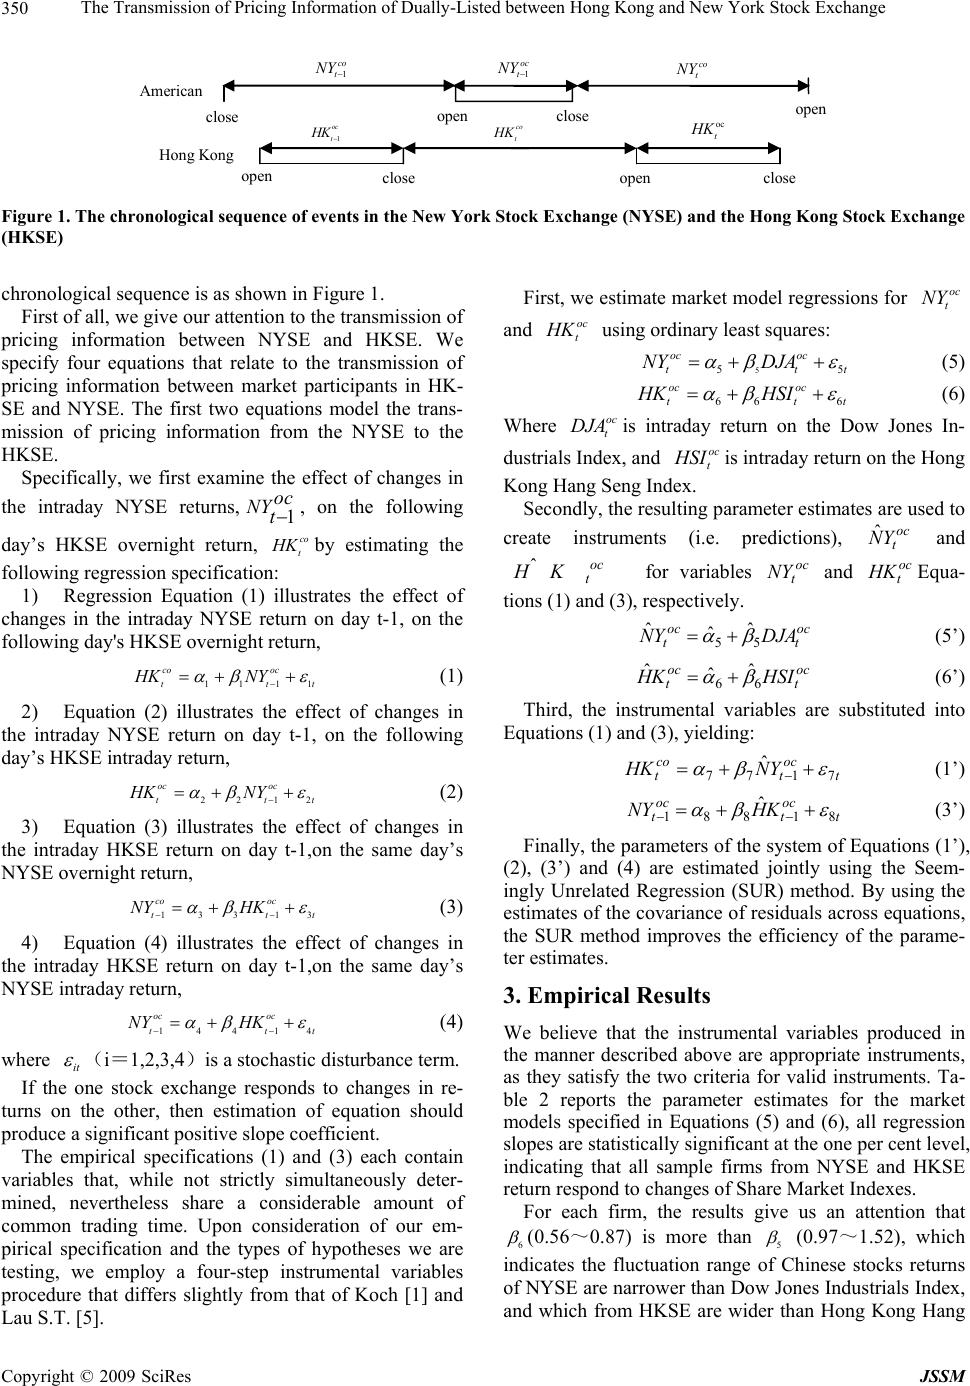 The Transmission of Pricing Information of Dually-Listed between Hong Kong and New York Stock Exchange 350 open Hong Kong oc t H K 1 oc t H K co t H K 1 oc t NY co t NY close 1 co t NY American close open closeopen close open Figure 1. The chronological sequence of events in the New York Stock Exchange (NYSE) and the Hong Kong Stock Exchange (HKSE) chronological sequence is as shown in Figure 1. First of all, we give our attention to the transmission of pricing information between NYSE and HKSE. We specify four equations that relate to the transmission of pricing information between market participants in HK- SE and NYSE. The first two equations model the trans- mission of pricing information from the NYSE to the HKSE. Specifically, we first examine the effect of changes in the intraday NYSE returns,, on the following day’s HKSE overnight return, by estimating the following regression specification: 1 oc NYt co t HK 1) Regression Equation (1) illustrates the effect of changes in the intraday NYSE return on day t-1, on the following day's HKSE overnight return, 11 11 co oc tt HKNY t t (1) 2) Equation (2) illustrates the effect of changes in the intraday NYSE return on day t-1, on the following day’s HKSE intraday return, 2212 oc oc tt HK NY (2) 3) Equation (3) illustrates the effect of changes in the intraday HKSE return on day t-1,on the same day’s NYSE overnig ht ret ur n, 133 13 co oc tt NYHK t (3) 4) Equation (4) illustrates the effect of changes in the intraday HKSE return on day t-1,on the same day’s NYSE intraday return, 144 14 oc oc tt NYHK t (4) where it (i=1,2,3,4)is a stochastic disturbance term. If the one stock exchange responds to changes in re- turns on the other, then estimation of equation should produce a significan t positive slope coefficient. The empirical specifications (1) and (3) each contain variables that, while not strictly simultaneously deter- mined, nevertheless share a considerable amount of common trading time. Upon consideration of our em- pirical specification and the types of hypotheses we are testing, we employ a four-step instrumental variables procedure that differs slightly from that of Koch [1] and Lau S.T. [5]. First, we estimate market model regressions for and oc t NY oc t H K using ordinary least squares: 5 5 oc oc t NYDJA 5tt (5) 66 6 oc oc tt HKHSI t (6) Where is intraday return on the Dow Jones In- dustrials Index, and oc t DJA oc t H SI is intraday return on the Hong Kong Hang Seng Index. Secondly, the resulting parameter estimates are used to create instruments (i.e. predictions), and for variables and Equa- tions (1) and (3), respectively. oc t YN ˆ oc t HK oc t KHˆoc t NY oc t oc tDJAYN 55 ˆ ˆ ˆ (5’) oc t oc tHSIKH 66ˆ ˆ ˆ (6’) Third, the instrumental variables are substituted into Equations (1) and (3), yielding: t oc t co tYNHK 7177 ˆ (1’) t oc t oc tKHNY 81881 ˆ (3’) Finally, the parameters of the system of Equations (1’), (2), (3’) and (4) are estimated jointly using the Seem- ingly Unrelated Regression (SUR) method. By using the estimates of the covariance of residuals across equations, the SUR method improves the efficiency of the parame- ter estimates. 3. Empirical Results We believe that the instrumental variables produced in the manner described above are appropriate instruments, as they satisfy the two criteria for valid instruments. Ta- ble 2 reports the parameter estimates for the market models specified in Equations (5) and (6), all regression slopes are statistically significant at the one per cent level, indicating that all sample firms from NYSE and HKSE return respond to changes of Share Market Indexes. For each firm, the results give us an attention that 6 (0.56~0.87) is more than 5 (0.97~1.52), which indicates the fluctuation range of Chinese stocks returns of NYSE are narrower than Dow Jones Industrials Index, and which from HKSE are wider than Hong Kong Hang Copyright © 2009 SciRes JSSM 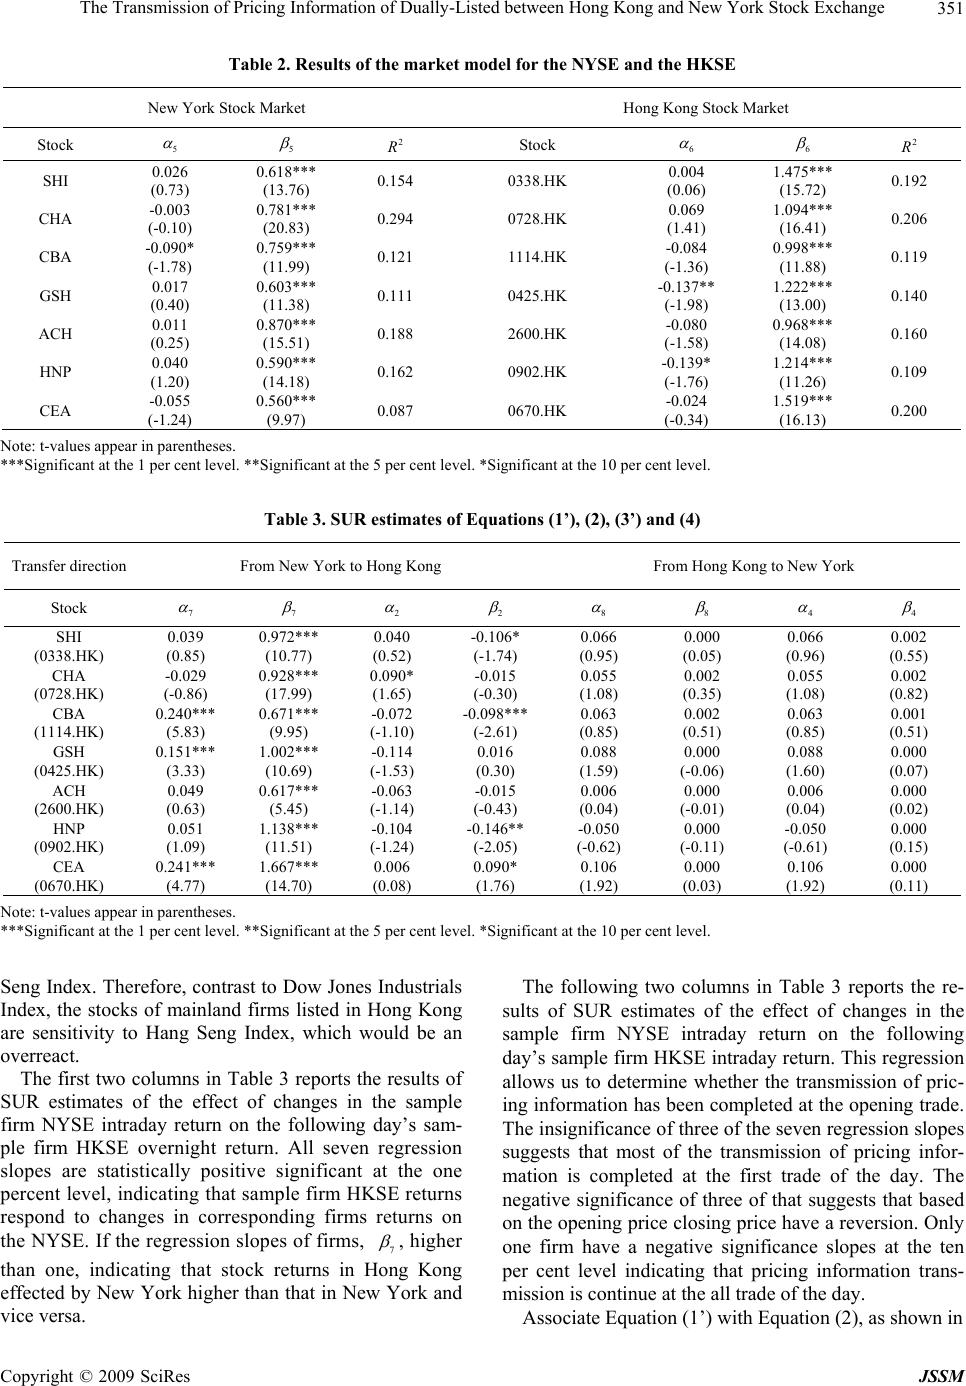 The Transmission of Pricing Information of Dually-Listed between Hong Kong and New York Stock Exchange351 Table 2. Results of the market model for the NYSE and the HKSE New York Stock Market Hong Kong Stock Market Stock 5 5 2 R Stock 6 6 2 R SHI 0.026 (0.73) 0.618*** (13.76) 0.154 0338.HK 0.004 (0.06) 1.475*** (15.72) 0.192 CHA -0.003 (-0.10) 0.781*** (20.83) 0.294 0728.HK 0.069 (1.41) 1.094*** (16.41) 0.206 CBA -0.090* (-1.78) 0.759*** (11.99) 0.121 1114.HK -0.084 (-1.36) 0.998*** (11.88) 0.119 GSH 0.017 (0.40) 0.603*** (11.38) 0.111 0425.HK -0.137** (-1.98) 1.222*** (13.00) 0.140 ACH 0.011 (0.25) 0.870*** (15.51) 0.188 2600.HK -0.080 (-1.58) 0.968*** (14.08) 0.160 HNP 0.040 (1.20) 0.590*** (14.18) 0.162 0902.HK -0.139* (-1.76) 1.214*** (11.26) 0.109 CEA -0.055 (-1.24) 0.560*** (9.97) 0.087 0670.HK -0.024 (-0.34) 1.519*** (16.13) 0.200 Note: t-values appear in parentheses. ***Significant at the 1 per cent level. **Significant at th e 5 pe r cent level. *Significant at the 10 per cent level. Table 3. SUR estimates of Equations (1’), (2), (3’) and (4) Transfer direction From New York to Hong Kong From Hong Kong to New York Stock 7 7 2 2 8 8 4 4 SHI (0338.HK) 0.039 (0.85) 0.972*** (10.77) 0.040 (0.52) -0.106* (-1.74) 0.066 (0.95) 0.000 (0.05) 0.066 (0.96) 0.002 (0.55) CHA (0728.HK) -0.029 (-0.86) 0.928*** (17.99) 0.090* (1.65) -0.015 (-0.30) 0.055 (1.08) 0.002 (0.35) 0.055 (1.08) 0.002 (0.82) CBA (1114.HK) 0.240*** (5.83) 0.671*** (9.95) -0.072 (-1.10) -0.098*** (-2.61) 0.063 (0.85) 0.002 (0.51) 0.063 (0.85) 0.001 (0.51) GSH (0425.HK) 0.151*** (3.33) 1.002*** (10.69) -0.114 (-1.53) 0.016 (0.30) 0.088 (1.59) 0.000 (-0.06) 0.088 (1.60) 0.000 (0.07) ACH (2600.HK) 0.049 (0.63) 0.617*** (5.45) -0.063 (-1.14) -0.015 (-0.43) 0.006 (0.04) 0.000 (-0.01) 0.006 (0.04) 0.000 (0.02) HNP (0902.HK) 0.051 (1.09) 1.138*** (11.51) -0.104 (-1.24) -0.146** (-2.05) -0.050 (-0.62) 0.000 (-0.11) -0.050 (-0.61) 0.000 (0.15) CEA (0670.HK) 0.241*** (4.77) 1.667*** (14.70) 0.006 (0.08) 0.090* (1.76) 0.106 (1.92) 0.000 (0.03) 0.106 (1.92) 0.000 (0.11) Note: t-values appear in parentheses. ***Significant at the 1 per cent level. **Significant at th e 5 pe r cent level. *Significant at the 10 per cent level. Seng Index. Ther efore, contrast to Dow Jones Industr ials Index, the stocks of mainland firms listed in Hong Kong are sensitivity to Hang Seng Index, which would be an overreact. The first two columns in Table 3 reports the results of SUR estimates of the effect of changes in the sample firm NYSE intraday return on the following day’s sam- ple firm HKSE overnight return. All seven regression slopes are statistically positive significant at the one percen t level, indi cating that sa mple firm HKSE retu rns respond to changes in corresponding firms returns on the NYSE. If the regression slopes of firms, 7 , higher than one, indicating that stock returns in Hong Kong effected by New York higher than that in New York and vice versa. The following two columns in Table 3 reports the re- sults of SUR estimates of the effect of changes in the sample firm NYSE intraday return on the following day’s sample firm HKSE intraday return. This regression allows us to determine whether the transmission of pric- ing information has been completed at the opening trade. The insignificance of three of the seven regression slopes suggests that most of the transmission of pricing infor- mation is completed at the first trade of the day. The negative significance of three of that suggests that based on the opening price closing price have a reversion. Only one firm have a negative significance slopes at the ten per cent level indicating that pricing information trans- mission is continue at the all trade of the day. Associate Equation (1’) w ith Equation (2), as shown in Copyright © 2009 SciRes JSSM  The Transmission of Pricing Information of Dually-Listed between Hong Kong and New York Stock Exchange 352 Table 3 is the transmission of pricing information from New York to Hong Kong. 7 are higher than 2 and so are the corresponding t-statistics, which suggests that the transmission from New York to Hong Kong is com- pleted at the first trade of the day. The regression slopes in Equations (3’) and (4) are insignificant, which suggests that the transmission of pricing information from Hong Kong to New York is unconspicuous. This result disagrees with Lau [5] and Bae [6]. 4. Conclusions This study examines th e transmission of pricing info rma- tion between market participants in the HKSE and the NYSE. Using the opening and closing stock prices of seven Chinese firms that are inter-listed on the Hong Kong and the New York stock exchanges over the period of 2003 to April 2007, four regression specifications re- lating to the transmission of pricing information are ex- amined. The findings of this study suggest that: 1) Con- trast to Dow Jones Industrials Index, the stocks of mainland firms listed in Hong Kong are sensitivity to Hang Seng Index. 2) Sample firm HK SE opening returns respond to changes in sample firm NYSE intraday stock performance; the transmission process is apparently completed at the open ing of the HKSE; 3) The transmis- sion of pricing information from Hong Kong to New York are unconspicuous. REFERENCES [1] P. D. Koch and W. Koch, “Evolution in dynamic linkages across Daily National Stock Indexes,” Journal of Interna- tional Money and Finance, Vol. 10, No. 2, pp. 231–251, 1991. [2] L. Y. Zhao and Y. M. Wang, “Information flows and volatility spillover across A share and B share market in China,” Journal of Finance, Vol. 10, pp. 37–52 (in Chi- nese), 2003. [3] D. Long, J. Payne, and C. Feng, “Information transmis- sion in the Shanghai equity market,” Journal of Financial Research, Vol. 22, pp. 29–45, 1999. [4] C. S. Eun and S. Sabherwal, “Cross-border listings and price discovery: Evidence from US-listed Canadian stocks,” Journal of Finance, Vol. 58, No. 2, pp. 549–575, 2003. [5] S. T. Lau and J. D. Diltz, “Stock returns and the transfer of information between the New York and Tokyo Stock Exchanges,” Journal of International Money and Finance, Vol. 13, No. 2, pp. 211–222, 1994. [6] K. H. Bae, B. Cha, and Y. L. Cheung, “The transmission of pricing information of dually-listed stocks,” Journal of Business Finance and Accounting, Vol. 26, pp. 709–723, 1999. [7] K. Chan, M. Chockalingam, and W. L. Kent, “Overnight information and intraday trading behavior: evidence from NYSE cross-listed stocks and their local market informa- tion,” Journal of Multinational Financial Management, Vol. 10, pp. 495–509, 2000. Copyright © 2009 SciRes JSSM |