

Paper Menu >>
Journal Menu >>
 Journal of Environmental Protection, 2011, 2, 1364-1369 doi:10.4236/jep.2011.210158 Published Online December 2011 (http://www.SciRP.org/journal/jep) Copyright © 2011 SciRes. JEP Environmental Burden of Charcoal Production and Use in Dar es Salaam, Tanzania Neema Msuya, Enock Masanja, Abrahamu Kimang ano Temu Department of Chemical and Mining, University of Dar es Salaam, Dar es Salaam, Tanzania. E-mail: [email protected] Received August 15th, 2011; revised October 19th, 2011; accepted November 22nd, 2011. ABSTRACT Tanzanian forests are excessively threatened by increased charcoal production fuelled by increased demand crucially in Dar es Salaam city which consumes nearly 70% of all the charcoal produced in the country. Through use of eco- logical modeling software STELLA® the environmental burden of charcoal production and use in Tanzania has been established. The study has revealed that the country losses 150,433 ha of forest per year. Due to increase in popula tion by year 2030 almost 2.8 million ha of forests will ha ve been lost. This is eq uivalent to 8.5% of the total forest cover th e country had in 2009. The environmental burden includes air pollution characterized by a total emission of 49, 1.0, and 9.0, 12 million tonnes of CO2, SO2, NOx, and CH4, respectively by 2030. Other adverse impacts include loss of forest cover which ultimately causes degradation of soil quality by increased soil erosion, degradation of water sources and disruption of rainfall pattern including inducing draught. Taking into account that the agriculture in Tanzania is pri- marily rain fed, this has an adverse impact in agricultural production. In the current exploitation of this important natural resource, its sustainability is severely challenged and the whole concept of the forest being renewable is put into que stion. From these finding s, it is recommended that concrete and deliberate efforts are made to reduce and even- tually prohibit the use of charcoal in cities and towns. Keywords: Charcoal Production, Environmental Burden, Forest Loss, Ecological Model 1. Introduction Households in Tanzania generally use a combination of energy sources for cooking that can be categorized as tra- ditional (agricultural residues and fuel wood), interme- diate (charcoal and kerosene) or modern (Liquefied Pe- troleum Gas (LPG), biogas and electricity). Electricity is mainly used for lighting and small appliances like radio, Televisions and phone charging rather than cooking, and represents a small share of total household consumption in energy terms [1]. Over one million tonnes of charcoal is used for cooking annually in Tanzania’s urban areas which is equivalent to 109,500 ha of forest loss [2]. In- creasing tendency to use charcoal instead of electricity or LPG is driven by availability of charcoal and its pre- sumed low price. The increased consumption of char- coal results in increased forest cover loss. Among the impacts of the forest loss is degradation of water sources, reduction in soil quality and hence decreases in agricul- tural productivity, damaged habitat, diminishing biodi- versity, and reduced sequestration of carbon dioxide by trees. The government tried to institute a ban of charcoal production in 2006 but was largely unsuccessful [3] be- cause no alternative source of fuel was provided. Different designs of fuel-efficient charcoal stoves that reduce charcoal consumption have been introduced and promoted. These stoves while last longer, are not neces- sarily user friendly, and are more expensive than the con- ventional ones. Consequently, their introduction has not changed the rate of consumption of charcoal. Tanzania experienced a loss of forest cover of more than 10.5 mi- llion ha between 1961 and 1998; this represents an an- nual loss of 0.73% of forest cover [4]. Charcoal and fire- wood use alone results in more than 70% of the forest loss [5], while more than 40% of the forest loss can be attributed to charcoal use alone [6]. There has been de- liberate intervention to redress deforestation by planting trees. Annual tree plantation in the average has been 25,000 ha with a survival of less than 10% i.e. 2500 ha, which is approximately 2.3% of the annual forest cover lost. At this rate of loss the concept of forest being a re- newable energy resource is threatened. Charcoal consumption results into about 9 million ton- 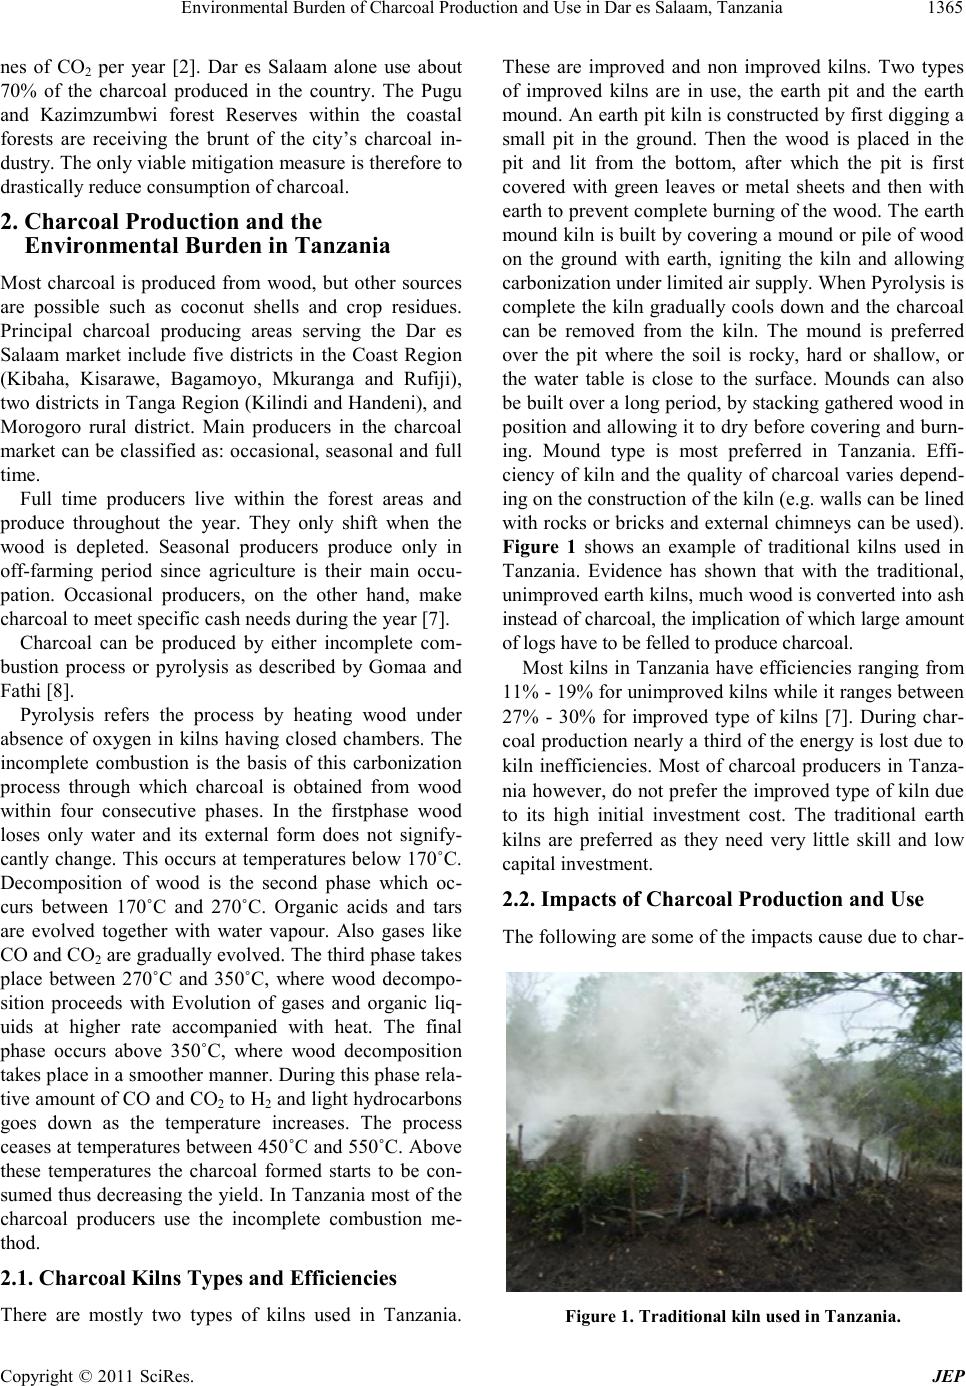 Environmental Burden of Charcoal Production and Use in Dar es Salaam, Tanzania1365 nes of CO2 per year [2]. Dar es Salaam alone use about 70% of the charcoal produced in the country. The Pugu and Kazimzumbwi forest Reserves within the coastal forests are receiving the brunt of the city’s charcoal in- dustry. The only viable mitigation measure is therefore to drastically reduce consumption of charcoal. 2. Charcoal Production and the Environmental Burden in Tanzania Most charcoal is produced from wood, but other sources are possible such as coconut shells and crop residues. Principal charcoal producing areas serving the Dar es Salaam market include five districts in the Coast Region (Kibaha, Kisarawe, Bagamoyo, Mkuranga and Rufiji), two districts in Tanga Region (Kilindi and Handeni), and Morogoro rural district. Main producers in the charcoal market can be classified as: occasional, seasonal and full time. Full time producers live within the forest areas and produce throughout the year. They only shift when the wood is depleted. Seasonal producers produce only in off-farming period since agriculture is their main occu- pation. Occasional producers, on the other hand, make charcoal to meet specific cash needs during the year [7]. Charcoal can be produced by either incomplete com- bustion process or pyrolysis as described by Gomaa and Fathi [8]. Pyrolysis refers the process by heating wood under absence of oxygen in kilns having closed chambers. The incomplete combustion is the basis of this carbonization process through which charcoal is obtained from wood within four consecutive phases. In the firstphase wood loses only water and its external form does not signify- cantly change. This occurs at temperatures below 170˚C. Decomposition of wood is the second phase which oc- curs between 170˚C and 270˚C. Organic acids and tars are evolved together with water vapour. Also gases like CO and CO2 are gradually evolved. The third phase takes place between 270˚C and 350˚C, where wood decompo- sition proceeds with Evolution of gases and organic liq- uids at higher rate accompanied with heat. The final phase occurs above 350˚C, where wood decomposition takes place in a smoother manner. During this phase rela- tive amount of CO and CO2 to H2 and light hydrocarbons goes down as the temperature increases. The process ceases at temperatures between 450˚C and 550˚C. Above these temperatures the charcoal formed starts to be con- sumed thus decreasing the yield. In Tanzania most of the charcoal producers use the incomplete combustion me- thod. 2.1. Charcoal Kilns Types and Efficiencies There are mostly two types of kilns used in Tanzania. These are improved and non improved kilns. Two types of improved kilns are in use, the earth pit and the earth mound. An earth pit kiln is constructed by first digging a small pit in the ground. Then the wood is placed in the pit and lit from the bottom, after which the pit is first covered with green leaves or metal sheets and then with earth to prevent complete burning of the wood. The earth mound kiln is built by covering a mound or pile of wood on the ground with earth, igniting the kiln and allowing carbonization under limited air supply. When Pyrolysis is complete the kiln gradually cools down and the charcoal can be removed from the kiln. The mound is preferred over the pit where the soil is rocky, hard or shallow, or the water table is close to the surface. Mounds can also be built over a long period, by stacking gathered wood in position and allowing it to dry before covering and burn- ing. Mound type is most preferred in Tanzania. Effi- ciency of kiln and the quality of charcoal varies depend- ing on the construction of the kiln (e.g. walls can be lined with rocks or bricks and external chimneys can be used). Figure 1 shows an example of traditional kilns used in Tanzania. Evidence has shown that with the traditional, unimproved earth kilns, much wood is converted into ash instead of charcoal, the implication of which large amount of logs have to be felled to produce charcoal. Most kilns in Tanzania have efficiencies ranging from 11% - 19% for unimproved kilns while it ranges between 27% - 30% for improved type of kilns [7]. During char- coal production nearly a third of the energy is lost due to kiln inefficiencies. Most of charcoal producers in Tanza- nia however, do not prefer the improved type of kiln due to its high initial investment cost. The traditional earth kilns are preferred as they need very little skill and low capital investment. 2.2. Impacts of Charcoal Production and Use The following are some of the impacts cause due to char- Figure 1. Traditional kiln used in Tanzania. Copyright © 2011 SciRes. JEP 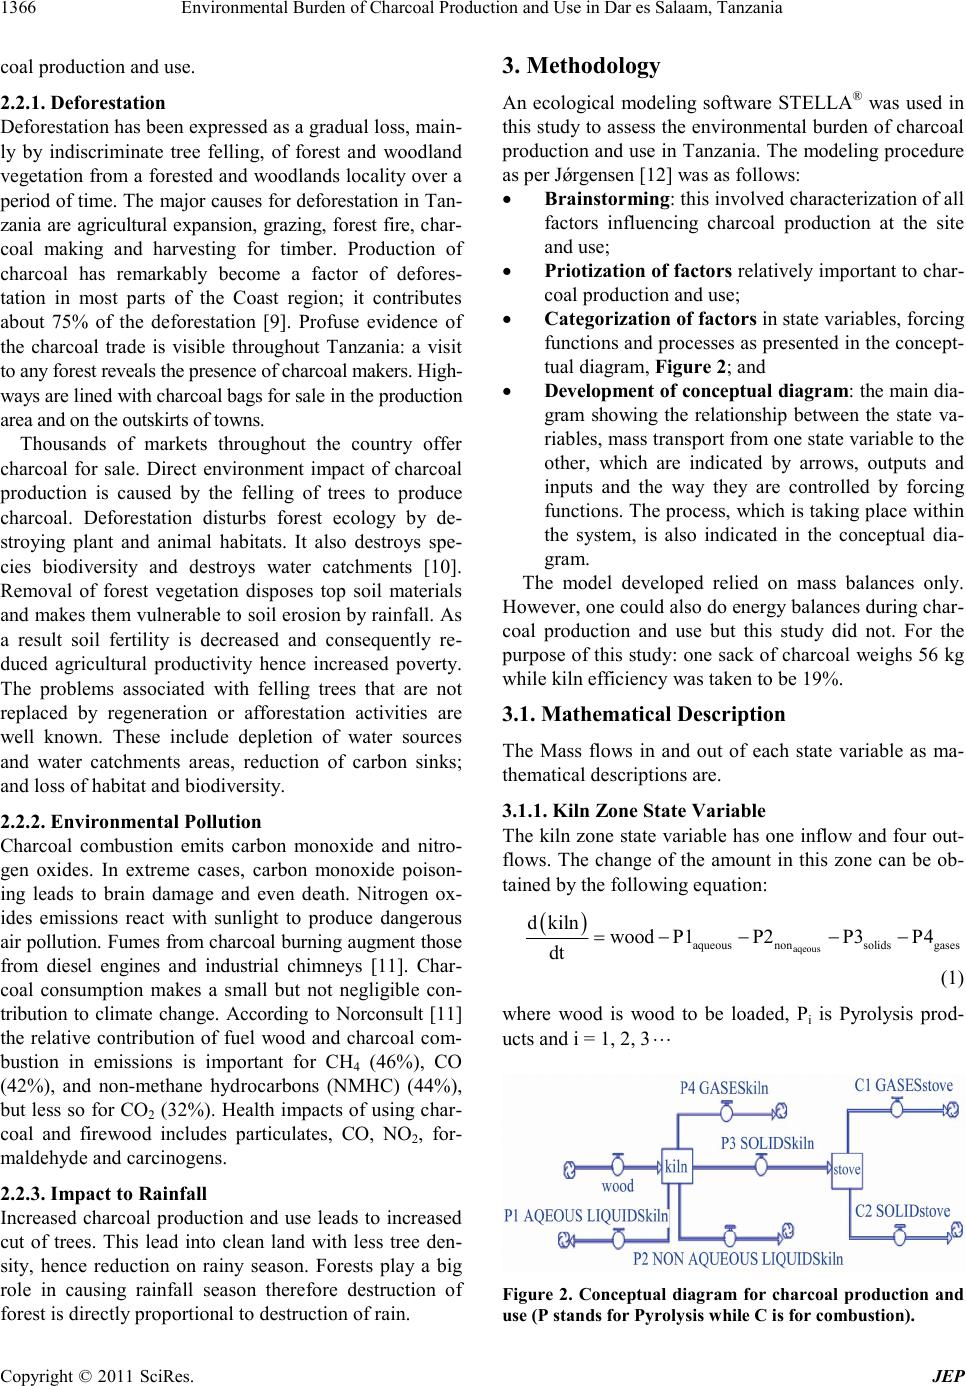 Environmental Burden of Charcoal Production and Use in Dar es Salaam, Tanzania 1366 coal production and use. 2.2.1. Deforestation Deforestation has been expressed as a gradual loss, main- ly by indiscriminate tree felling, of forest and woodland vegetation from a forested and woodlands locality over a period of time. The major causes for deforestation in Tan- zania are agricultural expansion, grazing, forest fire, char- coal making and harvesting for timber. Production of charcoal has remarkably become a factor of defores- tation in most parts of the Coast region; it contributes about 75% of the deforestation [9]. Profuse evidence of the charcoal trade is visible throughout Tanzania: a visit to any forest reveals the presence of charcoal makers. High- ways are lined with charcoal bags for sale in the production area and on the outskirts of towns. Thousands of markets throughout the country offer charcoal for sale. Direct environment impact of charcoal production is caused by the felling of trees to produce charcoal. Deforestation disturbs forest ecology by de- stroying plant and animal habitats. It also destroys spe- cies biodiversity and destroys water catchments [10]. Removal of forest vegetation disposes top soil materials and makes them vulnerable to soil erosion by rainfall. As a result soil fertility is decreased and consequently re- duced agricultural productivity hence increased poverty. The problems associated with felling trees that are not replaced by regeneration or afforestation activities are well known. These include depletion of water sources and water catchments areas, reduction of carbon sinks; and loss of habitat and biodiversity. 2.2.2. Environmental Pollution Charcoal combustion emits carbon monoxide and nitro- gen oxides. In extreme cases, carbon monoxide poison- ing leads to brain damage and even death. Nitrogen ox- ides emissions react with sunlight to produce dangerous air pollution. Fumes from charcoal burning augment those from diesel engines and industrial chimneys [11]. Char- coal consumption makes a small but not negligible con- tribution to climate change. According to Norconsult [11] the relative contribution of fuel wood and charcoal com- bustion in emissions is important for CH4 (46%), CO (42%), and non-methane hydrocarbons (NMHC) (44%), but less so for CO2 (32%). Health impacts of using char- coal and firewood includes particulates, CO, NO2, for- maldehyde and carcinogens. 2.2.3. Impact to Rainfall Increased charcoal production and use leads to increased cut of trees. This lead into clean land with less tree den- sity, hence reduction on rainy season. Forests play a big role in causing rainfall season therefore destruction of forest is directly proportional to destruction of rain. 3. Methodology An ecological modeling software STELLA® was used in this study to assess the environmental burden of charcoal production and use in Tanzania. The modeling procedure as per Jǿrgensen [12] was as follows: Brainstorming: this involved characterization of all factors influencing charcoal production at the site and use; Priotization of factors relatively important to char- coal production and use; Categorization of factors in state variables, forcing functions and processes as presented in the concept- tual diagram, Figure 2; and Development of conceptual diagram: the main dia- gram showing the relationship between the state va- riables, mass transport from one state variable to the other, which are indicated by arrows, outputs and inputs and the way they are controlled by forcing functions. The process, which is taking place within the system, is also indicated in the conceptual dia- gram. The model developed relied on mass balances only. However, one could also do energy balances during char- coal production and use but this study did not. For the purpose of this study: one sack of charcoal weighs 56 kg while kiln efficiency was taken to be 19%. 3.1. Mathematical Description The Mass flows in and out of each state variable as ma- thematical descriptions are. 3.1.1. Kiln Zone State Variable The kiln zone state variable has one inflow and four out- flows. The change of the amount in this zone can be ob- tained by the following equation: aqeous aqueous nonsolids gases dkiln wood P1P2P3P4 dt (1) where wood is wood to be loaded, Pi is Pyrolysis prod- ucts and i = 1, 2, 3 Figure 2. Conceptual diagram for charcoal production and use (P stands for Pyrolysis while C is for combustion). Copyright © 2011 SciRes. JEP 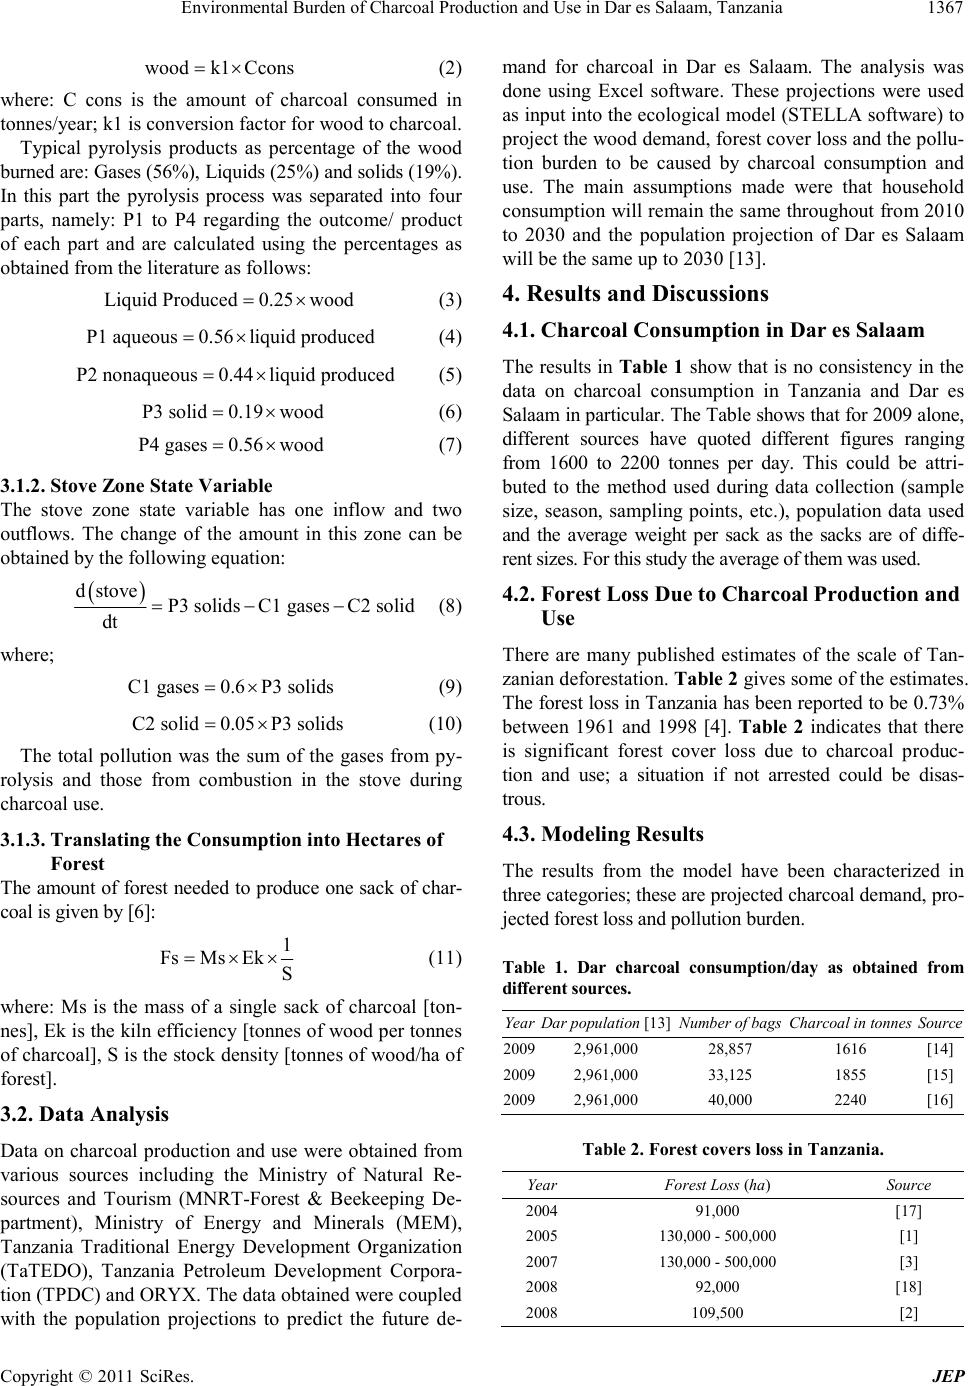 Environmental Burden of Charcoal Production and Use in Dar es Salaam, Tanzania1367 woodk1 Ccons (2) where: C cons is the amount of charcoal consumed in tonnes/year; k1 is conversion factor for wood to charcoal. Typical pyrolysis products as percentage of the wood burned are: Gases (56%), Liquids (25%) and solids (19%). In this part the pyrolysis process was separated into four parts, namely: P1 to P4 regarding the outcome/ product of each part and are calculated using the percentages as obtained from the literature as follows: Liquid Produced0.25wood (3) P1 aqueous0.56liquid produced (4) P2 nonaqueous0.44liquid produced (5) P3 solid0.19wood (6) P4 gases0.56wood (7) 3.1.2. Stove Zone State Variable The stove zone state variable has one inflow and two outflows. The change of the amount in this zone can be obtained by the following equation: dstove P3 solidsC1 gasesC2 solid dt (8) where; C1 gases0.6P3 solids (9) C2 solid0.05P3 solids (10) The total pollution was the sum of the gases from py- rolysis and those from combustion in the stove during charcoal use. 3.1.3. Translating the Consumption into Hectares of Forest The amount of forest needed to produce one sack of char- coal is given by [6]: 1 FsMs EkS (11) where: Ms is the mass of a single sack of charcoal [ton- nes], Ek is the kiln efficiency [tonnes of wood per tonnes of charcoal], S is the stock density [tonnes of wood/ha of forest]. 3.2. Data Analysis Data on charcoal production and use were obtained from various sources including the Ministry of Natural Re- sources and Tourism (MNRT-Forest & Beekeeping De- partment), Ministry of Energy and Minerals (MEM), Tanzania Traditional Energy Development Organization (TaTEDO), Tanzania Petroleum Development Corpora- tion (TPDC) and ORYX. The data obtained were coupled with the population projections to predict the future de- mand for charcoal in Dar es Salaam. The analysis was done using Excel software. These projections were used as input into the ecological model (STELLA software) to project the wood demand, forest cover loss and the pollu- tion burden to be caused by charcoal consumption and use. The main assumptions made were that household consumption will remain the same throughout from 2010 to 2030 and the population projection of Dar es Salaam will be the same up to 2030 [13]. 4. Results and Discussions 4.1. Charcoal Consumption in Dar es Salaam The results in Table 1 show that is no consistency in the data on charcoal consumption in Tanzania and Dar es Salaam in particular. The Table shows that for 2009 alone, different sources have quoted different figures ranging from 1600 to 2200 tonnes per day. This could be attri- buted to the method used during data collection (sample size, season, sampling points, etc.), population data used and the average weight per sack as the sacks are of diffe- rent sizes. For this study the average of them was used. 4.2. Forest Loss Due to Charcoal Production and Use There are many published estimates of the scale of Tan- zanian deforestation. Table 2 gives some of the estimates. The forest loss in Tanzania has been reported to be 0.73% between 1961 and 1998 [4]. Table 2 indicates that there is significant forest cover loss due to charcoal produc- tion and use; a situation if not arrested could be disas- trous. 4.3. Modeling Results The results from the model have been characterized in three categories; these are projected charcoal demand, pro- jected forest loss and pollution burden. Table 1. Dar charcoal consumption/day as obtained from different sources. YearDar population [13] Number of bags Charcoal i n tonnesSource 20092,961,000 28,857 1616 [14] 20092,961,000 33,125 1855 [15] 20092,961,000 40,000 2240 [16] Table 2. Forest cov ers loss in Tan zania. Year Forest Loss (ha) Source 2004 91,000 [17] 2005 130,000 - 500,000 [1] 2007 130,000 - 500,000 [3] 2008 92,000 [18] 2008 109,500 [2] Copyright © 2011 SciRes. JEP 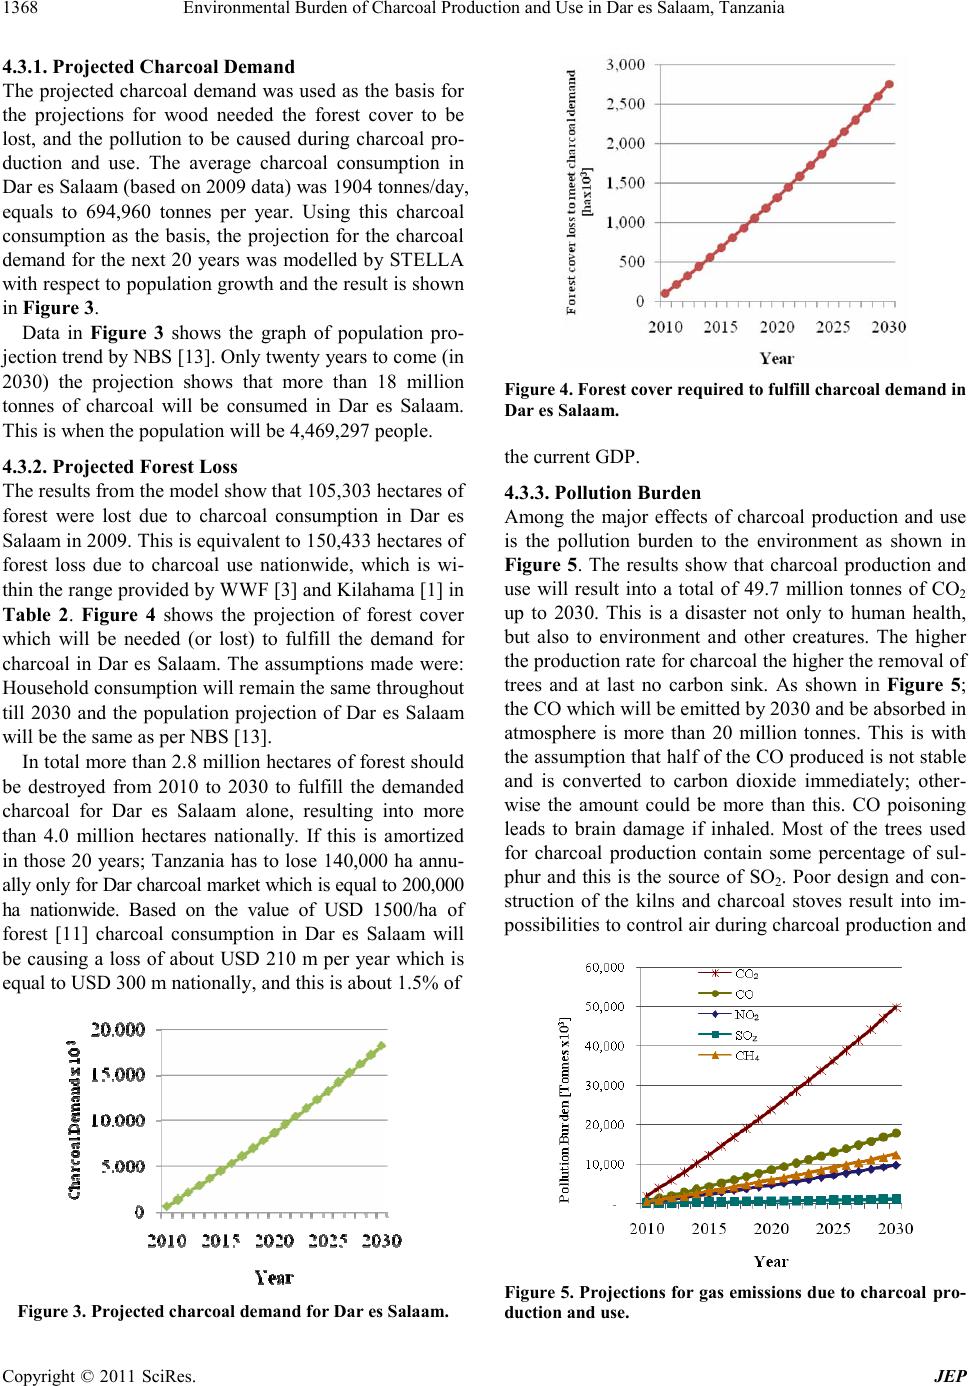 Environmental Burden of Charcoal Production and Use in Dar es Salaam, Tanzania 1368 4.3.1. Projected Charcoal Demand The projected charcoal demand was used as the basis for the projections for wood needed the forest cover to be lost, and the pollution to be caused during charcoal pro- duction and use. The average charcoal consumption in Dar es Salaam (based on 2009 data) was 1904 tonnes/day, equals to 694,960 tonnes per year. Using this charcoal consumption as the basis, the projection for the charcoal demand for the next 20 years was modelled by STELLA with respect to population growth and the result is shown in Figure 3. Data in Figure 3 shows the graph of population pro- jection trend by NBS [13]. Only twenty years to come (in 2030) the projection shows that more than 18 million tonnes of charcoal will be consumed in Dar es Salaam. This is when the population will be 4,469,297 people. 4.3.2. Projected Forest Loss The results from the model show that 105,303 hectares of forest were lost due to charcoal consumption in Dar es Salaam in 2009. This is equivalent to 150,433 hectares of forest loss due to charcoal use nationwide, which is wi- thin the range provided by WWF [3] and Kilahama [1] in Table 2. Figure 4 shows the projection of forest cover which will be needed (or lost) to fulfill the demand for charcoal in Dar es Salaam. The assumptions made were: Household consumption will remain the same throughout till 2030 and the population projection of Dar es Salaam will be the same as per NBS [13]. In total more than 2.8 million hectares of forest should be destroyed from 2010 to 2030 to fulfill the demanded charcoal for Dar es Salaam alone, resulting into more than 4.0 million hectares nationally. If this is amortized in those 20 years; Tanzania has to lose 140,000 ha annu- ally only for Dar charcoal market which is equal to 200,000 ha nationwide. Based on the value of USD 1500/ha of forest [11] charcoal consumption in Dar es Salaam will be causing a loss of about USD 210 m per year which is equal to USD 300 m nationally, and this is about 1.5% of Figure 3 . Projected charcoal demand for Dar es Salaam. Figure 4. Forest cover required to fulfill charcoal demand in Dar es Salaa m. the current GDP. 4.3.3. Pollution Burden Among the major effects of charcoal production and use is the pollution burden to the environment as shown in Figure 5. The results show that charcoal production and use will result into a total of 49.7 million tonnes of CO2 up to 2030. This is a disaster not only to human health, but also to environment and other creatures. The higher the production rate for charcoal the higher the removal of trees and at last no carbon sink. As shown in Figure 5; the CO which will be emitted by 2030 and be absorbed in atmosphere is more than 20 million tonnes. This is with the assumption that half of the CO produced is not stable and is converted to carbon dioxide immediately; other- wise the amount could be more than this. CO poisoning leads to brain damage if inhaled. Most of the trees used for charcoal production contain some percentage of sul- phur and this is the source of SO2. Poor design and con- struction of the kilns and charcoal stoves result into im- possibilities to control air during charcoal production and Figure 5. Projecti ons for gas emissions due to charc oal pro- duct ion and use. Copyright © 2011 SciRes. JEP 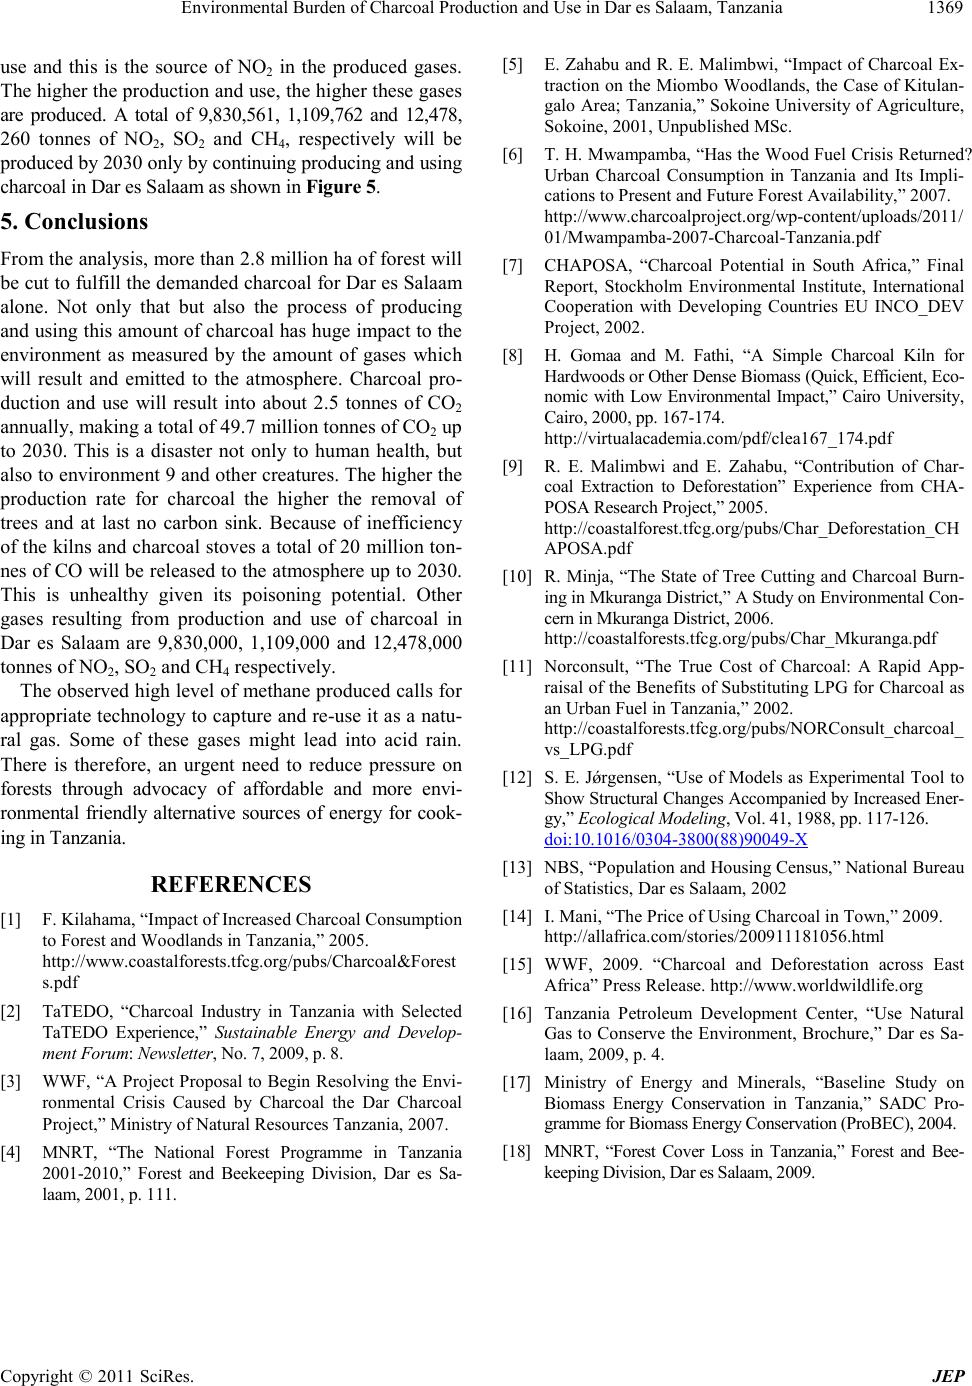 Environmental Burden of Charcoal Production and Use in Dar es Salaam, Tanzania Copyright © 2011 SciRes. JEP 1369 use and this is the source of NO2 in the produced gases. The higher the production and use, the higher these gases are produced. A total of 9,830,561, 1,109,762 and 12,478, 260 tonnes of NO2, SO2 and CH4, respectively will be produced by 2030 only by continuing producing and using charcoal in Dar es Salaam as shown in Figure 5. 5. Conclusions From the analysis, more than 2.8 million ha of forest will be cut to fulfill the demanded charcoal for Dar es Salaam alone. Not only that but also the process of producing and using this amount of charcoal has huge impact to the environment as measured by the amount of gases which will result and emitted to the atmosphere. Charcoal pro- duction and use will result into about 2.5 tonnes of CO2 annually, making a total of 49.7 million tonnes of CO2 up to 2030. This is a disaster not only to human health, but also to environment 9 and other creatures. The higher the production rate for charcoal the higher the removal of trees and at last no carbon sink. Because of inefficiency of the kilns and charcoal stoves a total of 20 million ton- nes of CO will be released to the atmosphere up to 2030. This is unhealthy given its poisoning potential. Other gases resulting from production and use of charcoal in Dar es Salaam are 9,830,000, 1,109,000 and 12,478,000 tonnes of NO2, SO2 and CH4 respectively. The observed high level of methane produced calls for appropriate technology to capture and re-use it as a natu- ral gas. Some of these gases might lead into acid rain. There is therefore, an urgent need to reduce pressure on forests through advocacy of affordable and more envi- ronmental friendly alternative sources of energy for cook- ing in Tanzania. REFERENCES [1] F. Kilahama, “Impact of Increased Charcoal Consumption to Forest and Woodlands in Tanzania,” 2005. http ://www.coastal forests.tfcg. org /pub s/Charco al&Fo rest s.pdf [2] TaTEDO, “Charcoal Industry in Tanzania with Selected TaTEDO Experience,” Sustainable Energy and Develop- ment Forum: Newsletter, No. 7, 2009, p. 8. [3] WWF, “A Project Proposal to Begin Resolving the Envi- ronmental Crisis Caused by Charcoal the Dar Charcoal Project,” Ministry of Natural Resources Tanzania, 2007. [4] MNRT, “The National Forest Programme in Tanzania 2001-2010,” Forest and Beekeeping Division, Dar es Sa- laam, 2001, p. 111. [5] E. Zahabu and R. E. Malimbwi, “Impact of Charcoal Ex- traction on the Miombo Woodlands, the Case of Kitulan- galo Area; Tanzania,” Sokoine University of Agriculture, Sokoine, 2001, Unpublished MSc. [6] T. H. Mwampamba, “Has the Wood Fuel Crisis Returned? Urban Charcoal Consumption in Tanzania and Its Impli- cations to Present and Future Forest Availability,” 2007. http://www.charcoalproject.org/wp-content/uploads/2011/ 01/Mwampamba-2007-Charcoal-Tanzania.pdf [7] CHAPOSA, “Charcoal Potential in South Africa,” Final Report, Stockholm Environmental Institute, International Cooperation with Developing Countries EU INCO_DEV Project, 2002. [8] H. Gomaa and M. Fathi, “A Simple Charcoal Kiln for Hardwoods or Other Dense Biomass (Quick, Efficient, Eco- nomic with Low Environmental Impact,” Cairo University, Cairo, 2000, pp. 167-174. http ://virtu alacad emia.co m/pdf/cl ea167_174.pdf [9] R. E. Malimbwi and E. Zahabu, “Contribution of Char- coal Extraction to Deforestation” Experience from CHA- POSA Research Project,” 2005. http://coastalforest.tfcg.org/pubs/Char_Deforestation_CH APOSA.pdf [10] R. Minja, “The State of Tree Cutting and Charcoal Burn- ing in Mkuranga District,” A Study on Environmental Con- cern in Mkuranga District, 2006. http://coastalforests.tfcg.org/pubs/Char_Mkuranga.pdf [11] Norconsult, “The True Cost of Charcoal: A Rapid App- raisal of the Benefits of Substituting LPG for Charcoal as an Urban Fuel in Tanzania,” 2002. http://coastalforests.tfcg.org/pubs/NORConsult_charcoal_ vs_LPG.pdf [12] S. E. Jǿrgensen, “Use of Models as Experimental Tool to Show Structural Changes Accompanied by Increased Ener- gy,” Ecological Modeling, Vol. 41, 1988, pp. 117-126. do i:1 0.10 16 /03 04 -38 00( 88) 90 049- X [13] NBS, “Population and Housing Census,” National Bureau of Statistics, Dar es Salaam, 2002 [14] I. Mani, “The Price of Using Charcoal in Town,” 2009. http://allafrica.com/stories/200911181056.html [15] WWF, 2009. “Charcoal and Deforestation across East Africa” Press Release. http://www.worldwildlife.org [16] Tanzania Petroleum Development Center, “Use Natural Gas to Conserve the Environment, Brochure,” Dar es Sa- laam, 2009, p. 4. [17] Ministry of Energy and Minerals, “Baseline Study on Biomass Energy Conservation in Tanzania,” SADC Pro- gramme for Biomass Energy Conservation (ProBEC), 2004. [18] MNRT, “Forest Cover Loss in Tanzania,” Forest and Bee- keeping Division, Dar es Salaam, 2009. |