

Paper Menu >>
Journal Menu >>
 J. Biomedical Science and Engineering, 2011, 4, 755-761 doi:10.4236/jbise.2011.412093 Published Online December 2011 (http://www.SciRP.org/journal/jbise/ JBiSE ). Published Online December 2011 in SciRes. http://www.scirp.org/journal/JBiSE Imaging of arterial plaque by quadrature swept-source optical coherence tomography with signal to noise ratio enhancements Youxin Mao*, Costel Flueraru, Shoude Chang Institute for Microstructural Sciences, National Research Council Canada, Ottawa, Canada. Email: *[email protected] Received 18 August 2011; revised 5 October 2011; accepted 11 November 2011. ABSTRACT Arterial plaque from a myocardial infarction-prone Watanabe heritable hyperlipidemic (WHHLMI) rab- bit is visualized and characterized using a signal to noise ratio enhanced swept-source optical coherence tomography system with a quadrature interferometer (QSS-OCT). A semiconductor optical amplifier is used in the sample arm to amplify the weak signal scattered from arterial plague. Signal to noise ratio improvement are demonstrated in our QSS-OCT system. This finding results into an increase of the penetration depth possible in OCT images, from 1 mm to 2 mm. Preliminary results show that vulner- able plaque with fibrous cap, macrophage accumula- tions and calcification in the arterial tissue are meas- urable with our QSS-OCT system. Keywords: Optical Coherence Tomography; Arterial Plaque; Medical and Biological Imaging; Semiconductor Optical Amplifier 1. INTRODUCTION The identification of unstable plaque is central in risk- stratifying patients for acute coronary events. Optical coherence tomography (OCT) [1] is a recently intro- duced imaging modality that has shown considerable promise for the identification of high-risk plaques. The advantages of OCT compared to ultrasound include its higher resolution, video speed acquisition rate, com- pactness and portability. When a small and inexpensive optical fiber probe as an optical catheter constitutes the sample arm, the system becomes suitable for intra-vas- cular probing [2]. Because OCT uses light, a variety of functional and spectroscopic techniques are available to expand its capabilities, including polarization, absorp- tion, elastography, Doppler, and dispersion analysis. An OCT system with higher signal-to-noise ratio (SNR) is essentially important for imaging turbid tissues, such as arterial plaques, because the backscattered sig- nals from these types of samples are extremely weak. Swept-source OCT (SS-OCT) has received much atten- tion in recent years not only because of its higher SNR at high imaging speeds but also for its imaging possibilities in the 1300 nm wavelength range, where the reduced light scattering by tissue enables OCT to collect signal from deeper into tissue compared to OCT imaging based on shorter source wavelengths. SS-OCT could also use the quadrature interferometer based on multi-port fiber couplers such as the 3 × 3 quadrature interferometer [3]. When measuring instantaneous complex signals with stable phase information by using a 3 × 3 quadrature interferometer one can suppress the complex conjugate artefact and therefore double the effective imaging depth [4,5]. The phase information of the complex interfer- ometric signals can also be exploited to gain additonal information about the tissue, to enhance image contrast and to perform quantitative measurements. In addition, the Mach-Zehnder configuration of the presented inter- ferometric setup (MZI) allows different options to dis- tribute optical power between the reference and sample arms. An unbalanced input directs more optical power from the light source to the sample than that to the ref- erence mirror [6] while the balanced detection is used to reduce the beat noise [7]. Both techniques play their parts in increasing SNR. However in the case of imaging turbid biomedical samples, the signal backscattered from tissue is much weaker than the reference signal so an attenuation of optical power in the reference arm is re- quired in order to increase the SNR. The ability of OCT to image vascular plaque has been previously demon- strated [8-11]. However, OCT images of the arterial wall are limited to depths of ~1 mm even using the Fourier domain methods [2]. The limited imaging depth into the vascular wall is one of the most serious limitations for OCT to be used as a routine clinical intravascular imag- ing method. Further improvement of the SNR of OCT is needed in order to increase the imaging depth of OCT into tissue. Adding an optical amplifier in the path of the backscattered signal in the sample arm of an SS-OCT 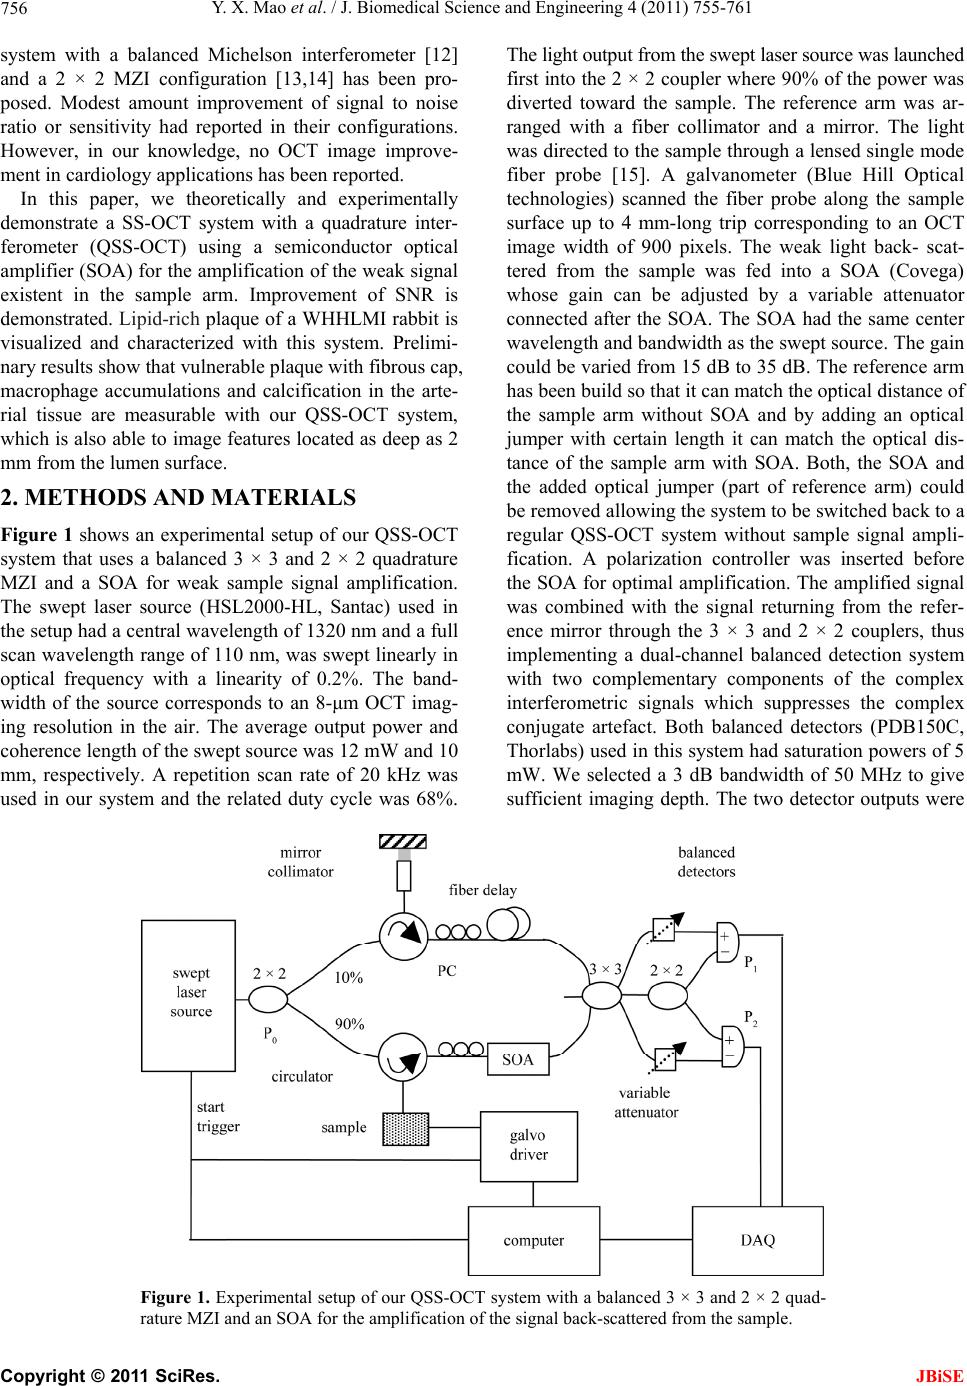 Y. X. Mao et al. / J. Biomedical Science and Engineering 4 (2011) 755-761 756 system with a balanced Michelson interferometer [12] and a 2 × 2 MZI configuration [13,14] has been pro- posed. Modest amount improvement of signal to noise ratio or sensitivity had reported in their configurations. However, in our knowledge, no OCT image improve- ment in cardiology applications has been reported. In this paper, we theoretically and experimentally demonstrate a SS-OCT system with a quadrature inter- ferometer (QSS-OCT) using a semiconductor optical amplifier (SOA) for the amplification of the weak signal existent in the sample arm. Improvement of SNR is demonstrated. Lipid-rich plaque of a WHHLMI rabbit is visualized and characterized with this system. Prelimi- nary results show that vulnerable plaque with fibrous cap, macrophage accumulations and calcification in the arte- rial tissue are measurable with our QSS-OCT system, which is also able to image features located as deep as 2 mm from the lumen surface. 2. METHODS AND MATERIALS Figure 1 shows an experimental setup of our QSS-OCT system that uses a balanced 3 × 3 and 2 × 2 quadrature MZI and a SOA for weak sample signal amplification. The swept laser source (HSL2000-HL, Santac) used in the setup had a central wavelength of 1320 nm and a full scan wavelength range of 110 nm, was swept linearly in optical frequency with a linearity of 0.2%. The band- width of the source corresponds to an 8-μm OCT imag- ing resolution in the air. The average output power and coherence length of the swept source was 12 mW and 10 mm, respectively. A repetition scan rate of 20 kHz was used in our system and the related duty cycle was 68%. The light output from the swept laser source was launched first into the 2 × 2 coupler where 90% of the power was diverted toward the sample. The reference arm was ar- ranged with a fiber collimator and a mirror. The light was directed to the sample through a lensed single mode fiber probe [15]. A galvanometer (Blue Hill Optical technologies) scanned the fiber probe along the sample surface up to 4 mm-long trip corresponding to an OCT image width of 900 pixels. The weak light back- scat- tered from the sample was fed into a SOA (Covega) whose gain can be adjusted by a variable attenuator connected after the SOA. The SOA had the same center wavelength and bandwidth as the swept source. The gain could be varied from 15 dB to 35 dB. The reference arm has been build so that it can match the optical distance of the sample arm without SOA and by adding an optical jumper with certain length it can match the optical dis- tance of the sample arm with SOA. Both, the SOA and the added optical jumper (part of reference arm) could be removed allowing the system to be switched back to a regular QSS-OCT system without sample signal ampli- fication. A polarization controller was inserted before the SOA for optimal amplification. The amplified signal was combined with the signal returning from the refer- ence mirror through the 3 × 3 and 2 × 2 couplers, thus implementing a dual-channel balanced detection system with two complementary components of the complex interferometric signals which suppresses the complex conjugate artefact. Both balanced detectors (PDB150C, Thorlabs) used in this system had saturation powers of 5 mW. We selected a 3 dB bandwidth of 50 MHz to give sufficient imaging depth. The two detector outputs were Figure 1. Experimental setup of our QSS-OCT system with a balanced 3 × 3 and 2 × 2 quad- rature MZI and an SOA for the amplification of the signal back-scattered from the sample. C opyright © 2011 SciRes. JBiSE  Y. X. Mao et al. / J. Biomedical Science and Engineering 4 (2011) 755-761 757 digitized using a data acquisition card (DAQ) (Ala- zartech, Montreal) with 14-bit resolution and acquired signal at a sampling speed of 100 MS/s. The swept source generated a start trigger signal that was used to initiate the function generator for the galvo scanner and initiate the data acquisition process for each A-scan. Because the swept source was linearly swept with the wave-number k, A-scans data with resolved complex conjugate artifact were obtained by a direct inverse Fou- rier transformation (IFT) from the DAQ sampled data without performing an additional re-sampling step. Watanabe heritable hyperlipidemic (WHHLMI) rabbit is a suitable animal model to study familial hypercho- lesterolemia and atherosclerosis. Arteries in these rabbits develop atheromatous plaques similar to those in hu- mans [16]. Figure 2(a) shows a picture of a segment of the descending aorta together with the protected for- ward-view ball fiber probe collecting an OCT image in this work. The size of the OCT probe and the properties of the probing beam are important for OCT imaging. An optical fiber-lensed probe with a diameter as small as 0.5 mm is suitable for OCT imaging, especially for in vivo intravascular imaging. Based on interaction of near in- frared light with different human tissues, the range of penetration depth is from 0.5 mm to 3 mm [17]. Work- ing distance range of an ultra-small fiber-based lense [15] can be designed from 0.4 to 1.2 mm for matching the penetration depth of tissues tested. Depth of field can be in the range of 0.3 - 1.5 mm, which corresponds the spot size range of 15 - 35 μm at the 1300 nm wavelength, because the tradeoff between the depth of field and beam spot size for a Gaussian beam. For imaging arterial tis- sue, a fiber ball lens was designed and fabricated in house with a ball size of 0.3 mm, the working distance of 1.25 mm, depth of field of 1.0 mm, and 1/e2 spot di- ameter of 29 μm shown in the inset of Figure 2(a) as a forward—view probe. To form a side-view fiber probe, the output beam can be total internal reflected 90 - 100 degree by a 45 - 50 degree polished face on the fiber ball. As a sample, a needle delivered fiber catheter probe de- signed for the OCT intravascular imaging is shown in Figure 2(b). The polished lens and the uncoated portion of the SMF are protected in a transparent inner catheter (OD 0.49 mm) shown in the inset of Figure 2(b). The buffered portion of the fiber is attached to an outer flexi- ble catheter (OD 1.4 mm) after a syringe, which is fas- tened onto a modified syringe piston (not shown here), while the transparent inner catheter is inserted into a 21 G (OD 0.81 mm) echogenic spinal needle (VWR, Mis- sissauga, ON, Canada). After insertion into the tissue, (a) (b) Figure 2. (a) An opened left descending coronary tissue from a Watanabe heritable hyperlipidemic (WHHLMI) rabbit being scanned with the forward ball lens fiber probe protected by a plastic tube. Inset: A scanning electron micrograph of the fiber ball lens with forward-view fabricated in our lab. (b) A needle tip of a side-view fibber ball lens probe as a sample of an OCT probe for in vivo intravascular imaging. the needle can be drawn back a small distance to let the optical probe expose to the tissue as shown in Figure 2(b). The probe is then scanned axially inside the tissue driven by a linear scanner, such that a two dimensional OCT image is formed. 3. SIGNAL TO NOISE RATIO ANALYSIS To estimate SNR in our QSS-OCT system shown in Figure 1(a), assuming that the signal in the sample arm is coming from a single layer reflector located at the depth of z0, the two channel currents on the positive and negative photodiodes in each balanced detector when the SOA is inserted into the sample arm are given by [14, 18]: 1 0 ,,2,cos mrmsmSPrmsm m IkGPkPkGP GPkPkGkz 2 (1) C opyright © 2011 SciRes. JBiSE  Y. X. Mao et al. / J. Biomedical Science and Engineering 4 (2011) 755-761 758 2 0 ,,2,cos2 mrmsmSPrmsm m IkGPkPkGP GPkPkGkz (2) where, 0 ehv is photodiode conversion factor, is the quantum efficiency of the detector, e is the elec- tronic charge, h is the Planck’s constant, 0 is the mean frequency of the incident light, is the optical signal power from the reference arm arriving at the pho- todiodes when wavenumber k = km, is the amplified optical signal power from the sample arm at the photodiodes when wavenumber k = km, rm Pk , sm Pk G complex discrete Fourier transform (DFT). Then, the ma- ximum-squared signal power in our system with the dual- balanced quadrature detection is given as [18]: 22 4rs I GDPP G (3) G SP P is the spontaneous emission power of the SOA recorded at the photodiodes, G is the gain of SOA, is an arbi- trary phase shift, is the phase shift between the two output signals, m = 1, 2, , M, where M is the total sampling number of the axial pixels. Balanced detection subtracts each positive and negative current for each channel shown in Eqs.1 and 2, so that the common DC parts are subtracted and the opposite AC parts are multi- plied. The complementary phase components of the sig- nals can be calculated by Eqs.8 and 9 i n Ref. [4] for a where the brackets denote the ensemble average, Pr is the optical power impinging on each photodiode re- flected from the reference mirror. s PG is the ampli- fied signal power incident on each photodiode backscat- tered from the sample. D is a multiplied factor coming from complex IFT, with D = 2 in our setup. In this configuration there are three typical noise sources: thermal noise, shot noise and beat noise [19]. By extending the noise analysis of SS-OCT [18] with slightly mismatched balanced detection [20] to our QSS- OCT system with the SOA inserted into on the sample arm, the total noise power as a function of the SOA gain, G, is obtained: 222 22 2 4222 1 thrSPb rsprrs sp GDBiePPGRINPP GRINPRINP G (4) where, B is the detector bandwidth, ith is the thermal current of the detector, β is a balanced factor [21] with β = 1 representing a balanced system, RINr/s = 2/δνr/s is the relative intensity noise of source and SOA, δνr and δνs is their effective bandwidth, respectively. RINb is the rela- tive cross-beat intensity noise from the reference light and the spontaneous emission power of the SOA, which can be estimated from the experimental results. The first and second terms in Eq.4 are thermal noise and shot noise as commonly expressed. The third term represents the beat noise, which includes the cross-beat and self-beat noise of the two arms. If the losses and reflectivities of the reference and sample arms are defined as γr, Rr and γs, Rs, then the powers from the reference and sample arms impinging on the photodiodes can be described as PoγrARr and PoγsGRs, respectively, where A is the reference at- tenuation when the sample signal is not being amplified. If the loss from the SOA to the detector is defined as γ, the spontaneous emission power of the SOA impinging on the photodiodes can be written as γPsp. The SNR of our QSS-OCT system with the SOA inserted for weak sample signal amplification is described as: 22 2 0 22 det 0 2 22 22 22 00 16 4 2221 rrss rr sp brrsprrrs sp DP ARGR SNR G BiePARP G RINP ARPGRINP ARRINPG (5) Figure 3 shows the calculated results for various noise powers (a) and SNR (b) versus SOA gain, G, when the QSS-OCT system contains a sample signal amplifier (right-side horizontal axis) and versus reference arm attenuation, A, when the QSS-OCT system without a sample signal amplifier (left-side horizontal axis). The calculations are based on the following assumptions: λ0 = 1.32 μm, δλr = 1 nm, P0 = 12 mW, γr = –20 dB, γs = –10.5 dB, γ = –9 dB, Rr = 0 dB, Rs = –55 dB, B = 50 MHz, β = 0.99, ith = 2 n A/sqrt (Hz), δλs = 100 nm, Psp = Psp0G, Psp0 = 10–3 mW. From the theoretical analysis results shown in Figure 3, when the QSS-OCT system without the SOA, refer- ence light power could be attenuated to reduce the ref- erence power self-beat noise and to obtain the shot-noise limit. When the QSS-OCT system contains the SOA on the sample arm, the SNR can be increased as the gain of SOA increase although the system is no longer shotnoise C opyright © 2011 SciRes. JBiSE 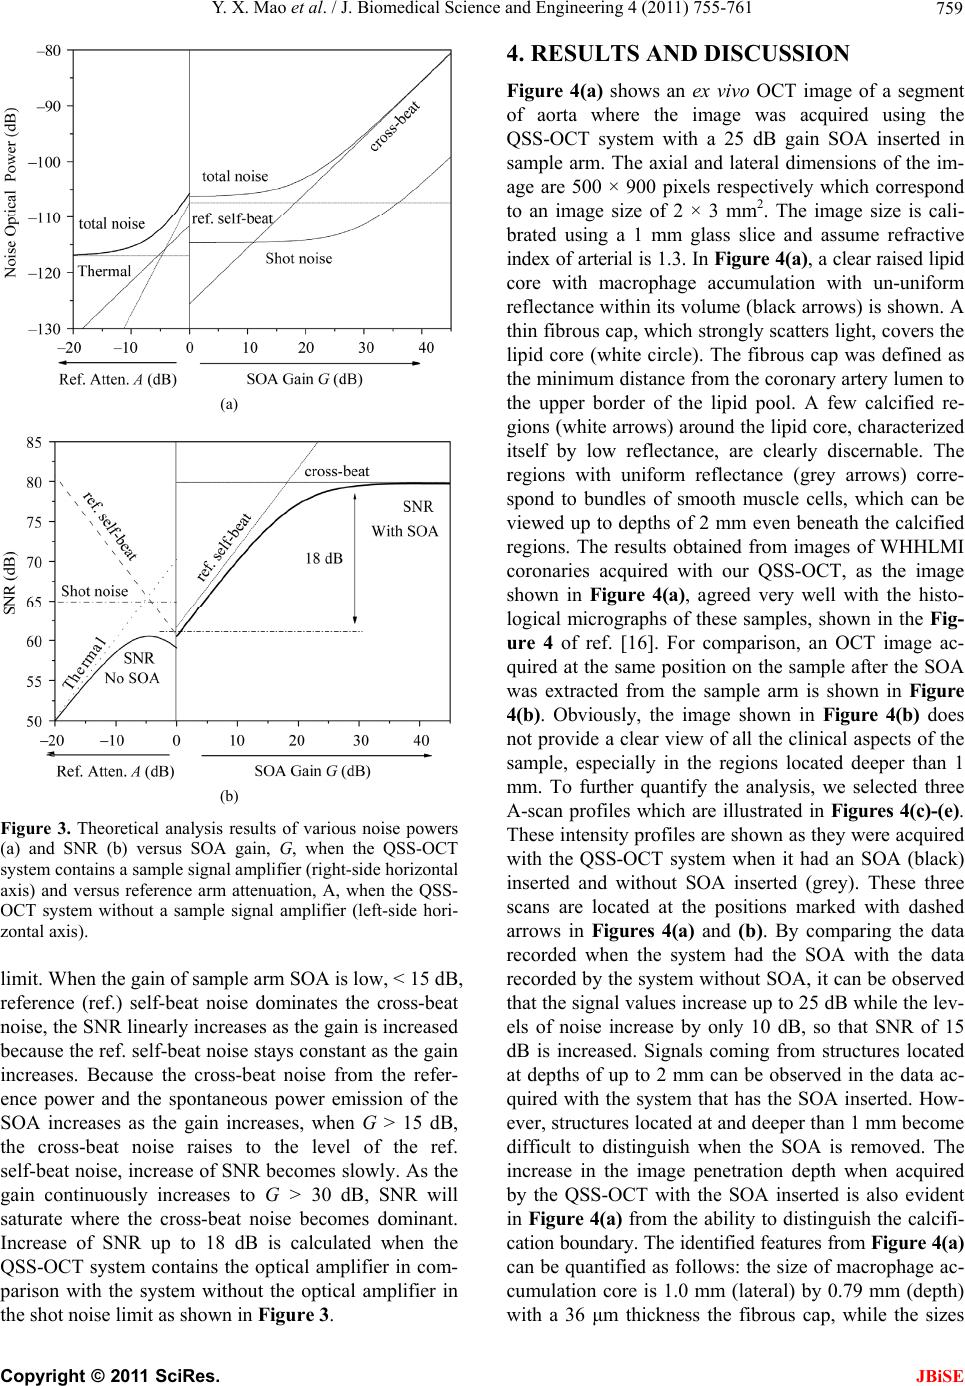 Y. X. Mao et al. / J. Biomedical Science and Engineering 4 (2011) 755-761 759 (a) (b) Figure 3. Theoretical analysis results of various noise powers (a) and SNR (b) versus SOA gain, G, when the QSS-OCT system contains a sample signal amplifier (right-side horizontal axis) and versus reference arm attenuation, A, when the QSS- OCT system without a sample signal amplifier (left-side hori- zontal axis). limit. When the gain of sample arm SOA is low, < 15 dB, reference (ref.) self-beat noise dominates the cross-beat noise, the SNR linearly increases as the gain is increased because the ref. self-beat noise stays constant as the gain increases. Because the cross-beat noise from the refer- ence power and the spontaneous power emission of the SOA increases as the gain increases, when G > 15 dB, the cross-beat noise raises to the level of the ref. self-beat noise, increase of SNR becomes slowly. As the gain continuously increases to G > 30 dB, SNR will saturate where the cross-beat noise becomes dominant. Increase of SNR up to 18 dB is calculated when the QSS-OCT system contains the optical amplifier in com- parison with the system without the optical amplifier in the shot noise limit as shown in Figure 3. 4. RESULTS AND DISCUSSION Figure 4(a) shows an ex vivo OCT image of a segment of aorta where the image was acquired using the QSS-OCT system with a 25 dB gain SOA inserted in sample arm. The axial and lateral dimensions of the im- age are 500 × 900 pixels respectively which correspond to an image size of 2 × 3 mm2. The image size is cali- brated using a 1 mm glass slice and assume refractive index of arterial is 1.3. In Figure 4(a), a clear raised lipid core with macrophage accumulation with un-uniform reflectance within its volume (black arrows) is shown. A thin fibrous cap, which strongly scatters light, covers the lipid core (white circle). The fibrous cap was defined as the minimum distance from the coronary artery lumen to the upper border of the lipid pool. A few calcified re- gions (white arrows) around the lipid core, characterized itself by low reflectance, are clearly discernable. The regions with uniform reflectance (grey arrows) corre- spond to bundles of smooth muscle cells, which can be viewed up to depths of 2 mm even beneath the calcified regions. The results obtained from images of WHHLMI coronaries acquired with our QSS-OCT, as the image shown in Figure 4(a), agreed very well with the histo- logical micrographs of these samples, shown in the Fig- ure 4 of ref. [16]. For comparison, an OCT image ac- quired at the same position on the sample after the SOA was extracted from the sample arm is shown in Figure 4(b). Obviously, the image shown in Figure 4(b) does not provide a clear view of all the clinical aspects of the sample, especially in the regions located deeper than 1 mm. To further quantify the analysis, we selected three A-scan profiles which are illustrated in Figures 4(c)-(e). These intensity profiles are shown as they were acquired with the QSS-OCT system when it had an SOA (black) inserted and without SOA inserted (grey). These three scans are located at the positions marked with dashed arrows in Figures 4(a) and (b). By comparing the data recorded when the system had the SOA with the data recorded by the system without SOA, it can be observed that the signal values increase up to 25 dB while the lev- els of noise increase by only 10 dB, so that SNR of 15 dB is increased. Signals coming from structures located at depths of up to 2 mm can be observed in the data ac- quired with the system that has the SOA inserted. How- ever, structures located at and deeper than 1 mm become difficult to distinguish when the SOA is removed. The increase in the image penetration depth when acquired by the QSS-OCT with the SOA inserted is also evident in Figure 4(a) from the ability to distinguish the calcifi- cation boundary. The identified features from Figure 4(a) can be quantified as follows: the size of macrophage ac- cumulation core is 1.0 mm (lateral) by 0.79 mm (depth) with a 36 μm thickness the fibrous cap, while the sizes C opyright © 2011 SciRes. JBiSE 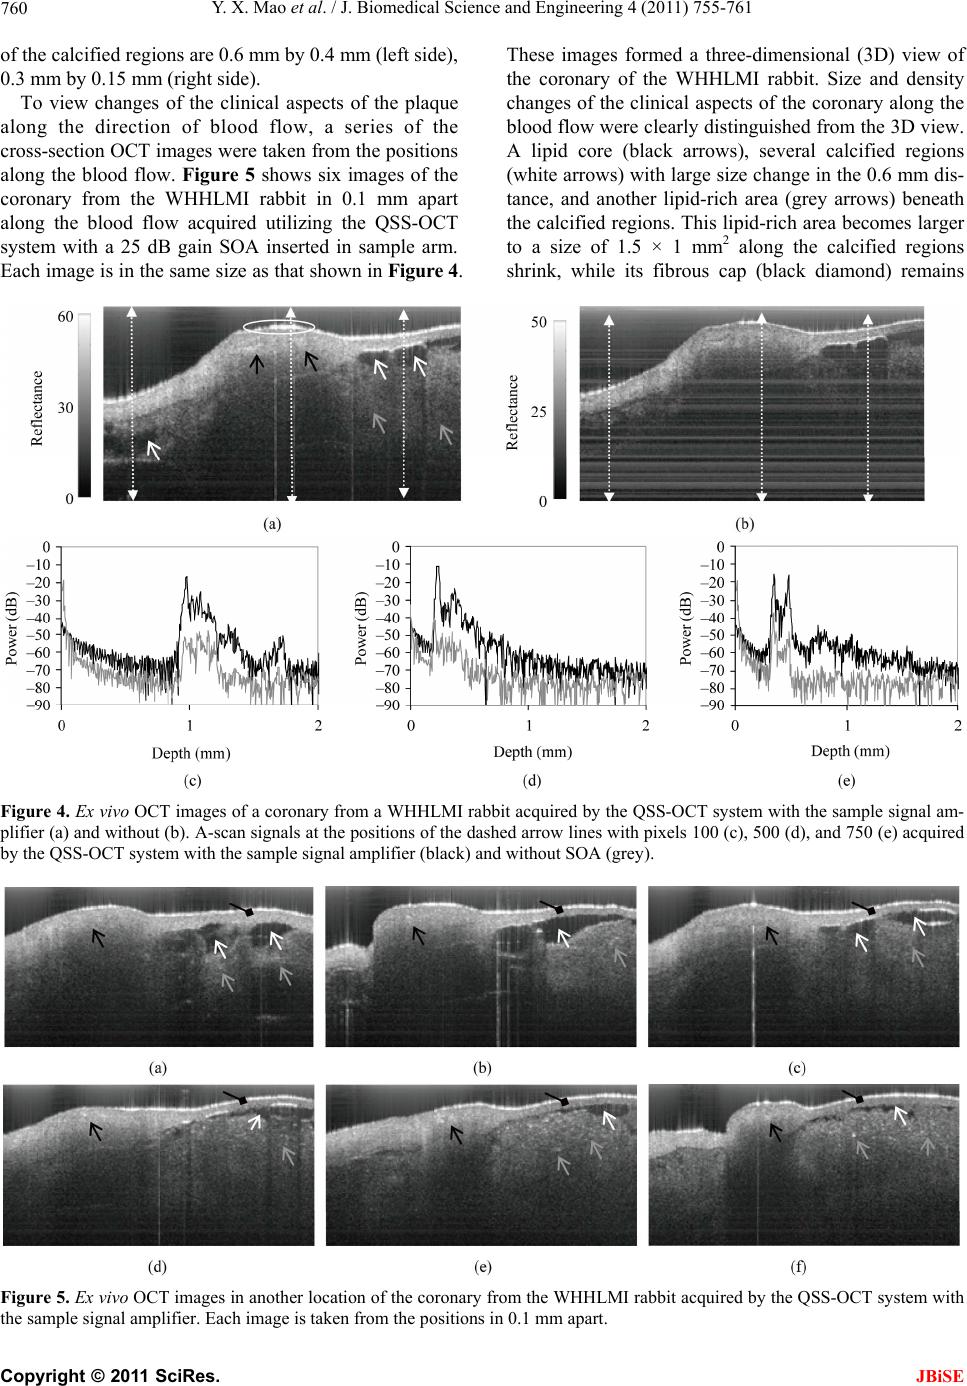 Y. X. Mao et al. / J. Biomedical Science and Engineering 4 (2011) 755-761 Copyright © 2011 SciRes. 760 of the calcified regions are 0.6 mm by 0.4 mm (left side), 0.3 mm by 0.15 mm (right side). To view changes of the clinical aspects of the plaque along the direction of blood flow, a series of the cross-section OCT images were taken from the positions along the blood flow. Figure 5 shows six images of the coronary from the WHHLMI rabbit in 0.1 mm apart along the blood flow acquired utilizing the QSS-OCT system with a 25 dB gain SOA inserted in sample arm. Each image is in the same size as that shown in Figure 4. These images formed a three-dimensional (3D) view of the coronary of the WHHLMI rabbit. Size and density changes of the clinical aspects of the coronary along the blood flow were clearly distinguished from the 3D view. A lipid core (black arrows), several calcified regions (white arrows) with large size change in the 0.6 mm dis- tance, and another lipid-rich area (grey arrows) beneath the calcified regions. This lipid-rich area becomes larger to a size of 1.5 × 1 mm2 along the calcified regions shrink, while its fibrous cap (black diamond) remains Figure 4. Ex vivo OCT images of a coronary from a WHHLMI rabbit acquired by the QSS-OCT system with the sample signal am- plifier (a) and without (b). A-scan signals at the positions of the dashed arrow lines with pixels 100 (c), 500 (d), and 750 (e) acquired by the QSS-OCT system with the sample signal amplifier (black) and without SOA (grey). Figure 5. Ex vivo OCT images in another location of the coronary from the WHHLMI rabbit acquired by the QSS-OCT system with the sample signal amplifier. Each image is taken from the positions in 0.1 mm apart. JBiSE 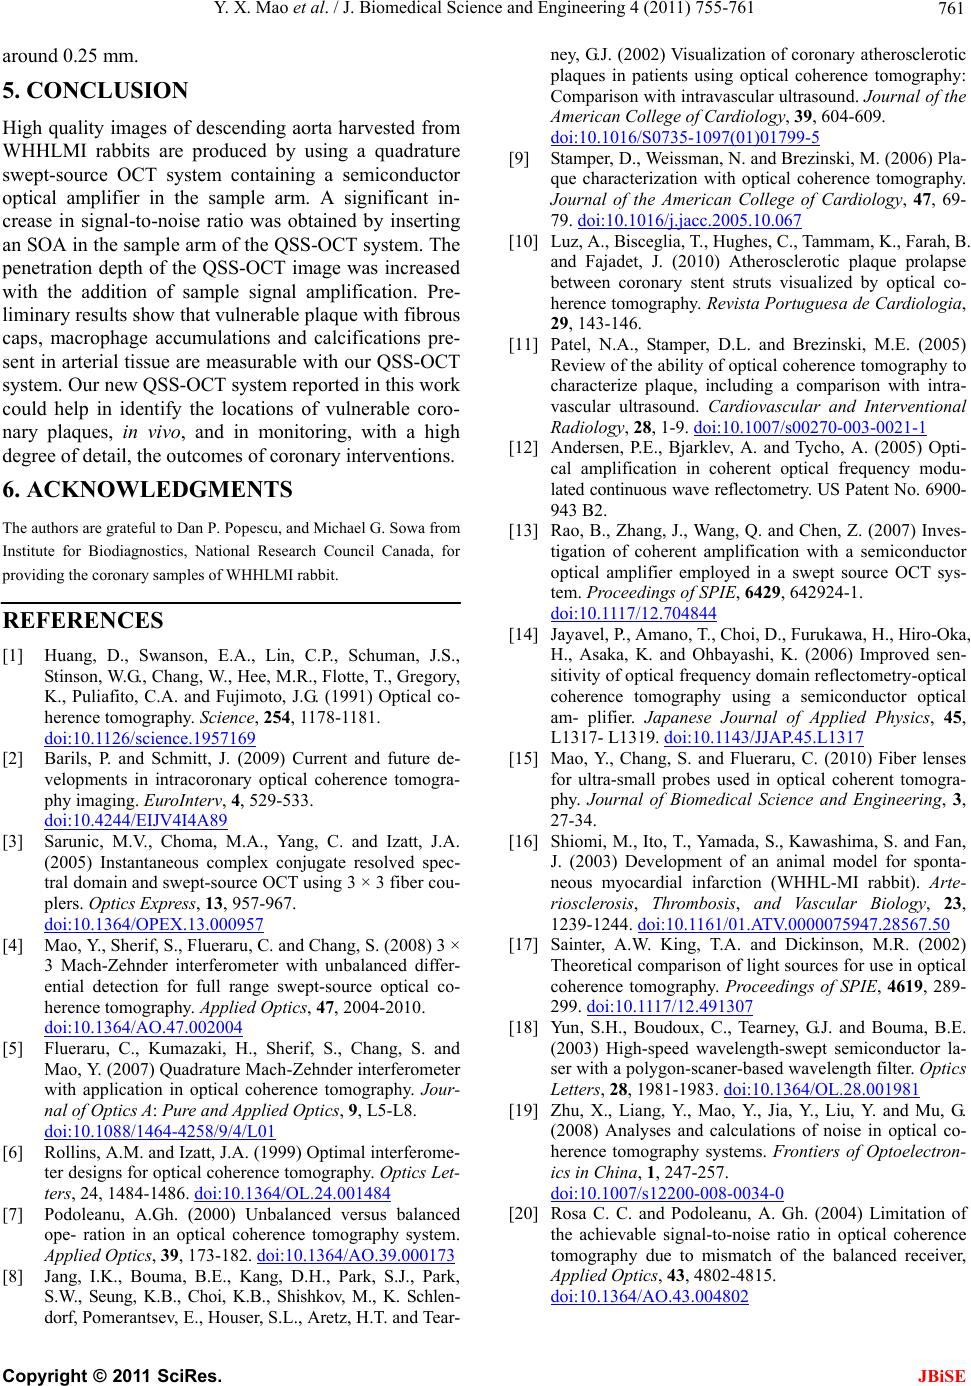 Y. X. Mao et al. / J. Biomedical Science and Engineering 4 (2011) 755-761 761 around 0.25 mm. 5. CONCLUSION High quality images of descending aorta harvested from WHHLMI rabbits are produced by using a quadrature swept-source OCT system containing a semiconductor optical amplifier in the sample arm. A significant in- crease in signal-to-noise ratio was obtained by inserting an SOA in the sample arm of the QSS-OCT system. The penetration depth of the QSS-OCT image was increased with the addition of sample signal amplification. Pre- liminary results show that vulnerable plaque with fibrous caps, macrophage accumulations and calcifications pre- sent in arterial tissue are measurable with our QSS-OCT system. Our new QSS-OCT system reported in this work could help in identify the locations of vulnerable coro- nary plaques, in vivo, and in monitoring, with a high degree of detail, the outcomes of coronary interventions. 6. ACKNOWLEDGMENTS The authors are grateful to Dan P. Popescu, and Michael G. Sowa from Institute for Biodiagnostics, National Research Council Canada, for providing the coronary samples of WHHLMI rabbit. REFERENCES [1] Huang, D., Swanson, E.A., Lin, C.P., Schuman, J.S., Stinson, W.G., Chang, W., Hee, M.R., Flotte, T., Gregory, K., Puliafito, C.A. and Fujimoto, J.G. (1991) Optical co- herence tomography. Science, 254, 1178-1181. doi:10.1126/science.1957169 [2] Barils, P. and Schmitt, J. (2009) Current and future de- velopments in intracoronary optical coherence tomogra- phy imaging. EuroInterv, 4, 529-533. doi:10.4244/EIJV4I4A89 [3] Sarunic, M.V., Choma, M.A., Yang, C. and Izatt, J.A. (2005) Instantaneous complex conjugate resolved spec- tral domain and swept-source OCT using 3 × 3 fiber cou- plers. Optics Express, 13, 957-967. doi:10.1364/OPEX.13.000957 [4] Mao, Y., Sherif, S., Flueraru, C. and Chang, S. (2008) 3 × 3 Mach-Zehnder interferometer with unbalanced differ- ential detection for full range swept-source optical co- herence tomography. Applied Optics, 47, 2004-2010. doi:10.1364/AO.47.002004 [5] Flueraru, C., Kumazaki, H., Sherif, S., Chang, S. and Mao, Y. (2007) Quadrature Mach-Zehnder interferometer with application in optical coherence tomography. Jour- nal of Optics A: Pure and Applied Optics, 9, L5-L8. doi:10.1088/1464-4258/9/4/L01 [6] Rollins, A.M. and Izatt, J.A. (1999) Optimal interferome- ter designs for optical coherence tomography. Optics Let- ters, 24, 1484-1486. doi:10.1364/OL.24.001484 [7] Podoleanu, A.Gh. (2000) Unbalanced versus balanced ope- ration in an optical coherence tomography system. Applied Optics, 39, 173-182. doi:10.1364/AO.39.000173 [8] Jang, I.K., Bouma, B.E., Kang, D.H., Park, S.J., Park, S.W., Seung, K.B., Choi, K.B., Shishkov, M., K. Schlen- dorf, Pomerantsev, E., Houser, S.L., Aretz, H.T. and Tear- ney, G.J. (2002) Visualization of coronary atherosclerotic plaques in patients using optical coherence tomography: Comparison with intravascular ultrasound. Journal of the American College of Cardiology, 39, 604-609. doi:10.1016/S0735-1097(01)01799-5 [9] Stamper, D., Weissman, N. and Brezinski, M. (2006) Pla- que characterization with optical coherence tomography. Journal of the American College of Cardiology, 47, 69- 79. doi:10.1016/j.jacc.2005.10.067 [10] Luz, A., Bisceglia, T., Hughes, C., Tammam, K., Farah, B. and Fajadet, J. (2010) Atherosclerotic plaque prolapse between coronary stent struts visualized by optical co- herence tomography. Revista Portuguesa de Cardiologia, 29, 143-146. [11] Patel, N.A., Stamper, D.L. and Brezinski, M.E. (2005) Review of the ability of optical coherence tomography to characterize plaque, including a comparison with intra- vascular ultrasound. Cardiovascular and Interventional Radiology, 28, 1-9. doi:10.1007/s00270-003-0021-1 [12] Andersen, P.E., Bjarklev, A. and Tycho, A. (2005) Opti- cal amplification in coherent optical frequency modu- lated continuous wave reflectometry. US Patent No. 6900- 943 B2. [13] Rao, B., Zhang, J., Wang, Q. and Chen, Z. (2007) Inves- tigation of coherent amplification with a semiconductor optical amplifier employed in a swept source OCT sys- tem. Proceedings of SPIE, 6429, 642924-1. doi:10.1117/12.704844 [14] Jayavel, P., Amano, T., Choi, D., Furukawa, H., Hiro-Oka, H., Asaka, K. and Ohbayashi, K. (2006) Improved sen- sitivity of optical frequency domain reflectometry-optical coherence tomography using a semiconductor optical am- plifier. Japanese Journal of Applied Physics, 45, L1317- L1319. doi:10.1143/JJAP.45.L1317 [15] Mao, Y., Chang, S. and Flueraru, C. (2010) Fiber lenses for ultra-small probes used in optical coherent tomogra- phy. Journal of Biomedical Science and Engineering, 3, 27-34. [16] Shiomi, M., Ito, T., Yamada, S., Kawashima, S. and Fan, J. (2003) Development of an animal model for sponta- neous myocardial infarction (WHHL-MI rabbit). Arte- riosclerosis, Thrombosis, and Vascular Biology, 23, 1239-1244. doi:10.1161/01.ATV.0000075947.28567.50 [17] Sainter, A.W. King, T.A. and Dickinson, M.R. (2002) Theoretical comparison of light sources for use in optical coherence tomography. Proceedings of SPIE, 4619, 289- 299. doi:10.1117/12.491307 [18] Yun, S.H., Boudoux, C., Tearney, G.J. and Bouma, B.E. (2003) High-speed wavelength-swept semiconductor la- ser with a polygon-scaner-based wavelength filter. Optics Letters, 28, 1981-1983. doi:10.1364/OL.28.001981 [19] Zhu, X., Liang, Y., Mao, Y., Jia, Y., Liu, Y. and Mu, G. (2008) Analyses and calculations of noise in optical co- herence tomography systems. Frontiers of Optoelectron- ics in China, 1, 247-257. doi:10.1007/s12200-008-0034-0 [20] Rosa C. C. and Podoleanu, A. Gh. (2004) Limitation of the achievable signal-to-noise ratio in optical coherence tomography due to mismatch of the balanced receiver, Applied Optics, 43, 4802-4815. doi:10.1364/AO.43.004802 C opyright © 2011 SciRes. JBiSE |