

Paper Menu >>
Journal Menu >>
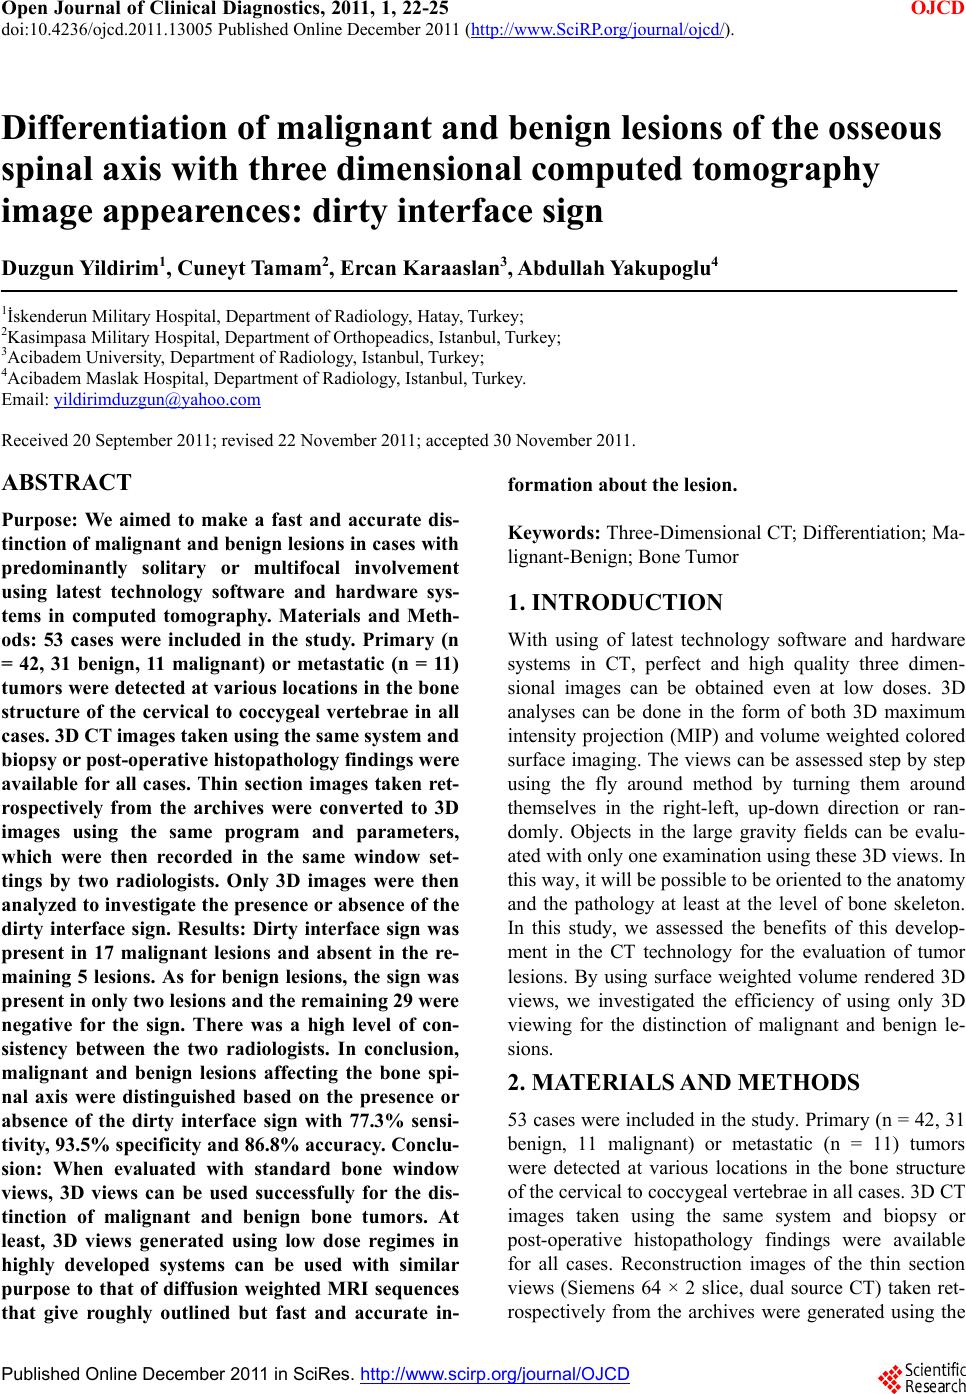 Open Journal of Clinical Diagnostics, 2011, 1, 22-25 doi:10.4236/ojcd.2011.13005 Published Online December 2011 (http://www.SciRP.org/journal/ojcd/ OJCD ). Published Online December 2011 in SciRes. http://www.scirp.org/journal/OJCD Differentiation of malignant and benign lesions of the osseous spinal axis with three dimensional computed tomography image appearences: dirty interface sign Duzgun Y ildirim1, Cuneyt Tamam2, Ercan Karaaslan3, Abdullah Yakupoglu4 1İskenderun Military Hospital, Department of Radiology, Hatay, Turkey; 2Kasimpasa Military Hospital, Department of Orthopeadics, Istanbul, Turkey; 3Acibadem University, Department of Radiology, Istanbul, Turkey; 4Acibadem Maslak Hospital, Department of Radiology, Istanbul, Turkey. Email: [email protected] Received 20 September 2011; revised 22 November 2011; accepted 30 November 2011. ABSTRACT Purpose: We aimed to make a fast and accurate dis- tinction of malignant and benign lesion s in cases with predominantly solitary or multifocal involvement using latest technology software and hardware sys- tems in computed tomography. Materials and Meth- ods: 53 cases were included in the study. Primary (n = 42, 31 benign, 11 malignant) or metastatic (n = 11) tumors were detected at various locati ons in the bo ne structure of the cervical to coccygeal vertebrae in all cases. 3D CT images taken using the same system and biopsy or post-operative histopathology findings were available for all cases. Thin section images taken ret- rospectively from the archives were converted to 3D images using the same program and parameters, which were then recorded in the same window set- tings by two radiologists. Only 3D images were then analyzed to investigate the presence or absence of the dirty interface sign. Results: Dirty interface sign was present in 17 malignant lesions and absent in the re- maining 5 lesions. As for benign lesions, the sign was present in only two lesions and the remaining 29 were negative for the sign. There was a high level of con- sistency between the two radiologists. In conclusion, malignant and benign lesions affecting the bone spi- nal axis were distinguished based on the presence or absence of the dirty interface sign with 77.3% sensi- tivity, 93.5% specificity and 86.8% accuracy. Conclu- sion: When evaluated with standard bone window views, 3D views can be used successfully for the dis- tinction of malignant and benign bone tumors. At least, 3D views generated using low dose regimes in highly developed systems can be used with similar purpose to that of diffusion weighted MRI sequences that give roughly outlined but fast and accurate in- formation about th e lesion . Keywords: Three-Dimensional CT; Differentiation; Ma- lignant-Benign; Bone Tumor 1. INTRODUCTION With using of latest technology software and hardware systems in CT, perfect and high quality three dimen- sional images can be obtained even at low doses. 3D analyses can be done in the form of both 3D maximum intensity projection (MIP) and volume weighted colored surface imaging. The views can be assessed step by step using the fly around method by turning them around themselves in the right-left, up-down direction or ran- domly. Objects in the large gravity fields can be evalu- ated with only one examination using these 3D views. In this way, it will be possible to be oriented to the anatomy and the pathology at least at the level of bone skeleton. In this study, we assessed the benefits of this develop- ment in the CT technology for the evaluation of tumor lesions. By using surface weighted volume rendered 3D views, we investigated the efficiency of using only 3D viewing for the distinction of malignant and benign le- sions. 2. MATERIALS AND METHODS 53 cases were included in the study. Primary (n = 42, 31 benign, 11 malignant) or metastatic (n = 11) tumors were detected at various locations in the bone structure of the cervical to coccygeal vertebrae in all cases. 3D CT images taken using the same system and biopsy or post-operative histopathology findings were available for all cases. Reconstruction images of the thin section views (Siemens 64 × 2 slice, dual source CT) taken ret- rospectively from the archives were generated using the 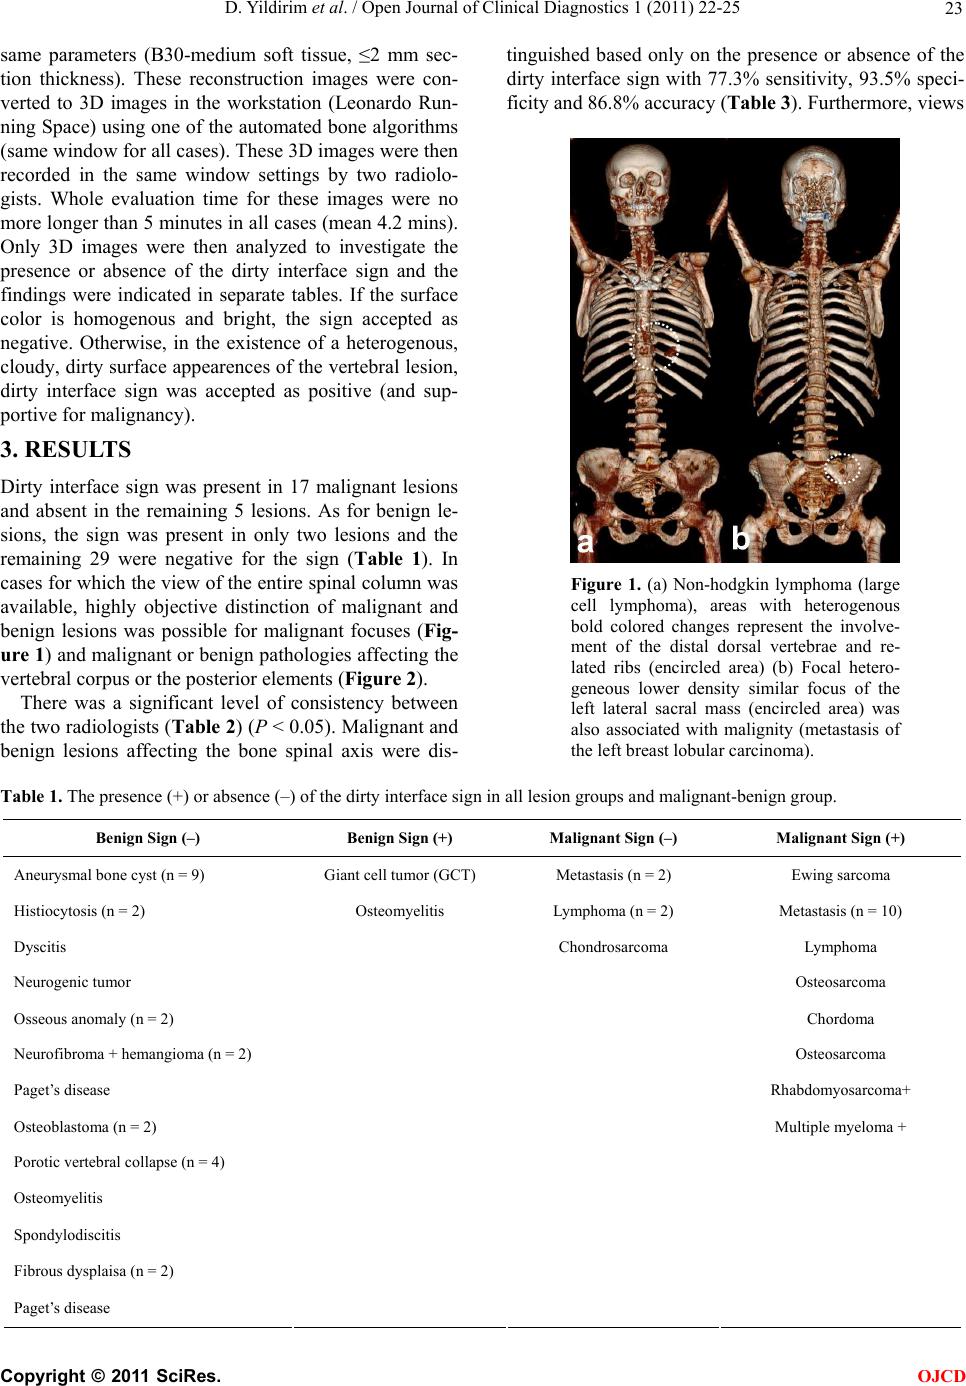 D. Yildirim et al. / Open Journal of Clinical Diagnostics 1 (2011) 22-25 23 same parameters (B30-medium soft tissue, ≤2 mm sec- tion thickness). These reconstruction images were con- verted to 3D images in the workstation (Leonardo Run- ning Space) using one of the automated bone algorithms (same window for all cases). These 3D images were then recorded in the same window settings by two radiolo- gists. Whole evaluation time for these images were no more longer than 5 minutes in all cases (mean 4.2 mins). Only 3D images were then analyzed to investigate the presence or absence of the dirty interface sign and the findings were indicated in separate tables. If the surface color is homogenous and bright, the sign accepted as negative. Otherwise, in the existence of a heterogenous, cloudy, dirty surface appearences of the vertebral lesion, dirty interface sign was accepted as positive (and sup- portive for malignancy). 3. RESULTS Dirty interface sign was present in 17 malignant lesions and absent in the remaining 5 lesions. As for benign le- sions, the sign was present in only two lesions and the remaining 29 were negative for the sign (Table 1). In cases for which the view of the entire spinal column was available, highly objective distinction of malignant and benign lesions was possible for malignant focuses (Fig- ure 1) and malignant or benign pathologies affecting the vertebral corpus or the posterior elements (Figure 2). There was a significant level of consistency between the two radiologists (Ta ble 2) (P < 0.05). Malignant and benign lesions affecting the bone spinal axis were dis- tinguished based only on the presence or absence of the dirty interface sign with 77.3% sensitivity, 93.5% speci- ficity and 86.8% accuracy (Table 3). Furthermore, views Figure 1. (a) Non-hodgkin lymphoma (large cell lymphoma), areas with heterogenous bold colored changes represent the involve- ment of the distal dorsal vertebrae and re- lated ribs (encircled area) (b) Focal hetero- geneous lower density similar focus of the left lateral sacral mass (encircled area) was also associated with malignity (metastasis of the left breast lobular carcinoma). Table 1. The presence (+) or absence (–) of the dirty interface sign in all lesion groups and malignant-benign group. Benign Sign (–) Benign Sign (+) Malignant Sign (–) Malignant Sign (+) Aneurysmal bone cyst (n = 9) Giant cell tumor (GCT) Metastasis (n = 2) Ewing sarcoma Histiocytosis (n = 2) Osteomyelitis Lymphoma (n = 2) Metastasis (n = 10) Dyscitis Chondrosarcoma Lymphoma Neurogenic tumor Osteosarcoma Osseous anomaly (n = 2) Chordoma Neurofibroma + hemangioma (n = 2) Osteosarcoma Paget’s disease Rhabdomyosarcoma+ Osteoblastoma (n = 2) Multiple myeloma + Porotic vertebral collapse (n = 4) Osteomyelitis Spondylodiscitis Fibrous dysplaisa (n = 2) Paget’s disease C opyright © 2011 SciRes. OJCD 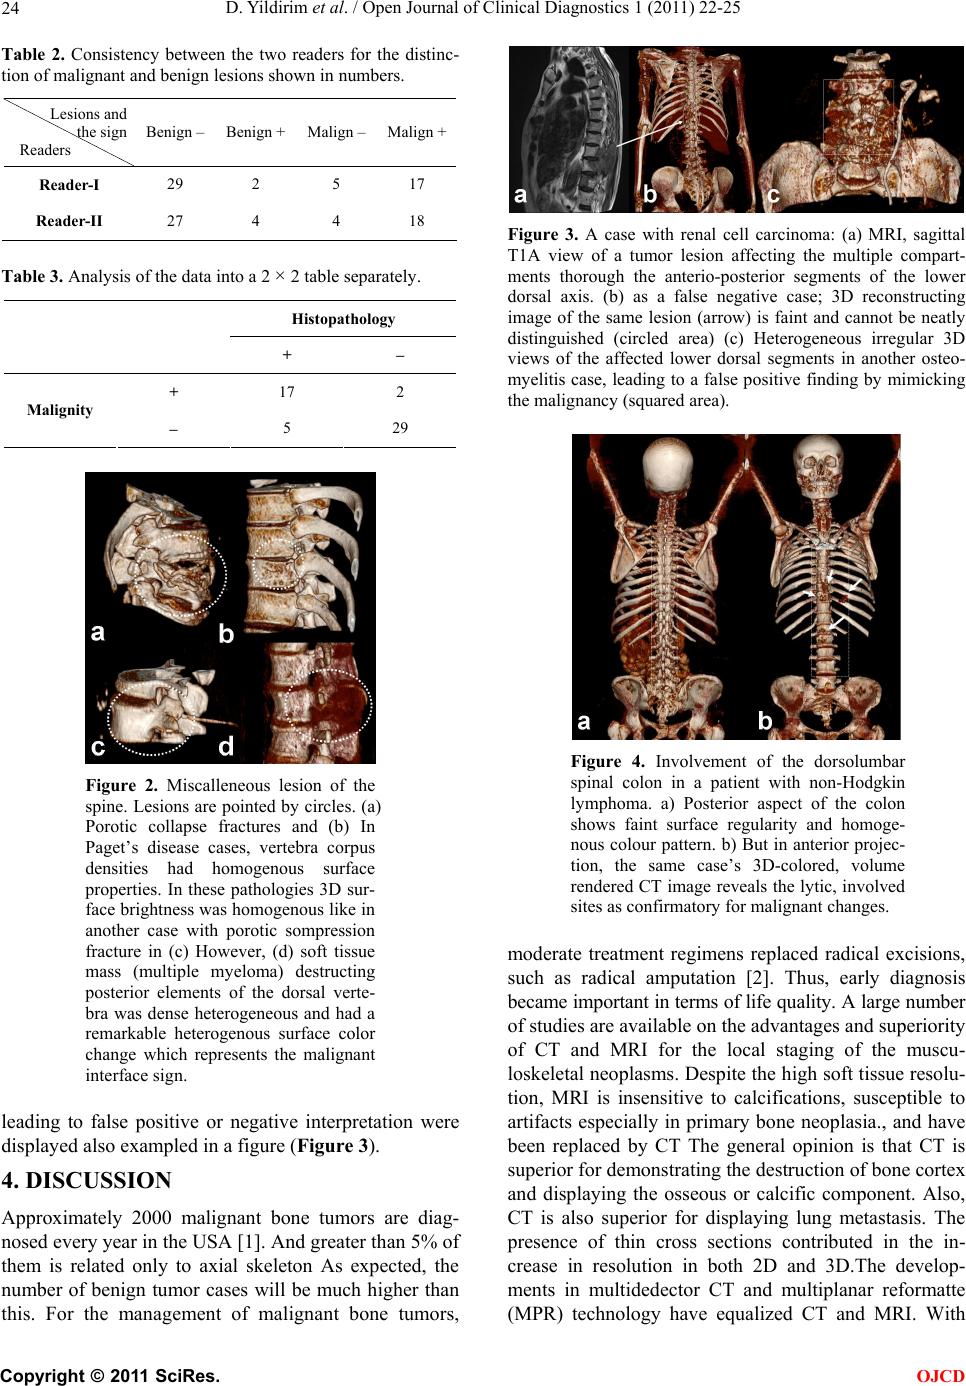 D. Yildirim et al. / Open Journal of Clinical Diagnostics 1 (2011) 22-25 24 Table 2. Consistency between the two readers for the distinc- tion of malignant and benign lesions shown in numbers. Lesions and the sign Readers Benign – Benign + Malign – Malign + Reader-I 29 2 5 17 Reader-II 27 4 4 18 Table 3. Analysis of the data into a 2 × 2 table separately. Histopathology + – + 17 2 Malignity – 5 29 Figure 2. Miscalleneous lesion of the spine. Lesions are pointed by circles. (a) Porotic collapse fractures and (b) In Paget’s disease cases, vertebra corpus densities had homogenous surface properties. In these pathologies 3D sur- face brightness was homogenous like in another case with porotic sompression fracture in (c) However, (d) soft tissue mass (multiple myeloma) destructing posterior elements of the dorsal verte- bra was dense heterogeneous and had a remarkable heterogenous surface color change which represents the malignant interface sign. leading to false positive or negative interpretation were displayed also exampled in a figure (Figure 3). 4. DISCUSSION Approximately 2000 malignant bone tumors are diag- nosed every year in the USA [1]. And greater than 5% of them is related only to axial skeleton As expected, the number of benign tumor cases will be much higher than this. For the management of malignant bone tumors, Figure 3. A case with renal cell carcinoma: (a) MRI, sagittal T1A view of a tumor lesion affecting the multiple compart- ments thorough the anterio-posterior segments of the lower dorsal axis. (b) as a false negative case; 3D reconstructing image of the same lesion (arrow) is faint and cannot be neatly distinguished (circled area) (c) Heterogeneous irregular 3D views of the affected lower dorsal segments in another osteo- myelitis case, leading to a false positive finding by mimicking the malignancy (squared area). Figure 4. Involvement of the dorsolumbar spinal colon in a patient with non-Hodgkin lymphoma. a) Posterior aspect of the colon shows faint surface regularity and homoge- nous colour pattern. b) But in anterior projec- tion, the same case’s 3D-colored, volume rendered CT image reveals the lytic, involved sites as confirmatory for malignant changes. moderate treatment regimens replaced radical excisions, such as radical amputation [2]. Thus, early diagnosis became important in terms of life quality. A large number of studies are available on the advantages and superiority of CT and MRI for the local staging of the muscu- loskeletal neoplasms. Despite the high soft tissue resolu- tion, MRI is insensitive to calcifications, susceptible to artifacts especially in primary bone neoplasia., and have been replaced by CT The general opinion is that CT is superior for demonstrating the destruction of bone cortex and displaying the osseous or calcific component. Also, CT is also superior for displaying lung metastasis. The presence of thin cross sections contributed in the in- crease in resolution in both 2D and 3D.The develop- ments in multidedector CT and multiplanar reformatte (MPR) technology have equalized CT and MRI. With C opyright © 2011 SciRes. OJCD 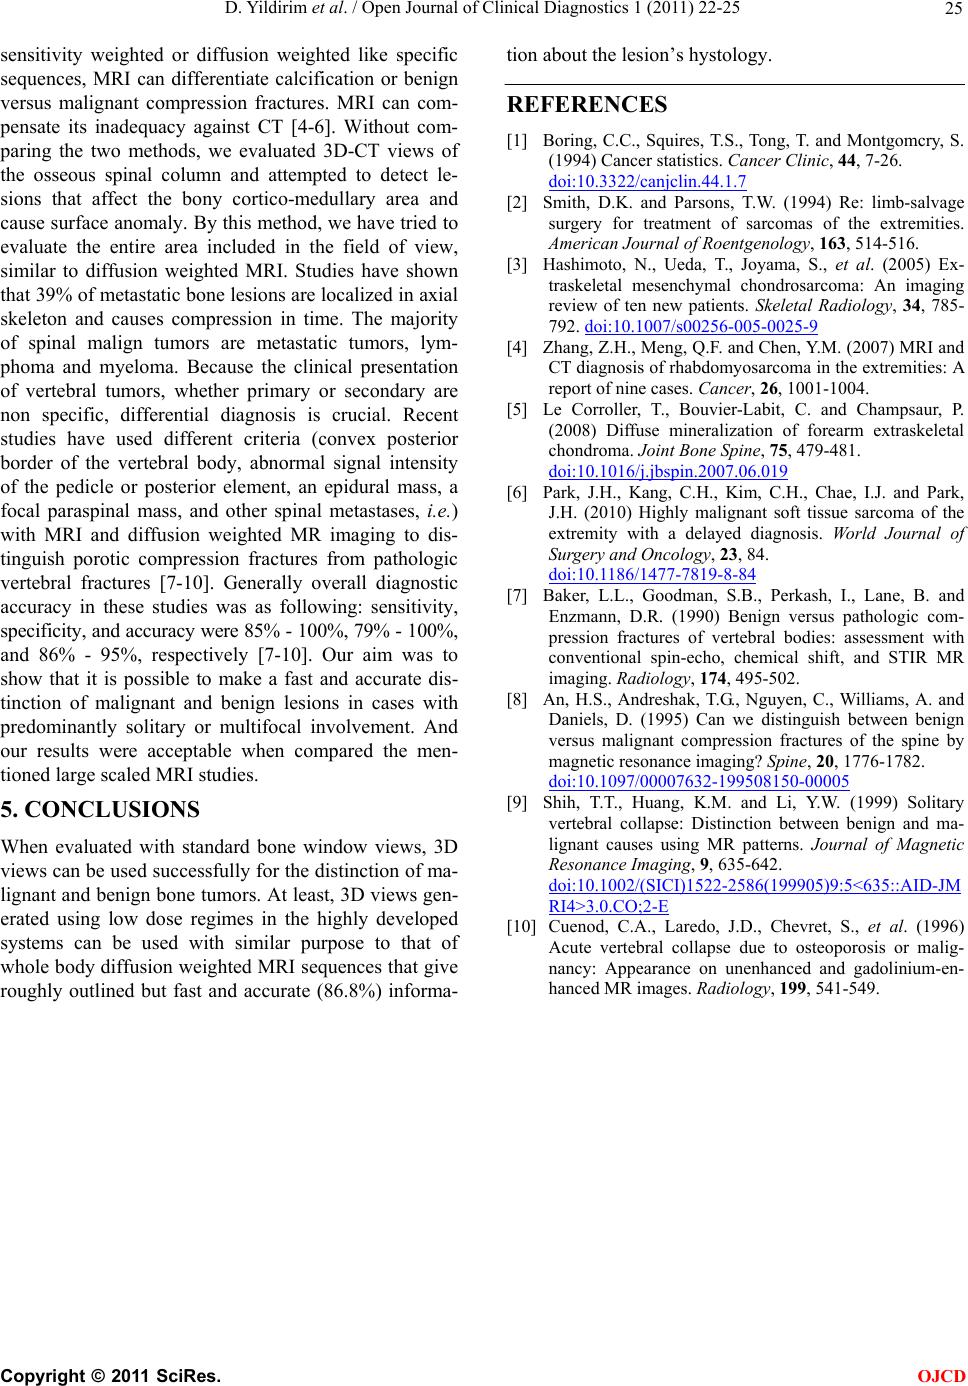 D. Yildirim et al. / Open Journal of Clinical Diagnostics 1 (2011) 22-25 25 sensitivity weighted or diffusion weighted like specific sequences, MRI can differentiate calcification or benign versus malignant compression fractures. MRI can com- pensate its inadequacy against CT [4-6]. Without com- paring the two methods, we evaluated 3D-CT views of the osseous spinal column and attempted to detect le- sions that affect the bony cortico-medullary area and cause surface anomaly. By this method, we have tried to evaluate the entire area included in the field of view, similar to diffusion weighted MRI. Studies have shown that 39% of metastatic bone lesions are localized in axial skeleton and causes compression in time. The majority of spinal malign tumors are metastatic tumors, lym- phoma and myeloma. Because the clinical presentation of vertebral tumors, whether primary or secondary are non specific, differential diagnosis is crucial. Recent studies have used different criteria (convex posterior border of the vertebral body, abnormal signal intensity of the pedicle or posterior element, an epidural mass, a focal paraspinal mass, and other spinal metastases, i.e.) with MRI and diffusion weighted MR imaging to dis- tinguish porotic compression fractures from pathologic vertebral fractures [7-10]. Generally overall diagnostic accuracy in these studies was as following: sensitivity, specificity, and accuracy were 85% - 100%, 79% - 100%, and 86% - 95%, respectively [7-10]. Our aim was to show that it is possible to make a fast and accurate dis- tinction of malignant and benign lesions in cases with predominantly solitary or multifocal involvement. And our results were acceptable when compared the men- tioned large scaled MRI studies. 5. CONCLUSIONS When evaluated with standard bone window views, 3D views can be used successfully for the distinction of ma- lignant and benign bone tumors. At least, 3D views gen- erated using low dose regimes in the highly developed systems can be used with similar purpose to that of whole body diffusion weighted MRI sequences that give roughly outlined but fast and accurate (86.8%) informa- tion about the lesion’s hystology. REFERENCES [1] Boring, C.C., Squires, T.S., Tong, T. and Montgomcry, S. (1994) Cancer statistics. Cancer Clin ic, 44, 7-26. doi:10.3322/canjclin.44.1.7 [2] Smith, D.K. and Parsons, T.W. (1994) Re: limb-salvage surgery for treatment of sarcomas of the extremities. American Journal of Roentgenology, 163, 514-516. [3] Hashimoto, N., Ueda, T., Joyama, S., et al. (2005) Ex- traskeletal mesenchymal chondrosarcoma: An imaging review of ten new patients. Skeletal Radiology, 34, 785- 792. doi:10.1007/s00256-005-0025-9 [4] Zhang, Z.H., Meng, Q.F. and Chen, Y.M. (2007) MRI and CT diagnosis of rhabdomyosarcoma in the extremities: A report of nine cases. Cancer, 26, 1001-1004. [5] Le Corroller, T., Bouvier-Labit, C. and Champsaur, P. (2008) Diffuse mineralization of forearm extraskeletal chondroma. Joint Bone Spine, 75, 479-481. doi:10.1016/j.jbspin.2007.06.019 [6] Park, J.H., Kang, C.H., Kim, C.H., Chae, I.J. and Park, J.H. (2010) Highly malignant soft tissue sarcoma of the extremity with a delayed diagnosis. World Journal of Surgery and Oncology, 23, 84. doi:10.1186/1477-7819-8-84 [7] Baker, L.L., Goodman, S.B., Perkash, I., Lane, B. and Enzmann, D.R. (1990) Benign versus pathologic com- pression fractures of vertebral bodies: assessment with conventional spin-echo, chemical shift, and STIR MR imaging. Radiology, 174, 495-502. [8] An, H.S., Andreshak, T.G., Nguyen, C., Williams, A. and Daniels, D. (1995) Can we distinguish between benign versus malignant compression fractures of the spine by magnetic resonance imaging? Spine, 20, 1776-1782. doi:10.1097/00007632-199508150-00005 [9] Shih, T.T., Huang, K.M. and Li, Y.W. (1999) Solitary vertebral collapse: Distinction between benign and ma- lignant causes using MR patterns. Journal of Magnetic Resonance Imaging, 9, 635-642. doi:10.1002/(SICI)1522-2586(199905)9:5<635::AID-JM RI4>3.0.CO;2-E [10] Cuenod, C.A., Laredo, J.D., Chevret, S., et al. (1996) Acute vertebral collapse due to osteoporosis or malig- nancy: Appearance on unenhanced and gadolinium-en- hanced MR images. Radiology, 199, 541-549. C opyright © 2011 SciRes. OJCD |