

Paper Menu >>
Journal Menu >>
 Open Journal of Clinical Diagnostics, 2011, 1, 15-21 doi:10.4236/ojcd.2011.13004 Published Online December 2011 (http://www.SciRP.org/journal/ojcd/ OJCD ). Published Online December 2011 in SciRes. http://www.scirp.org/journal/OJCD Optimization of ultrasound assessments of arterial function Lee Stoner1,2*, Cary West 2, Danielle Morozewicz Cates2, Joanna M. Young3 1School of Sport and Exercise, Massey University, Wellington, New Zealand; 2Department of Kinesiology, University of Georgia, Ramsey Center, Athens, USA; 3Lipid and Diabetes Research Group, Diabetes Research Institute, Christchurch, New Zealand. Email: *[email protected] Received 16 September 2011; revised 18 November 2011; accepted 18 November 2011. ABSTRACT Ultrasound technology is widely used to make as- sessments of arterial function. The delicate nature of these measurements requires that sources of errors are limited. Therefore, the aim of this study was to assess variability due to probe selection and optimi- zation settings. Methods: Ten healthy 20 - 26 year old male and female subjects were tested. Brachial artery size (diameter) was measured thirty times a second using a B-mode Ultrasound unit equipped with a high-resolution video capture device. Distension was calculated using systolic and diastolic diameters. To assess intersession variability, we made recordings over twelve minutes; with the probe being removed and re-positioned every four minutes. To assess vari- ability due to probe selection and optimization, we manipulated four parameters: 1) Probe selection (7 - 13 MHz, 5 - 10 MHz, 6 - 9 MHz); 2) Probe frequency (11 MHZ, 9.6 MHZ, 8 MHz); 3) Measurement loca- tion (near, center or middle field); And 4) Image mode (B-mode, duplex-mode). To assess inter-session variability, three sets of recordings were made for each probe selection and optimization setting. Results: Mean diameter ICC’s for inter-session variability, probe frequency, measurement location, image dis- play size, and probe selection were 0.99, 0.98, 0.97, 0.99, and 0.90 respectively. Distension ICC’s for intersession variability, probe frequency, measure- ment location, image display size, and probe selection were 0.66, 0.26, 0.62, 0.60, and 0.51 respectively. Conclusions: Altering probe selection increases measurement variability to the greatest extent. How- ever, as long as probe selection and optimization set- tings are kept constant, our inter-session variability shows that reliable measurements can be made. Keywords: Ultrasound; Reproducibility; Diameters; Dis- tension; Arterial Stiffness 1. INTRODUCTION Ultrasound is widely used for the diagnostic assessment of the carotid and peripheral arteries. The elastic proper- ties of carotid and peripheral arteries are assessed by studying dynamic properties of the arterial walls. Through measurement of arterial distention, together with local blood pressures, indices of arterial stiffness can be cal- culated. Assessments of arterial stiffness have shown to predict future cardiovascular complications [1-4]. In order to calculate arterial stiffness, the diameter of a given artery must be continuously measured across the cardiac cycle. For a carotid artery, this may entail meas- urements that range from 8.0 mm to ~ 8.3 mm, a disten- tion of 0.3 mm. For peripheral arteries, the distention range will be much lower. Therefore, even small varia- tions in systolic or diastolic diameters can notably im- pact distention measurements. For this reason, it is im- portant to limit possible sources of error. However, the requirement for standardization of ultrasound technical settings has not been reported in the literature. The aim of this study was to assess variability due to probe selection and optimization settings. To assess variability due to probe selection and optimization four parameters were manipulated: 1) Probe selection; 2) Probe frequency; 3) Measurement location; And, 4) Im- age mode. To assess inter-session variability, three re- cordings were made for each parameter. 2. METHODS 2.1. Subjects Ten healthy 20 - 26 year old male and female subjects were tested. Informed consent was obtained from the subjects after they were given a detailed description of the procedures. The study was approved by the Univer- sity of Georgia Institutional Review Board. Subjects were excluded from the study if they demonstrated any cardiovascular disease health risks or were taking medi- cations with known vasoactive properties. Subjects were 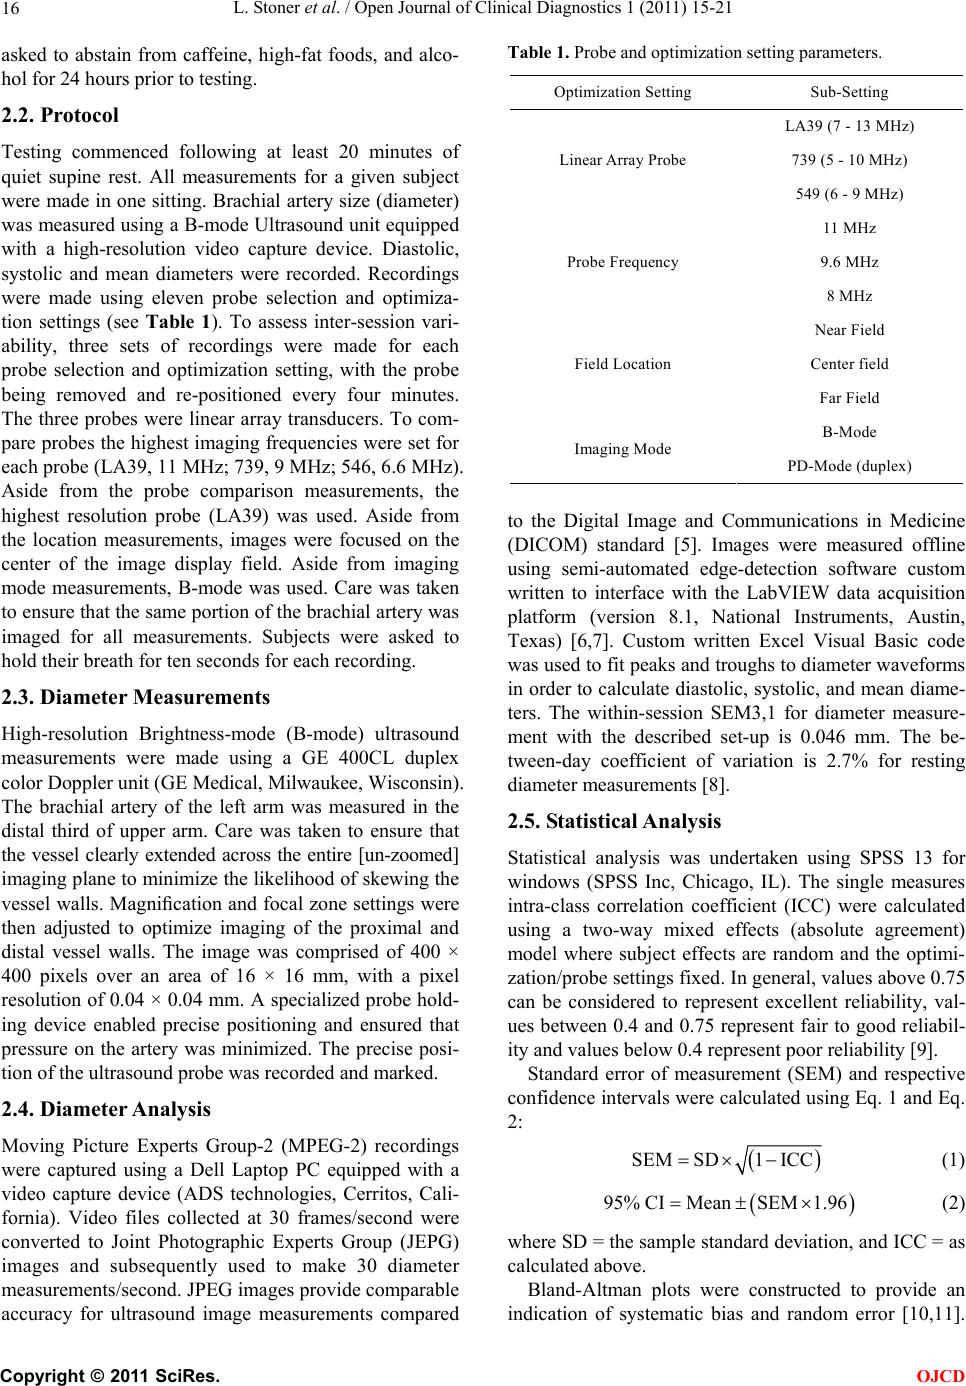 L. Stoner et al. / Open Journal of Clinical Diagnostics 1 (2011) 15-21 16 asked to abstain from caffeine, high-fat foods, and alco- hol for 24 hours prior to testing. 2.2. Protocol Testing commenced following at least 20 minutes of quiet supine rest. All measurements for a given subject were made in one sitting. Brachial artery size (diameter) was measured using a B-mode Ultrasound unit equipped with a high-resolution video capture device. Diastolic, systolic and mean diameters were recorded. Recordings were made using eleven probe selection and optimiza- tion settings (see Table 1). To assess inter-session vari- ability, three sets of recordings were made for each probe selection and optimization setting, with the probe being removed and re-positioned every four minutes. The three probes were linear array transducers. To com- pare probes the highest imaging frequencies were set for each probe (LA39, 11 MHz; 739, 9 MHz; 546, 6.6 MHz). Aside from the probe comparison measurements, the highest resolution probe (LA39) was used. Aside from the location measurements, images were focused on the center of the image display field. Aside from imaging mode measurements, B-mode was used. Care was taken to ensure that the same portion of the brachial artery was imaged for all measurements. Subjects were asked to hold their breath for ten seconds for each recording. 2.3. Diameter Measurements High-resolution Brightness-mode (B-mode) ultrasound measurements were made using a GE 400CL duplex color Doppler unit (GE Medical, Milwaukee, Wisconsin). The brachial artery of the left arm was measured in the distal third of upper arm. Care was taken to ensure that the vessel clearly extended across the entire [un-zoomed] imaging plane to minimize the likelihood of skewing the vessel walls. Magnification and focal zone settings were then adjusted to optimize imaging of the proximal and distal vessel walls. The image was comprised of 400 × 400 pixels over an area of 16 × 16 mm, with a pixel resolution of 0.04 × 0.04 mm. A specialized probe hold- ing device enabled precise positioning and ensured that pressure on the artery was minimized. The precise posi- tion of the ultrasound probe was recorded and marked. 2.4. Diameter Analysis Moving Picture Experts Group-2 (MPEG-2) recordings were captured using a Dell Laptop PC equipped with a video capture device (ADS technologies, Cerritos, Cali- fornia). Video files collected at 30 frames/second were converted to Joint Photographic Experts Group (JEPG) images and subsequently used to make 30 diameter measurements/second. JPEG images provide comparable accuracy for ultrasound image measurements compared Table 1. Probe and optimization setting parameters. Optimization Setting Sub-Setting LA39 (7 - 13 MHz) 739 (5 - 10 MHz) Linear Array Probe 549 (6 - 9 MHz) 11 MHz 9.6 MHz Probe Frequency 8 MHz Near Field Center field Field Location Far Field B-Mode Imaging Mode PD-Mode (duplex) to the Digital Image and Communications in Medicine (DICOM) standard [5]. Images were measured offline using semi-automated edge-detection software custom written to interface with the LabVIEW data acquisition platform (version 8.1, National Instruments, Austin, Texas) [6,7]. Custom written Excel Visual Basic code was used to fit peaks and troughs to diameter waveforms in order to calculate diastolic, systolic, and mean diame- ters. The within-session SEM3,1 for diameter measure- ment with the described set-up is 0.046 mm. The be- tween-day coefficient of variation is 2.7% for resting diameter measurements [8]. 2.5. Statistical Analysis Statistical analysis was undertaken using SPSS 13 for windows (SPSS Inc, Chicago, IL). The single measures intra-class correlation coefficient (ICC) were calculated using a two-way mixed effects (absolute agreement) model where subject effects are random and the optimi- zation/probe settings fixed. In general, values above 0.75 can be considered to represent excellent reliability, val- ues between 0.4 and 0.75 represent fair to good reliabil- ity and values below 0.4 represent poor reliability [9]. Standard error of measurement (SEM) and respective confidence intervals were calculated using Eq. 1 and Eq. 2: SEMSD1 ICC (1) 95% CIMeanSEM1.96 (2) where SD = the sample standard deviation, and ICC = as calculated above. Bland-Altman plots were constructed to provide an indication of systematic bias and random error [10,11]. C opyright © 2011 SciRes. OJCD 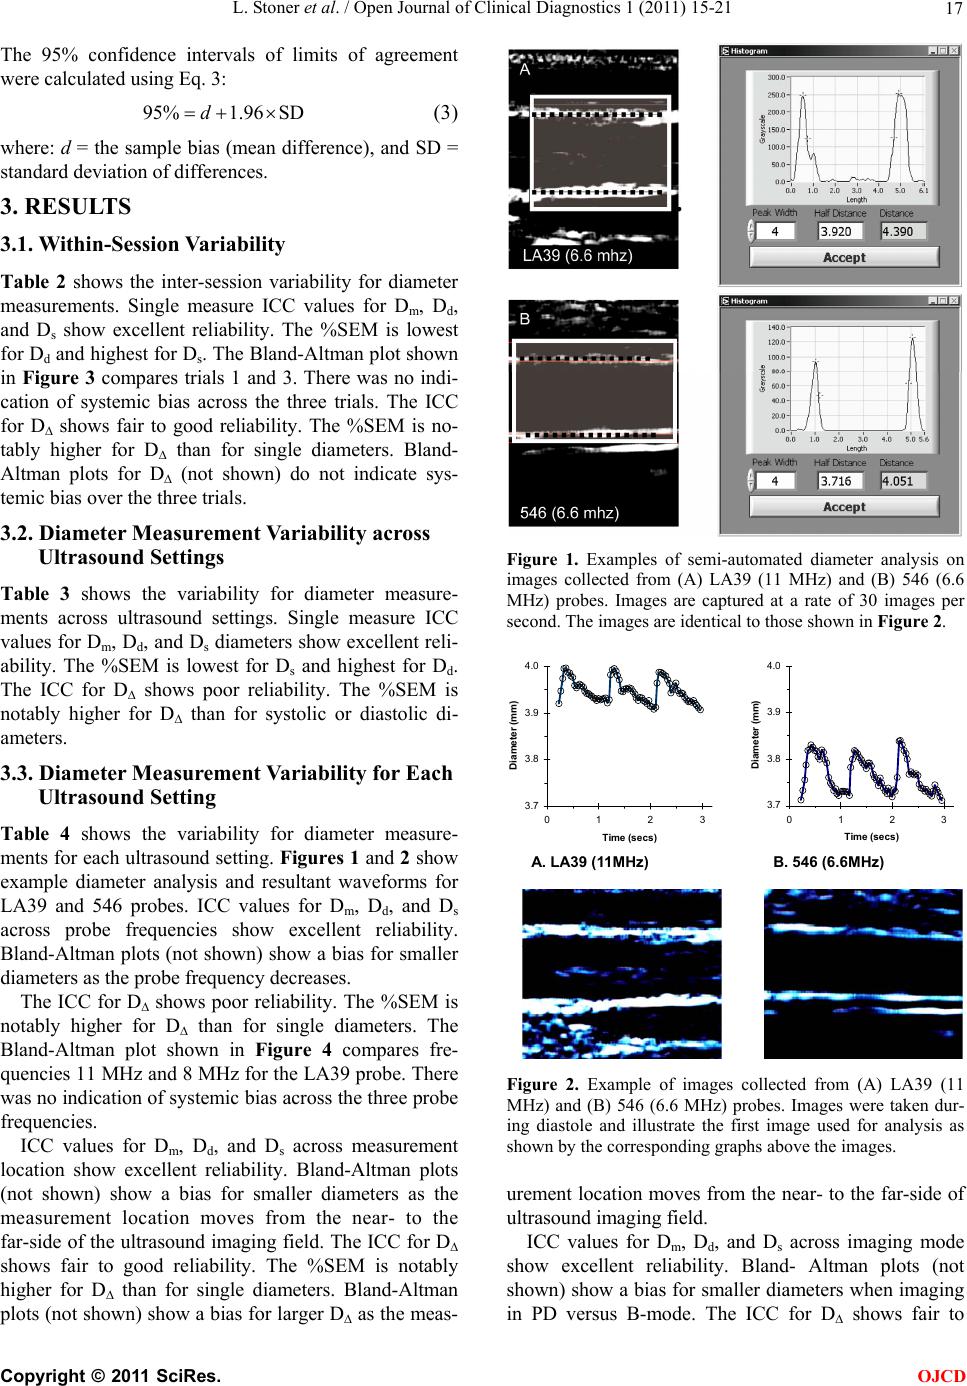 L. Stoner et al. / Open Journal of Clinical Diagnostics 1 (2011) 15-21 17 The 95% confidence intervals of limits of agreement were calculated using Eq. 3: 95%1.96 SDd (3) where: d = the sample bias (mean difference), and SD = standard deviation of differences. 3. RESULTS 3.1. W ithin-Ses sion Va riability Table 2 shows the inter-session variability for diameter measurements. Single measure ICC values for Dm, Dd, and Ds show excellent reliability. The %SEM is lowest for Dd and highest for Ds. The Bland-Altman plot shown in Figure 3 compares trials 1 and 3. There was no indi- cation of systemic bias across the three trials. The ICC for D∆ shows fair to good reliability. The %SEM is no- tably higher for D∆ than for single diameters. Bland- Altman plots for D∆ (not shown) do not indicate sys- temic bias over the three trials. 3.2. Diameter Measurement Variability across Ultrasound Settings Table 3 shows the variability for diameter measure- ments across ultrasound settings. Single measure ICC values for Dm, Dd, and Ds diameters show excellent reli- ability. The %SEM is lowest for Ds and highest for Dd. The ICC for D∆ shows poor reliability. The %SEM is notably higher for D∆ than for systolic or diastolic di- ameters. 3.3. Diameter Measurement Variability for Each Ultrasound Setting Table 4 shows the variability for diameter measure- ments for each ultrasound setting. Figures 1 and 2 show example diameter analysis and resultant waveforms for LA39 and 546 probes. ICC values for Dm, Dd, and Ds across probe frequencies show excellent reliability. Bland-Altman plots (not shown) show a bias for smaller diameters as the probe frequency decreases. The ICC for D∆ shows poor reliability. The %SEM is notably higher for D∆ than for single diameters. The Bland-Altman plot shown in Figure 4 compares fre- quencies 11 MHz and 8 MHz for the LA39 probe. There was no indication of systemic bias across the three probe frequencies. ICC values for Dm, Dd, and Ds across measurement location show excellent reliability. Bland-Altman plots (not shown) show a bias for smaller diameters as the measurement location moves from the near- to the far-side of the ultrasound imaging field. The ICC for D∆ shows fair to good reliability. The %SEM is notably higher for D∆ than for single diameters. Bland-Altman plots (not shown) show a bias for larger D∆ as the meas- Figure 1. Examples of semi-automated diameter analysis on images collected from (A) LA39 (11 MHz) and (B) 546 (6.6 MHz) probes. Images are captured at a rate of 30 images per second. The images are identical to those shown in Figure 2. A. LA39 (11MHz)B. 546 (6.6MHz) 3.7 3.8 3.9 4.0 0123 Time (s ecs) Diamet er ( m m ) 3.7 3.8 3.9 4.0 0123 Time (s ecs) Diamet er ( m m ) Figure 2. Example of images collected from (A) LA39 (11 MHz) and (B) 546 (6.6 MHz) probes. Images were taken dur- ing diastole and illustrate the first image used for analysis as shown by the corresponding graphs above the images. urement location moves from the near- to the far-side of ultrasound imaging field. ICC values for Dm, Dd, and Ds across imaging mode show excellent reliability. Bland- Altman plots (not shown) show a bias for smaller diameters when imaging in PD versus B-mode. The ICC for D∆ shows fair to C opyright © 2011 SciRes. OJCD 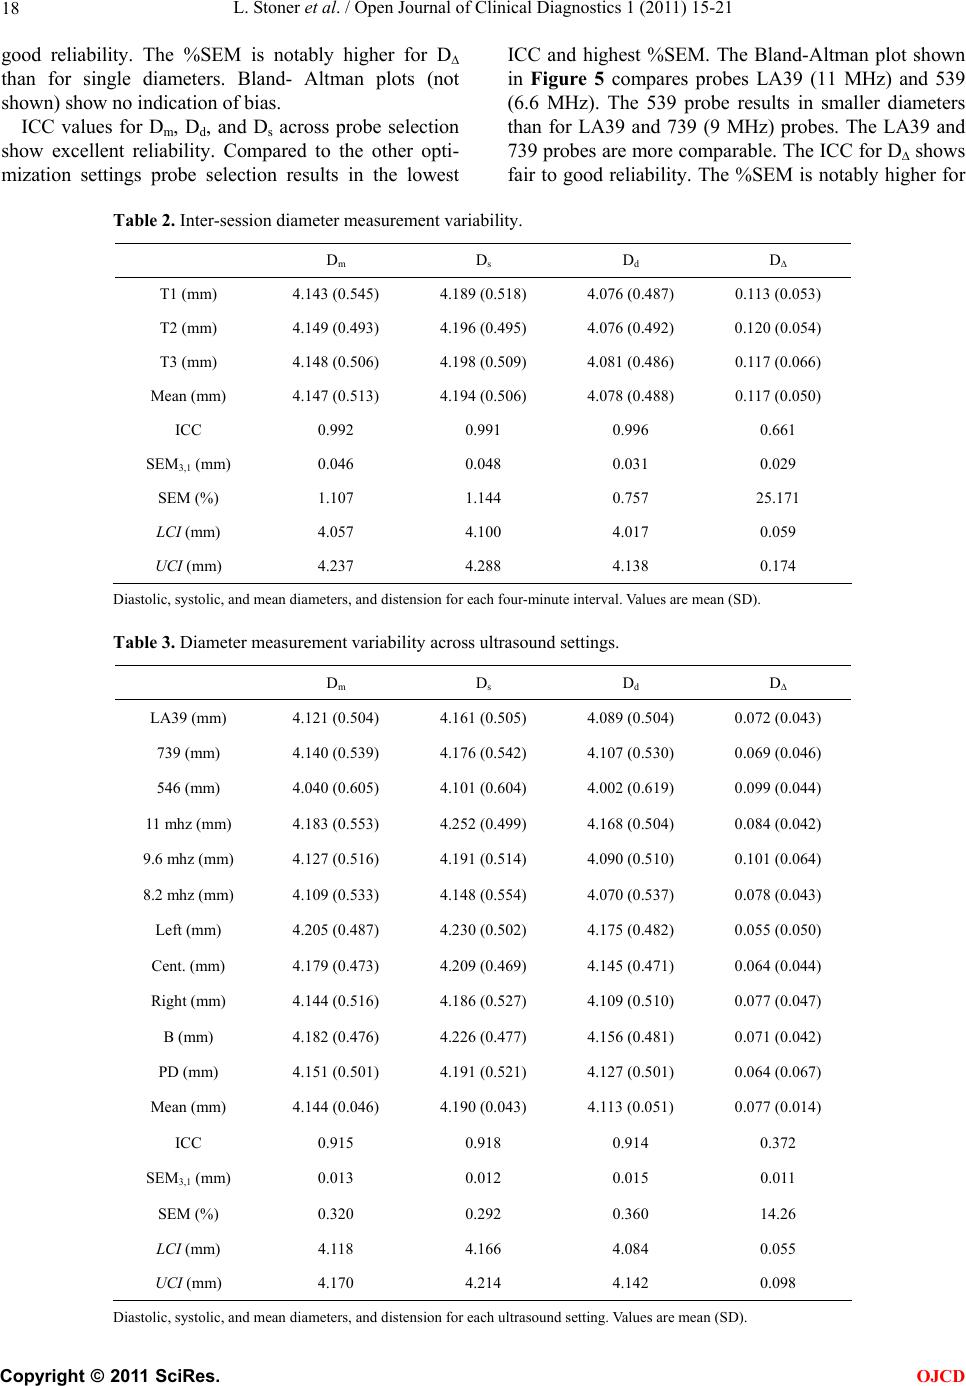 L. Stoner et al. / Open Journal of Clinical Diagnostics 1 (2011) 15-21 Copyright © 2011 SciRes. 18 OJCD good reliability. The %SEM is notably higher for D∆ than for single diameters. Bland- Altman plots (not shown) show no indication of bias. ICC values for Dm, Dd, and Ds across probe selection show excellent reliability. Compared to the other opti- mization settings probe selection results in the lowest ICC and highest %SEM. The Bland-Altman plot shown in Figure 5 compares probes LA39 (11 MHz) and 539 (6.6 MHz). The 539 probe results in smaller diameters than for LA39 and 739 (9 MHz) probes. The LA39 and 739 probes are more comparable. The ICC for D∆ shows fair to good reliability. The %SEM is notably higher for Table 2. Inter-session diameter measurement variability. Dm Ds Dd D∆ T1 (mm) 4.143 (0.545) 4.189 (0.518) 4.076 (0.487) 0.113 (0.053) T2 (mm) 4.149 (0.493) 4.196 (0.495) 4.076 (0.492) 0.120 (0.054) T3 (mm) 4.148 (0.506) 4.198 (0.509) 4.081 (0.486) 0.117 (0.066) Mean (mm) 4.147 (0.513) 4.194 (0.506) 4.078 (0.488) 0.117 (0.050) ICC 0.992 0.991 0.996 0.661 SEM3,1 (mm) 0.046 0.048 0.031 0.029 SEM (%) 1.107 1.144 0.757 25.171 LCI (mm) 4.057 4.100 4.017 0.059 UCI (mm) 4.237 4.288 4.138 0.174 Diastolic, systolic, and mean diameters, and distension for each four-minute interval. Values are mean (SD). Table 3. Diameter measurement variability across ultrasound settings. Dm Ds Dd D∆ LA39 (mm) 4.121 (0.504) 4.161 (0.505) 4.089 (0.504) 0.072 (0.043) 739 (mm) 4.140 (0.539) 4.176 (0.542) 4.107 (0.530) 0.069 (0.046) 546 (mm) 4.040 (0.605) 4.101 (0.604) 4.002 (0.619) 0.099 (0.044) 11 mhz (mm) 4.183 (0.553) 4.252 (0.499) 4.168 (0.504) 0.084 (0.042) 9.6 mhz (mm) 4.127 (0.516) 4.191 (0.514) 4.090 (0.510) 0.101 (0.064) 8.2 mhz (mm) 4.109 (0.533) 4.148 (0.554) 4.070 (0.537) 0.078 (0.043) Left (mm) 4.205 (0.487) 4.230 (0.502) 4.175 (0.482) 0.055 (0.050) Cent. (mm) 4.179 (0.473) 4.209 (0.469) 4.145 (0.471) 0.064 (0.044) Right (mm) 4.144 (0.516) 4.186 (0.527) 4.109 (0.510) 0.077 (0.047) B (mm) 4.182 (0.476) 4.226 (0.477) 4.156 (0.481) 0.071 (0.042) PD (mm) 4.151 (0.501) 4.191 (0.521) 4.127 (0.501) 0.064 (0.067) Mean (mm) 4.144 (0.046) 4.190 (0.043) 4.113 (0.051) 0.077 (0.014) ICC 0.915 0.918 0.914 0.372 SEM3,1 (mm) 0.013 0.012 0.015 0.011 SEM (%) 0.320 0.292 0.360 14.26 LCI (mm) 4.118 4.166 4.084 0.055 UCI (mm) 4.170 4.214 4.142 0.098 Diastolic, systolic, and mean diameters, and distension for each ultrasound setting. Values are mean (SD).  L. Stoner et al. / Open Journal of Clinical Diagnostics 1 (2011) 15-21 19 Table 4. Diameter measurement variability for each ultrasound setting. Mean (mm) ICC SEM3,1 (mm) SEM (%) 95%CI (mm) Dm 4.100 (0.532) 0.902 0.167 4.065 (3.774, 4.427) Ds 4.146 (0.534) 0.909 0.161 3.885 (3.830, 4.462) Dd 4.066 (0.534) 0.899 0.170 4.177 (3.733, 4.399) Probe D∆ 0.080 (0.037) 0.512 0.026 32.50 (0.029, 0.131) Dm 4.140 (0.531) 0.980 0.075 1.815 (3.992, 4.287) Ds 4.197 (0.519) 0.970 0.090 2.141 (4.021, 4.373) Dd 4.109 (0.514) 0.975 0.081 1.980 (3.950, 4.269) Freq. D∆ 0.088 (0.036) 0.255 0.031 35.26 (0.027, 0.149) Dm 4.176 (0.487) 0.967 0.088 2.118 (4.003, 4.349) Ds 4.209 (0.495) 0.973 0.081 1.934 (4.049, 4.368) Dd 4.143 (0.483) 0.966 0.089 2.148 (3.969, 4.318) Location D∆ 0.065 (0.041) 0.617 0.025 38.62 (0.016, 0.115) Dm 4.166 (0.488) 0.994 0.038 0.908 (4.092, 4.240) Ds 4.219 (0.497) 0.986 0.059 1.393 (4.103, 4.334) Dd 4.145 (0.491) 0.995 0.035 0.838 (4.077, 4.213) Display D∆ 0.073 (0.051) 0.596 0.032 43.83 (0.010, 0.136) Mean (SD) diameters for each ultrasound setting. Absolute difference (D), coefficients of variation (CV), intra-class cor- relation coefficient (ICC), and standard error of measurement (SEM) plus confidence intervals (CI) are shown. -0.20 -0.15 -0.10 -0.05 0.00 0.05 0.10 0.15 0.20 2.9 3.43.9 4.4 4.9 Average of T1 & T3 (m m ) T3 - T1 (mm ) Mean - 1.96 S D + 1 .9 6 Figure 3. Bland-Altman plot of diameter difference values (Trial 3 - Trial 1) on average diameter values ((Trial 1 + Trial 3)/2)). The mean difference, upper boundary ((mean + (SD of mean × 1.96)), and lower boundary ((mean – (SD of mean × 1.96)) are shown. D∆ than for single diameters. Bland-Altman plots (not shown) indicate bias towards larger D∆ for the 539 probe compared to the other two probes. 4. DISCUSSION This study shows that arterial diameters can be reliably -0 .12 -0 .08 -0 .04 0.00 0.04 0.08 0.12 0.00 0.04 0.08 0.12 Avg. 11mhz & 8mhz ( m m ) Avg. 8m hz - 11m hz ( m m) Mean - 1.96 SD + 1 .96 Figure 4. Bland-Altman plot of distension difference values (8 MHz – 11 MHz) on average distension values ((11 MHz + 8 MHz)/2)). The mean difference, upper boundary ((mean + (SD of mean × 1.9.6)), and lower boundary ((mean – (SD of mean × 1.96)) are shown. measured within-session, but that measurement error for arterial distention calculation is notably higher. Also, it was found that variations in ultrasound probe selection and optimization settings contribute to some measure- ment bias, though with little impact on the reliability of diameter measurements. However, variations in ultra- C opyright © 2011 SciRes. OJCD  L. Stoner et al. / Open Journal of Clinical Diagnostics 1 (2011) 15-21 20 -0 .6 -0 .4 -0 .2 0.0 0.2 0.4 0.6 2.9 3.4 3.94.4 4.9 Avg. of LA39 & 546 ( m m ) Avg. 54 6 - LA39 (mm) Mean - 1.96 SD + 1.96 SD Figure 5. Bland-Altman plot of diameter difference values (546 – LA39) on average values ((LA39 + 546)/2)). The mean difference, upper boundary ((mean + (SD of mean × 1.9.6)), and lower boundary ((mean – (SD of mean × 1.96)) are shown. sound probe selection and optimization settings notably impact the reliability of arterial distention measure- ments. 4.1. Probe Selection and Frequency Settings Across ultrasound settings we found that probe selection had the greatest impact on reliability for both diameter and arterial distention measurements. The lower fre- quency bandwidth probe (546, 6.6 MHz) resulted in bias towards smaller diameter and distention measurements. Decreasing the frequency of the LA39 probe also re- sulted in bias towards smaller diameter values, although this did not affect distension. Probe selection and frequency settings may be de- pendent on the population sample, i.e., subjects with higher subcutaneous fat will require a probe that oper- ates at a lower frequency bandwidth. Probe selection may also be dependent on the artery being assessed, i.e., deeper arteries will require a lower frequency bandwidth. Furthermore, during the course of an intervention study, optimal probe selection may be dependent on body compositional changes. This study shows that probe selection needs to be standardized for a given subject if repeated measures are to be made. Furthermore, diag- nostic meaning for population comparisons may be in- fluenced if different probes are used to compare popula- tions. 4.2. Ultrasound Imaging Mode Selection and Imaging Field Another important finding of this study pertains to the imaging display, i.e., B-mode vs. PD-mode (duplex). We found that PD-mode results in marginally smaller di- ameter and distention values. However, altering the im- aging display did not affect the reliability of these meas- urements. We found that changing the location from a near-field to far-field did not notably impact reliability, but did result in progressive bias towards smaller di- ameters. The imaging display selected will be dependent on whether simultaneous blood velocity measurements are required. Reliable measurements can be made when imaging in PD-mode, however if repeated measures are to be made, then it is advisable that the imaging display remain constant. It is also advisable that image focus is maintained central to the ultrasound field. 5. CONCLUSIONS Ultrasound can reliably measure arterial diameters and distension for the duration of a given test session. How- ever, alterations to probe selection and optimization set- tings – particularly probe selection – can have a signify- cant impact on measurement precision. Although reli- ability is often more important than absolute accuracy for serial exams, measurement differences due to varia- tions in instrument settings may, nevertheless, be inter- preted as having substantive diagnostic meaning. It is therefore recommended that ultrasound probe selection and optimization settings are standardized for repeated measurements, and preferably across subjects. REFERENCES [1] Van Popele, N.M., et al. (2001) Association between arterial stiffness and atherosclerosis: The Rotterdam study. St roke, 32, 454-460. doi:10.1161/01.STR.32.2.454 [2] Cohn, J. (1999) Vascular wall function as a risk marker for cardiovascular disease. Journal of Hypertension, 17, S41-S44. doi:10.1016/S0895-7061(01)02154-9 [3] Cohn, J.N. (2001) Arterial compliance to stratify cardio- vascular risk: More precision in therapeutic decision ma- king. American Journal of Hypertension, 14, S258-S263. doi:10.1016/S0895-7061(01)02154-9 [4] Kingwell, B.A. (2002) Large artery stiffness: Implica- tions for exercise capacity and cardiovascular risk. Cli- nical and Experimental Pharmacology and Physiology, 29, 214-217. doi:10.1046/j.1440-1681.2002.03622.x [5] Hangiandreou, N.J., et al. (2002) The effects of irreversi- ble JPEG compression on an automated algorithm for measuring carotid artery intima-media thickness from ul- trasound images. Journal of Digital Imaging, 15, 258- 260. [6] Sabatier, M.J., et al. (2006) Doppler ultrasound assess- ment of posterior tibial artery size in humans. Journal of Clinical Ultrasound, 34, 223-230. doi:10.1002/jcu.20229 [7] Stoner, L., et al. (2006) Upper versus lower extremity arterial function after spinal cord injury. Journal of Spi- nal Cord Medicine, 29, 138-146. [8] Stoner, L., et al. (2004) The relationship between blood velocity and conduit artery diameter, and the effects of smoking on vascular responsiveness. Journal of Applied Physiology, 96, 2139-2145. [9] Fleiss, J.L. (1986) The design and analysis of clinical experiments. Wiley, New York. [10] Bland, J.M. and Altman, D.G. (1999) Measuring agree- C opyright © 2011 SciRes. OJCD  L. Stoner et al. / Open Journal of Clinical Diagnostics 1 (2011) 15-21 Copyright © 2011 SciRes. 21 OJCD ment in method comparison studies. Statistical Methods in Medical Research, 8, 135-160. doi:10.1191/096228099673819272 [11] Bland, J.M. and Altman, D.G. (1986) Statistical methods for assessing agreement between two methods of clinical measurement. Lancet, 1, 307-310. doi:10.1016/S0140-6736(86)90837-8 |