

Paper Menu >>
Journal Menu >>
 American Journal of Anal yt ical Chemistry, 2011, 2, 879-884 doi:10.4236/ajac.2011.28101 Published Online December 2011 (http://www.SciRP.org/journal/ajac) Copyright © 2011 SciRes. AJAC Direct Colorimetric Detection of Hydrogen Peroxide Using 4-Nitrophenyl Boronic Acid or Its Pinacol Ester Gregory Su, Yibin Wei, Maolin Guo Department of Chemistry and Biochemistry, UMass Cranberry Health Research Center, University of Massachusetts, Dartmouth, USA E-mail: [email protected] Received October 19, 2011; revised November 23, 2011; accepted December 1, 2011 Abstract A colorimetric method for the direct determination of hydrogen peroxide in aqueous solution is described. H2O2 stoichiometrically converts 4-nitrophenyl boronic acid or 4-nitrophenyl boronic acid pinacol ester into 4-nitrophenol, which can be quantified by measuring the absorption at 400 nm in neutral or basic media. The reactions proceed fast under basic conditions and complete in 2 minutes to at pH 11 and 80˚C. The linear range for the colorimetric method extends beyond 1.0 to 40 µM H2O2, and the limit of detection is ~1.0 µM H2O2. This method offers a convenient and practical process for rapid determination of hydrogen peroxide in aqueous media. Compared to many other techniques in H2O2 detection, this process is a direct measurement of H2O2, and is relatively unaffected by the presence of various salts, metal ions and the chelator EDTA. Keywords: Hydrogen Peroxide Detection, 4-Nitrophenyl Boronic Acid, 4-Nitrophenyl Boronic Acid Pinacol Ester, 4-Nitrophenol, Colorimetric Method 1. Introduction Hydrogen peroxide is an integral part of atmospheric chemistry and biological systems. In the atmosphere, it is an oxidant that is produced from the combination of hy- droperoxyl radicals (HO2·) and their hydrated form [1]. Hydrogen peroxide is exceptionally soluble in water and it is thought to be the most efficient oxidant in the for- mation of H2SO4 from dissolved SO2 [1]. This implies that hydrogen peroxide could have some role in the acid- ity of rainwater. Hydroperoxides are significant atmos- pheric sinks and temporary reservoirs for HOx· and ROx· radicals [1,2]. In biological systems, H2O2 is pro- duced in reactions catalyzed by numerous bio-enzymes. It has also come forth as a recently recognized messenger in cellular signal transduction [3]. At high concentrations, aqueous solutions of hydrogen peroxide can irritate the eye and other organs, in addition to being a mutagen [4]. In the presence of redox active metal ions, H2O2 can be converted to OH· radicals via Fenton reactions [5]: FeII (CuI) + H2O2 → FeIII (CuII) + OH– + OH• The extremely reactive hydroxyl radical (OH, half-life 1 ns) is highly toxic to cells and contributes to neu- rodegenerative diseases and the aging process. FeIII can be reduced to FeII by cellular reductants such as hy- droascorbate (AscH–) and nictotineamide adenine dinu- cleotide (NADH), making the Fenton reactions catalytic. More recently, peroxide based explosives have been involved in some recent terrorism incidents [6]. Thus simple and sensitive peroxide detection is also important in counterterrorism efforts. Various methods have been developed for H2O2 detection [1,7-14]. The horseradish peroxidase (HRP)-catalyzed reaction is one of the most popular enzymatic assays used for determination of H2O2 [8], however, this reaction is quenched or restrained from cations, surfactants, and organic solvents, and the re- agents are expensive. Other methods for H2O2 determi- nation include HPLC, colorimetric methods, amperome- try and chemiluminescence. Titanium-based assays (Ti-PAPS reagents) were developed in the 1980’s for spectrophotometric detection of H2O2 [9]. The Fox assay was developed in 1990’s based on ferrous ion oxidation in the presence of the ferric ion indicator xylenol orange under acidic conditions [10]. Tanner and co-workers investigated the detection of H2O2 through a reaction with pyridine-2,6-dicarboxylic acid and vanadate(V) in acidic solution to form a orange-red complex chelate complex, oxo-peroxo-pyridine-2,6-dicarboxylato va- nadate (V) detectable at 432 nm [11]. Recently, Luo and 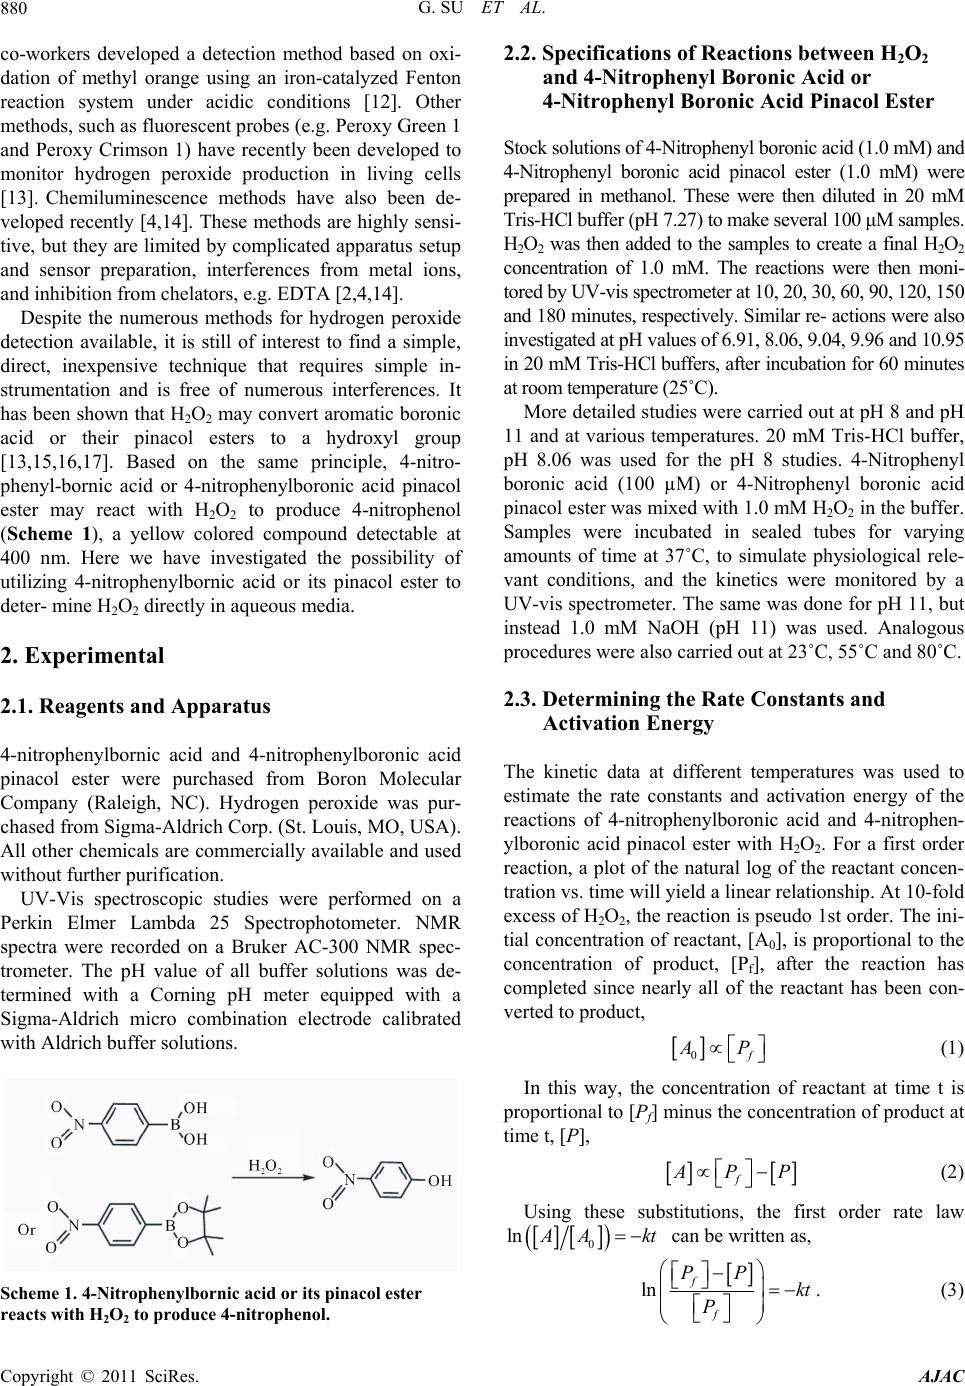 G. SU ET AL. 880 co-workers developed a detection method based on oxi- dation of methyl orange using an iron-catalyzed Fenton reaction system under acidic conditions [12]. Other methods, such as fluorescent probes (e.g. Peroxy Green 1 and Peroxy Crimson 1) have recently been developed to monitor hydrogen peroxide production in living cells [13]. Chemiluminescence methods have also been de- veloped recently [4,14]. These methods are highly sensi- tive, but they are limited by complicated apparatus setup and sensor preparation, interferences from metal ions, and inhibition from chelators, e.g. EDTA [2,4,14]. Despite the numerous methods for hydrogen peroxide detection available, it is still of interest to find a simple, direct, inexpensive technique that requires simple in- strumentation and is free of numerous interferences. It has been shown that H2O2 may convert aromatic boronic acid or their pinacol esters to a hydroxyl group [13,15,16,17]. Based on the same principle, 4-nitro- phenyl-bornic acid or 4-nitrophenylboronic acid pinacol ester may react with H2O2 to produce 4-nitrophenol (Scheme 1), a yellow colored compound detectable at 400 nm. Here we have investigated the possibility of utilizing 4-nitrophenylbornic acid or its pinacol ester to deter- mine H2O2 directly in aqueous media. 2. Experimental 2.1. Reagents and Apparatus 4-nitrophenylbornic acid and 4-nitrophenylboronic acid pinacol ester were purchased from Boron Molecular Company (Raleigh, NC). Hydrogen peroxide was pur- chased from Sigma-Aldrich Corp. (St. Louis, MO, USA). All other chemicals are commercially available and used without further purification. UV-Vis spectroscopic studies were performed on a Perkin Elmer Lambda 25 Spectrophotometer. NMR spectra were recorded on a Bruker AC-300 NMR spec- trometer. The pH value of all buffer solutions was de- termined with a Corning pH meter equipped with a Sigma-Aldrich micro combination electrode calibrated with Aldrich buffer solutions. Scheme 1. 4-Nitrophenylbornic acid or its pinacol ester reacts with H2O2 to produce 4-nitrophenol. 2.2. Specifications of Reactions between H2O2 and 4-Nitrophenyl Boronic Acid or 4-Nitrophenyl Boronic Acid Pinacol Ester Stock solutions of 4-Nitrophenyl boronic acid (1.0 mM) and 4-Nitrophenyl boronic acid pinacol ester (1.0 mM) were prepared in methanol. These were then diluted in 20 mM Tris-HCl buffer (pH 7.27) to make several 100 μM samples. H2O2 was then added to the samples to create a final H2O2 concentration of 1.0 mM. The reactions were then moni- tored by UV-vis spectrometer at 10, 20, 30, 60, 90, 120, 150 and 180 minutes, respectively. Similar re- actions were also investigated at pH values of 6.91, 8.06, 9.04, 9.96 and 10.95 in 20 mM Tris-HCl buffers, after incubation for 60 minutes at room temperature (25˚C). More detailed studies were carried out at pH 8 and pH 11 and at various temperatures. 20 mM Tris-HCl buffer, pH 8.06 was used for the pH 8 studies. 4-Nitrophenyl boronic acid (100 µM) or 4-Nitrophenyl boronic acid pinacol ester was mixed with 1.0 mM H2O2 in the buffer. Samples were incubated in sealed tubes for varying amounts of time at 37˚C, to simulate physiological rele- vant conditions, and the kinetics were monitored by a UV-vis spectrometer. The same was done for pH 11, but instead 1.0 mM NaOH (pH 11) was used. Analogous procedures were also carried out at 23˚C, 55˚C and 80˚C. 2.3. Determining the Rate Constants and Activation Energy The kinetic data at different temperatures was used to estimate the rate constants and activation energy of the reactions of 4-nitrophenylboronic acid and 4-nitrophen- ylboronic acid pinacol ester with H2O2. For a first order reaction, a plot of the natural log of the reactant concen- tration vs. time will yield a linear relationship. At 10-fold excess of H2O2, the reaction is pseudo 1st order. The ini- tial concentration of reactant, [A0], is proportional to the concentration of product, [Pf], after the reaction has completed since nearly all of the reactant has been con- verted to product, 0 f A P (1) In this way, the concentration of reactant at time t is proportional to [Pf] minus the concentration of product at time t, [P], f A PP (2) Using these substitutions, the first order rate law 0 ln A Akt can be written as, ln f f PP kt P . (3) Copyright © 2011 SciRes. AJAC  G. SU ET AL.881 The concentration of product is comparative to the absorbance, so [Pf] can be related to the absorbance of the highest peak of the product at 400 nm, when the re- action has reached completion. The [P] values can be interpreted as the absorbance at 400 nm for the interme- diate times that is all the peaks below the highest. In this way, the rate constants for the reactions at different tem- peratures can be determined by plotting ln f PPP f vs time, where the rate constant k is the negative of the resulting slope. 2.4. Standard Curves Standard curves for H2O2 were determined for both 4-Nitrophenyl boronic acid and 4-Nitrophenyl boronic acid pinacol ester at pH 8 and pH 11. In each case, the concentration of boronic compounds was 50 μM, and the H2O2 concentrations were 0.5, 1, 2, 5, 10, 20 and 40 μM. For the trials at pH 8 (20 mM Tris-HCl buffer, pH 8.06), the samples were incubated at 37˚C for 2 hours and ab- sorbances at 400 nm were recorded. For the pH 11 tests, the samples were incubated in 1 mM NaOH at 80˚C for 10 minutes and the absorptions at 400 nm were recorded. 2.5. Interferences from Salts, Reducing Agents, Metal Ions, and Chelators The effect of varying concentrations of several salts, NaCl, K2HPO4, K2SO4 and KNO3, on the H2O2 detection was tested. The samples, each containing 50 μM of 4-Nitrophenyl boronic acid (or 4-Nitrophenyl boronic acid pinacol ester), 40 μM of H2O2 and a salt concentra- tion (0 μM, 10 μM, 100 μM, 500 μM, 1 mM or 10 mM) were incubated at pH 11 (1 mM NaOH) and 80˚C for 10 min- utes, after which, the absorbance at 400 nm was recorded. A similar procedure was used to test the interference from several metal ions, ascorbic acid, glutathione (GSH) and the chelator EDTA. 3. Results and Discussion 3.1. Kinetics of the Reactions of 4-Nitrophenyl Boronic Acid or Its Pinacol Ester with H2O2 The reaction of 4-nitrophenylboronic acid or 4-nitro- phenylboronic acid pinacol ester with H2O2 were moni- tored by UV-vis spectroscopy in 100 μM solution, pH 7.27. The 4-nitrophenylboronic acid and 4-nitrophenyl- boronic acid pinacol ester are colorless and displayed absorption (λmax at 290 nm) in UV region only. After the addition of H2O2, the original absorption peak for 4-ni- trophenylboronic acid pinacol ester (Figure 1) decreased intensity while a new peak centered at 405 nm appeared Figure 1. Kinetics of UV-vis spectra of 100 μM 4-Nitrophenyl boronicacid pinacol ester reaction with H2O2 (20 mM Tris-HCl buffer, pH 8.06, 37˚C). and increased in intensity with an isobestic point at 330 nm, and the color of the solution changed from colorless to yellow, implying the formation of 4-nitrophenol. The rate constant was determined to be 0.0586 s–1. Similar changes were observed for 4-nitro-phenylboronic acid. To investigate whether the conversion is a clean chemistry and to confirm that 4-nitrophenol is the prod- uct, the reaction processes were monitored by 1H NMR spectroscopy. As shown in Figure 2, when H2O2 was added to 4-nitrophenyl boronic acid, the original proton resonances at 8.19 and 8.21 ppm (doublet, meta) and 7.90 ppm (broad, ortho) decreased in intensity with the later split into two peaks at 7.92 and 7.95 ppm. The split- ting is probably due to the breaking of the hydrogen bonds in the 4-nitrophenyl boronic acid dimer [18]. Meanwhile, new peaks characteristic for 4-nitrophenol emerged and grew in intensity, at the expense of the resonances of the 4-nitrophenyl boronic acid. After 240 min, the 1H NMR spectrum (Figure 2(c)) is identical to that of the 4-nitrophenol standard (Figure 2(d)). This clearly confirmed that 4-nitrophenyl boronic acid had been cleanly converted to 4-nitrophenol. Similar experi- ments performed with 4-nitrophenyl boronic acid pinacol ester demonstrated a clean conversion to 4-nitrophenol by H2O2 but at a slower rate. 3.2. pH/Temperature Dependence The pH dependence of the conversion of the boronic acid compounds by H2O2 was investigated over a pH range of 6.9 to 11.8 after incubation at room temperature (25˚C) for 60 min. As shown in Figure 3, improved conversion was achieved at more basic pH values with the best pH at ~11 for both the 4-nitrophenyl boronic acid and its pina- col ester. Copyright © 2011 SciRes. AJAC  G. SU ET AL. 882 Figure 2. 1H-NMR spectra of (a) 10 mM 4-Nitrophenyl boronic acid in d4-MeOH, the mixture of 4-Nitrophenyl boronicacid (10 mM) and H2O2 (100 mM) incubated for 60 min (b) and 240 min (c), and (d) 10 mM 4-nitrophenol in d4-MeOH. Figure 3. pH profile of absorbance (400 nm) of the reaction of H2O2 incubated with 4-Nitrophenyl boronic acid or its pinacol ester (100 μM) for 60 min. The effect of temperature was also investigated. As expected, the reaction rate increased with increasing temperature. At pH 11 and 37˚C, the reaction reached completion in 60 minutes, about half the time as the room temperature and pH 8 reaction. Increasing the temperature further to 55˚C decreased reaction time to about 15 minutes. And at 80˚C, the reaction finished within 2 minutes. The rate constants for 4-nitrophenyl- boronic acid and its pinacol ester at pH 11 and varying temperatures were determined and shown in Table 1. Table 1. Rate constants for 4-nitrophenyl boronic acid and its pinacol ester at pH 11 (s–1). 25˚C 37˚C 55˚C 80˚C 4-Nitrophenylboronic acid 0.0315 0.1318 0.2977ND 4-Nitrophenylboronic acid pinacol ester 0.0586 0.144 0.32920.7155 The rate constants at different temperatures were used to estimate the activation energy. According to the Ar- rhenius equation, ea E RT kA [19], a plot of ln(k) vs. 1/T will give a linear plot with slope of a ER. The activation energies at pH 11 were calculated to be 82.4 kJ/mol and 59.5 kJ/mol for 4-nitrophenylboronic acid pinacol ester and 4-nitrophenylboronic acid, respectively. 3.3. Standard Curves and Detection Limit Experiments were performed with 50 μM 4-Nitrophenyl boronic acid or the boronic acid ester and a range of H2O2 concentrations from 0.5 μM to 40 μM. A linear trend was observed for H2O2 concentration in the range of 1 μM to 40 μM (Figure 4), indicating reliable detec- tion. Similar tests were carried out for physiological conditions, pH 8 and 37˚C, which exhibited comparable results. The 4-Nitrophenyl boronic acid reaction with H2O2 displayed the potential to be accurate to a [H2O2] of about 1 μM. 3.4. Interference It is of interest to study the ability of 4-Nitrophenyl bo- ronic acid or its pinacol ester to maintain accurate detec- tion of H2O2 in the presence of other compounds. Several Figure 4. Standard curves of detection of H2O2 with (a) 50 μM 4-Nitrophenyl boronic acid pinacol ester at pH 11, 37˚C or with (b) 50 μM 4-Nitrophenyl boronic acid at pH 8.0, 37˚C. Copyright © 2011 SciRes. AJAC 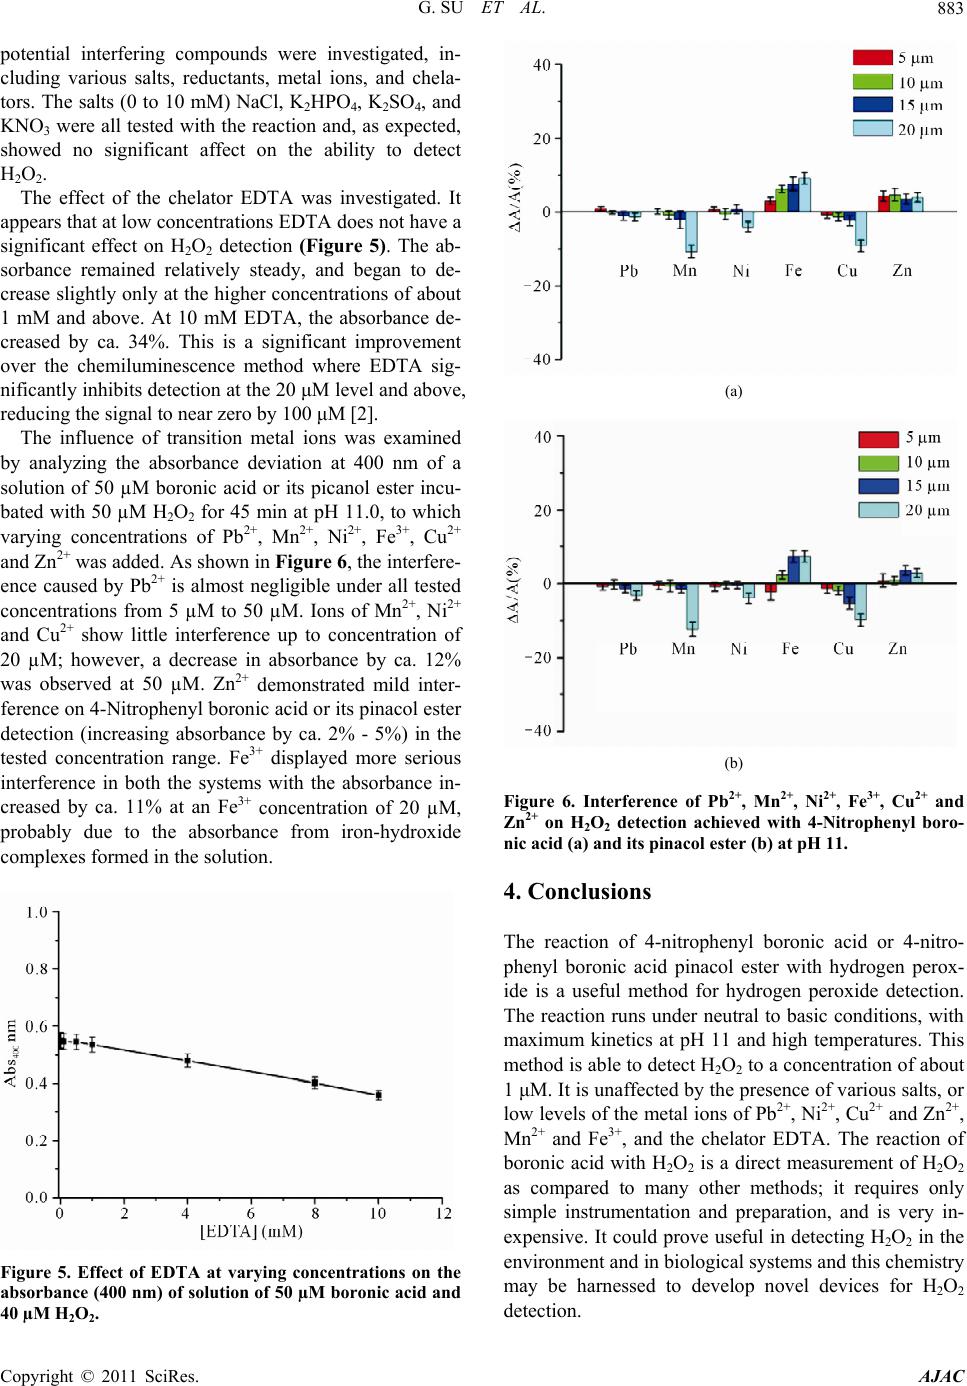 G. SU ET AL.883 potential interfering compounds were investigated, in- cluding various salts, reductants, metal ions, and chela- tors. The salts (0 to 10 mM) NaCl, K2HPO4, K2SO4, and KNO3 were all tested with the reaction and, as expected, showed no significant affect on the ability to detect H2O2. The effect of the chelator EDTA was investigated. It appears that at low concentrations EDTA does not have a significant effect on H2O2 detection (Figure 5). The ab- sorbance remained relatively steady, and began to de- crease slightly only at the higher concentrations of about 1 mM and above. At 10 mM EDTA, the absorbance de- creased by ca. 34%. This is a significant improvement over the chemiluminescence method where EDTA sig- nificantly inhibits detection at the 20 μM level and above, reducing the signal to near zero by 100 μM [2]. The influence of transition metal ions was examined by analyzing the absorbance deviation at 400 nm of a solution of 50 µM boronic acid or its picanol ester incu- bated with 50 µM H2O2 for 45 min at pH 11.0, to which varying concentrations of Pb2+, Mn2+, Ni2+ , Fe3+, Cu2+ and Zn2+ was added. As shown in Figure 6, the interfere- ence caused by Pb2+ is almost negligible under all tested concentrations from 5 µM to 50 µM. Ions of Mn2+, Ni2+ and Cu2+ show little interference up to concentration of 20 µM; however, a decrease in absorbance by ca. 12% was observed at 50 µM. Zn2+ demonstrated mild inter- ference on 4-Nitrophenyl boronic acid or its pinacol ester detection (increasing absorbance by ca. 2% - 5%) in the tested concentration range. Fe3+ displayed more serious interference in both the systems with the absorbance in- creased by ca. 11% at an Fe3+ concentration of 20 µM, probably due to the absorbance from iron-hydroxide complexes formed in the solution. Figure 5. Effect of EDTA at varying concentrations on the absorbance (400 nm) of solution of 50 µM boronic acid and 40 µM H2O2. (a) (b) Figure 6. Interference of Pb2+, Mn2+, Ni2+, Fe3+, Cu2+ and Zn2+ on H2O2 detection achieved with 4-Nitrophenyl boro- nic acid (a) and its pinacol ester (b) at pH 11. 4. Conclusions The reaction of 4-nitrophenyl boronic acid or 4-nitro- phenyl boronic acid pinacol ester with hydrogen perox- ide is a useful method for hydrogen peroxide detection. The reaction runs under neutral to basic conditions, with maximum kinetics at pH 11 and high temperatures. This method is able to detect H2O2 to a concentration of about 1 μM. It is unaffected by the presence of various salts, or low levels of the metal ions of Pb2+, Ni2+, Cu2+ and Zn2+, Mn2+ and Fe3+, and the chelator EDTA. The reaction of boronic acid with H2O2 is a direct measurement of H2O2 as compared to many other methods; it requires only simple instrumentation and preparation, and is very in- expensive. It could prove useful in detecting H2O2 in the environment and in biological systems and this chemistry may be harnessed to develop novel devices for H2O2 detection. Copyright © 2011 SciRes. AJAC 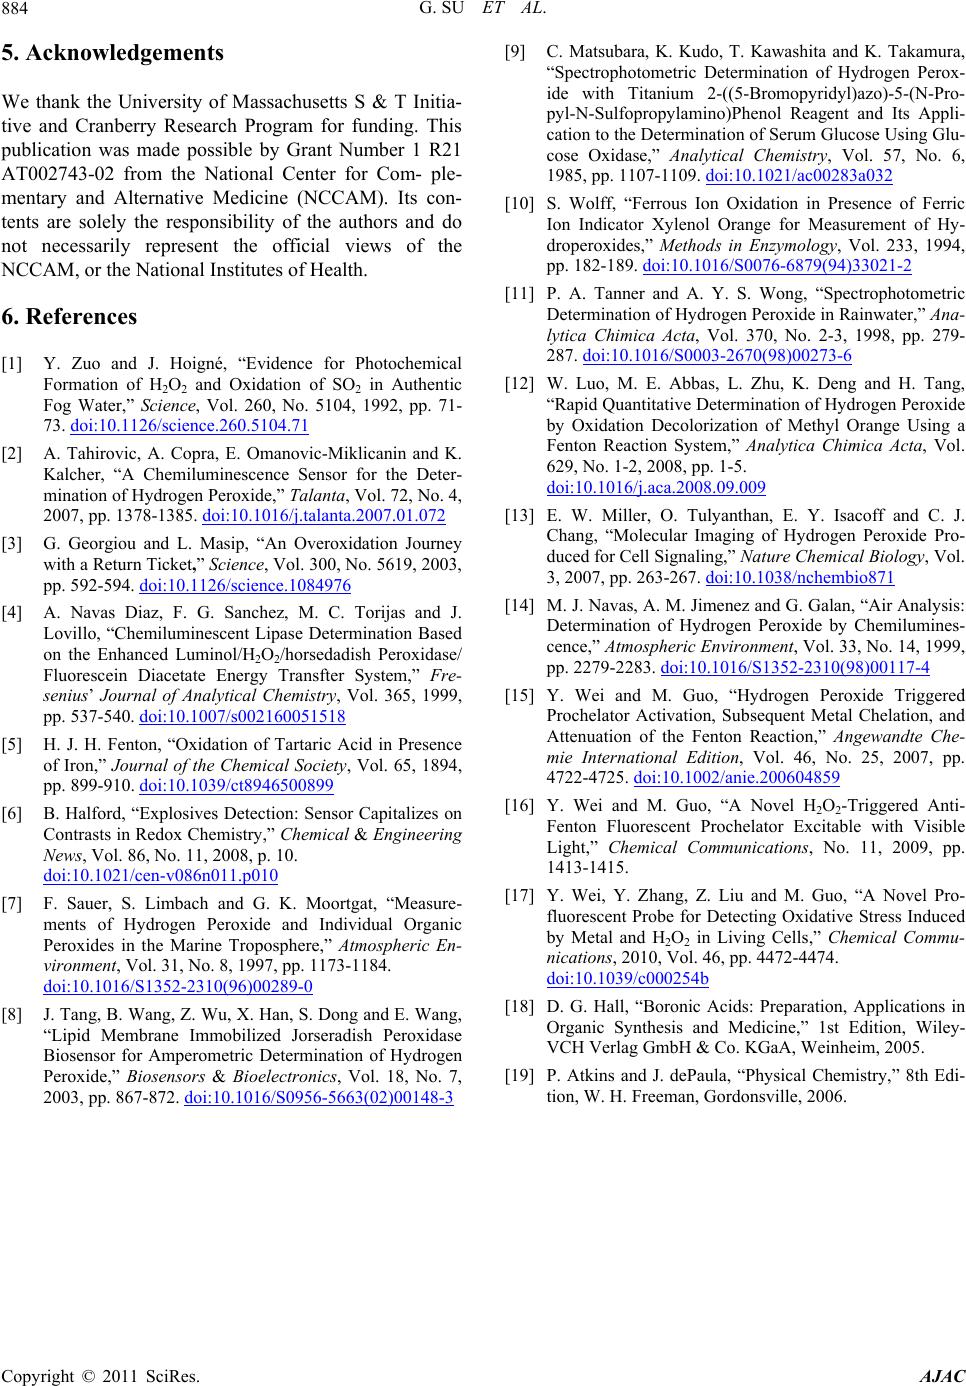 G. SU ET AL. Copyright © 2011 SciRes. AJAC 884 5. Acknowledgements We thank the University of Massachusetts S & T Initia- tive and Cranberry Research Program for funding. This publication was made possible by Grant Number 1 R21 AT002743-02 from the National Center for Com- ple- mentary and Alternative Medicine (NCCAM). Its con- tents are solely the responsibility of the authors and do not necessarily represent the official views of the NCCAM, or the National Institutes of Health. 6. References [1] Y. Zuo and J. Hoigné, “Evidence for Photochemical Formation of H2O2 and Oxidation of SO2 in Authentic Fog Water,” Science, Vol. 260, No. 5104, 1992, pp. 71- 73. doi:10.1126/science.260.5104.71 [2] A. Tahirovic, A. Copra, E. Omanovic-Miklicanin and K. Kalcher, “A Chemiluminescence Sensor for the Deter- mination of Hydrogen Peroxide,” Talanta, Vol. 72, No. 4, 2007, pp. 1378-1385. doi:10.1016/j.talanta.2007.01.072 [3] G. Georgiou and L. Masip, “An Overoxidation Journey with a Return Ticket,” Science, Vol. 300, No. 5619, 2003, pp. 592-594. doi:10.1126/science.1084976 [4] A. Navas Diaz, F. G. Sanchez, M. C. Torijas and J. Lovillo, “Chemiluminescent Lipase Determination Based on the Enhanced Luminol/H2O2/horsedadish Peroxidase/ Fluorescein Diacetate Energy Transfter System,” Fre- senius’ Journal of Analytical Chemistry, Vol. 365, 1999, pp. 537-540. doi:10.1007/s002160051518 [5] H. J. H. Fenton, “Oxidation of Tartaric Acid in Presence of Iron,” Journal of the Chemical Society, Vol. 65, 1894, pp. 899-910. doi:10.1039/ct8946500899 [6] B. Halford, “Explosives Detection: Sensor Capitalizes on Contrasts in Redox Chemistry,” Chemical & Engineering News, Vol. 86, No. 11, 2008, p. 10. doi:10.1021/cen-v086n011.p010 [7] F. Sauer, S. Limbach and G. K. Moortgat, “Measure- ments of Hydrogen Peroxide and Individual Organic Peroxides in the Marine Troposphere,” Atmospheric En- vironment, Vol. 31, No. 8, 1997, pp. 1173-1184. doi:10.1016/S1352-2310(96)00289-0 [8] J. Tang, B. Wang, Z. Wu, X. Han, S. Dong and E. Wang, “Lipid Membrane Immobilized Jorseradish Peroxidase Biosensor for Amperometric Determination of Hydrogen Peroxide,” Biosensors & Bioelectronics, Vol. 18, No. 7, 2003, pp. 867-872. doi:10.1016/S0956-5663(02)00148-3 [9] C. Matsubara, K. Kudo, T. Kawashita and K. Takamura, “Spectrophotometric Determination of Hydrogen Perox- ide with Titanium 2-((5-Bromopyridyl)azo)-5-(N-Pro- pyl-N-Sulfopropylamino)Phenol Reagent and Its Appli- cation to the Determination of Serum Glucose Using Glu- cose Oxidase,” Analytical Chemistry, Vol. 57, No. 6, 1985, pp. 1107-1109. doi:10.1021/ac00283a032 [10] S. Wolff, “Ferrous Ion Oxidation in Presence of Ferric Ion Indicator Xylenol Orange for Measurement of Hy- droperoxides,” Methods in Enzymology, Vol. 233, 1994, pp. 182-189. doi:10.1016/S0076-6879(94)33021-2 [11] P. A. Tanner and A. Y. S. Wong, “Spectrophotometric Determination of Hydrogen Peroxide in Rainwater,” Ana- lytica Chimica Acta, Vol. 370, No. 2-3, 1998, pp. 279- 287. doi:10.1016/S0003-2670(98)00273-6 [12] W. Luo, M. E. Abbas, L. Zhu, K. Deng and H. Tang, “Rapid Quantitative Determination of Hydrogen Peroxide by Oxidation Decolorization of Methyl Orange Using a Fenton Reaction System,” Analytica Chimica Acta, Vol. 629, No. 1-2, 2008, pp. 1-5. doi:10.1016/j.aca.2008.09.009 [13] E. W. Miller, O. Tulyanthan, E. Y. Isacoff and C. J. Chang, “Molecular Imaging of Hydrogen Peroxide Pro- duced for Cell Signaling,” Nature Chemical Biology, Vol. 3, 2007, pp. 263-267. doi:10.1038/nchembio871 [14] M. J. Navas, A. M. Jimenez and G. Galan, “Air Analysis: Determination of Hydrogen Peroxide by Chemilumines- cence,” Atmospheric Environment, Vol. 33, No. 14, 1999, pp. 2279-2283. doi:10.1016/S1352-2310(98)00117-4 [15] Y. Wei and M. Guo, “Hydrogen Peroxide Triggered Prochelator Activation, Subsequent Metal Chelation, and Attenuation of the Fenton Reaction,” Angewandte Che- mie International Edition, Vol. 46, No. 25, 2007, pp. 4722-4725. doi:10.1002/anie.200604859 [16] Y. Wei and M. Guo, “A Novel H2O2-Triggered Anti- Fenton Fluorescent Prochelator Excitable with Visible Light,” Chemical Communications, No. 11, 2009, pp. 1413-1415. [17] Y. Wei, Y. Zhang, Z. Liu and M. Guo, “A Novel Pro- fluorescent Probe for Detecting Oxidative Stress Induced by Metal and H2O2 in Living Cells,” Chemical Commu- nications, 2010, Vol. 46, pp. 4472-4474. doi:10.1039/c000254b [18] D. G. Hall, “Boronic Acids: Preparation, Applications in Organic Synthesis and Medicine,” 1st Edition, Wiley- VCH Verlag GmbH & Co. KGaA, Weinheim, 2005. [19] P. Atkins and J. dePaula, “Physical Chemistry,” 8th Edi- tion, W. H. Freeman, Gordonsville, 2006. |