

Paper Menu >>
Journal Menu >>
 American Journal of Anal yt ical Chemistry, 2011, 2, 944-952 doi:10.4236/ajac.2011.28110 Published Online December 2011 (http://www.SciRP.org/journal/ajac) Copyright © 2011 SciRes. AJAC Determination of Camylofin Dihydrochloride and Nimesulide in Pharmaceutical Preparation by Gas Chromatography Rajeev Kumar R. Singh1,2, Manapragada V. Rathnam1, Sangeeta J. Singh2, Raju V. K. Vegesna2 1Department of Chemistry, B. N. Bandodkar C oll ege of Science, Thane, India 2Versapharm Inco rp orated, Warminister, USA E-mail: [email protected] Received February 27, 20 1 1; revised May 22, 2011; accepted June 1, 2011 Abstract This research paper describes si mple analytical method for determination of Camylofin dihydrochloride and Nimesulide in tablet formulation by Gas chromatography method. Benzoic acid was used as internal standard. Validation was carried out in compliance with the International Conference on Harmonization guidelines. The method utilized GC (Agilent Technologies 6890 N Network GC system with FID detector), and RTX-5 capillary column (5% diphenyl-95% dimethyl polysiloxane), 30 m × 0.53 mm, 1.5 µm as stationary phase. Helium was used as the carrier gas at a flow rate of 1.5 mL·min–1. The proposed method was validated for linearity, LOD, LOQ, accuracy, precision, ruggedness and solution stability. It can be conveniently adopted for routine quality control analysis. Keywords: Capillary Column, Gas Chromatography, Pharmaceutical Preparations, Camylofin Dihydrochloride, Nimesulide 1. Introduction Camylofin dihydrochloride is 3-methylbutyl 2-(2-diethy- laminoethylamino)-2-phenyl-acetate hydrochloride is a drug used an antispasmodic [1]. Nimesulide N-(4-Nitro- 2-phenoxyphenyl) methanesulfonamide.Nimesulide is a relatively COX-2 selective, non-steroidal anti-inflam- matory drug (NSAID) with analgesic and antipyretic properties. Its approved indications are the treatment of acute pain, the symptomatic treatment of osteoarthritis and primary dysmenorrhoea in adolescents and adults above 12 years old [2].Th e structur e of the drug is shown in Figure 1. One such combination contains 50 mg of Camylofin dihydroch loride and 100 mg of Nimesulide. The literature survey revealed that there is no method for the simultaneous determination of these compounds. There are other publications for determination of these compounds but in combination with other components by other analytical techniques like HPLC, spectropho- tometry and colorimetric [4-16].There is a GC method reported for the analysis of Camylofin dihydrochloride [17]. There are, however, no publications for simultane- ous determination of these drugs in such pharmaceutical preparation. Therefore a GC method was developed for NH O O N 2HCl Camylofin dihydrochloride ( C19H 32N 2O 2,2HCl) O NH NO 2 S O O Nimesulide (C13H12N2O5S) Figure 1. Structure of camylofin dihydrochloride and ni- mesulide. 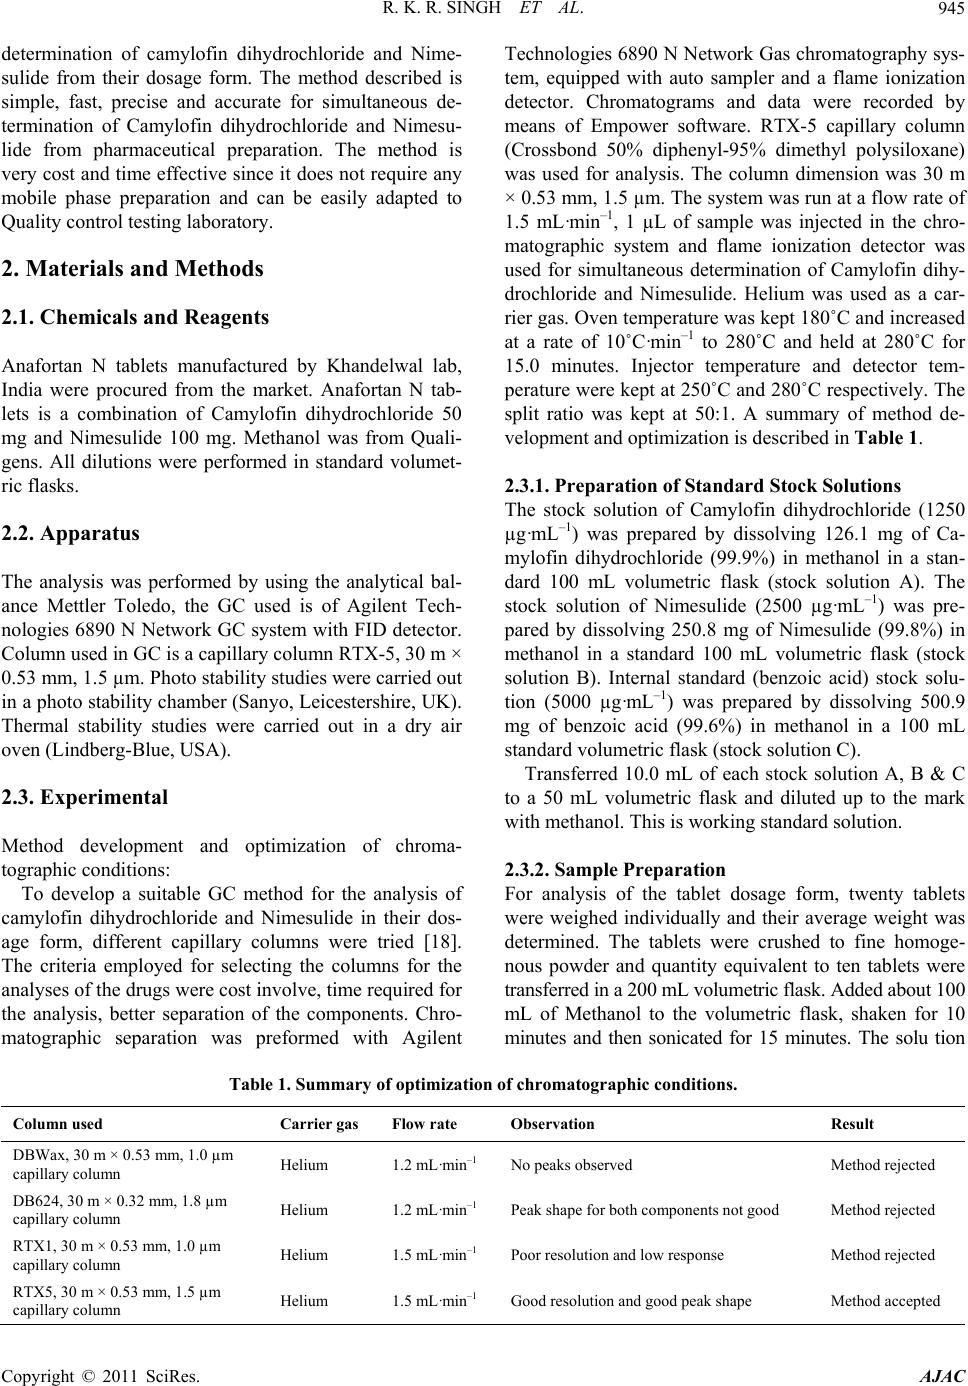 R. K. R. SINGH ET AL.945 determination of camylofin dihydrochloride and Nime- sulide from their dosage form. The method described is simple, fast, precise and accurate for simultaneous de- termination of Camylofin dihydrochloride and Nimesu- lide from pharmaceutical preparation. The method is very cost and time effective since it does not require any mobile phase preparation and can be easily adapted to Quality control testing laboratory. 2. Materials and Methods 2.1. Chemicals and Reagents Anafortan N tablets manufactured by Khandelwal lab, India were procured from the market. Anafortan N tab- lets is a combination of Camylofin dihydrochloride 50 mg and Nimesulide 100 mg. Methanol was from Quali- gens. All dilutions were performed in standard volumet- ric flasks. 2.2. Apparatus The analysis was performed by using the analytical bal- ance Mettler Toledo, the GC used is of Agilent Tech- nologies 6890 N Network GC system with FID detector. Column used in GC is a capillary column RTX-5, 30 m × 0.53 mm, 1.5 µm. Photo stability studies were carried out in a photo stability chamber (Sanyo, Leicestershire, UK). Thermal stability studies were carried out in a dry air oven (Lin dberg-Blue, USA). 2.3. Experimental Method development and optimization of chroma- tographic condition s: To develop a suitable GC method for the analysis of camylofin dihydrochloride and Nimesulide in their dos- age form, different capillary columns were tried [18]. The criteria employed for selecting the columns for the analyses of the drugs were cost involve, time required for the analysis, better separation of the components. Chro- matographic separation was preformed with Agilent Technologies 6890 N Ne twork Gas chromatography sys- tem, equipped with auto sampler and a flame ionization detector. Chromatograms and data were recorded by means of Empower software. RTX-5 capillary column (Crossbond 50% diphenyl-95% dimethyl polysiloxane) was used for analysis. The column dimension was 30 m × 0.53 mm, 1.5 µm. The system was run at a flow rate of 1.5 mL·min–1, 1 µL of sample was injected in the chro- matographic system and flame ionization detector was used for simultaneous determination of Camylofin dihy- drochloride and Nimesulide. Helium was used as a car- rier gas. Oven temperature was kept 180˚C and increased at a rate of 10˚C·min–1 to 280˚C and held at 280˚C for 15.0 minutes. Injector temperature and detector tem- perature were kept at 250˚C and 280˚C respectively. The split ratio was kept at 50:1. A summary of method de- velopment and optimization is described in Table 1. 2.3.1. Preparation of Standard Stock Solutions The stock solution of Camylofin dihydrochloride (1250 µg·mL–1) was prepared by dissolving 126.1 mg of Ca- mylofin dihydrochloride (99.9%) in methanol in a stan- dard 100 mL volumetric flask (stock solution A). The stock solution of Nimesulide (2500 µg·mL–1) was pre- pared by dissolving 250.8 mg of Nimesulide (99.8%) in methanol in a standard 100 mL volumetric flask (stock solution B). Internal standard (benzoic acid) stock solu- tion (5000 µg·mL–1) was prepared by dissolving 500.9 mg of benzoic acid (99.6%) in methanol in a 100 mL standard volumetric flask (stock solution C). Transferred 10.0 mL of each stock solution A, B & C to a 50 mL volumetric flask and diluted up to the mark with methanol. This is working standard solution. 2.3.2. Sample Preparation For analysis of the tablet dosage form, twenty tablets were weighed individually and their average weight was determined. The tablets were crushed to fine homoge- nous powder and quantity equivalent to ten tablets were transferred in a 200 mL volumetric flask. Add ed about 100 mL of Methanol to the volumetric flask, shaken for 10 minutes and then sonicated for 15 minutes. The solu tion Table 1. Summary of optimization of chromatographic conditions. Column used Carrier gas Flow rate Observation Result DBWax, 30 m × 0.53 mm, 1.0 µm capillary column Helium 1.2 mL·min–1 No peaks observed Method rejected DB624, 30 m × 0.32 mm, 1.8 µm capillary column Helium 1.2 mL·min–1 Peak shape for both components not good Method rejected RTX1, 30 m × 0.53 mm, 1 .0 µm capillary column Helium 1.5 mL·min–1 Poor resolution and low response Method rejected RTX5, 30 m × 0.53 mm, 1 .5 µm capillary column Helium 1.5 mL·min–1 Good resolution and good peak shape Method accepted Copyright © 2011 SciRes. AJAC 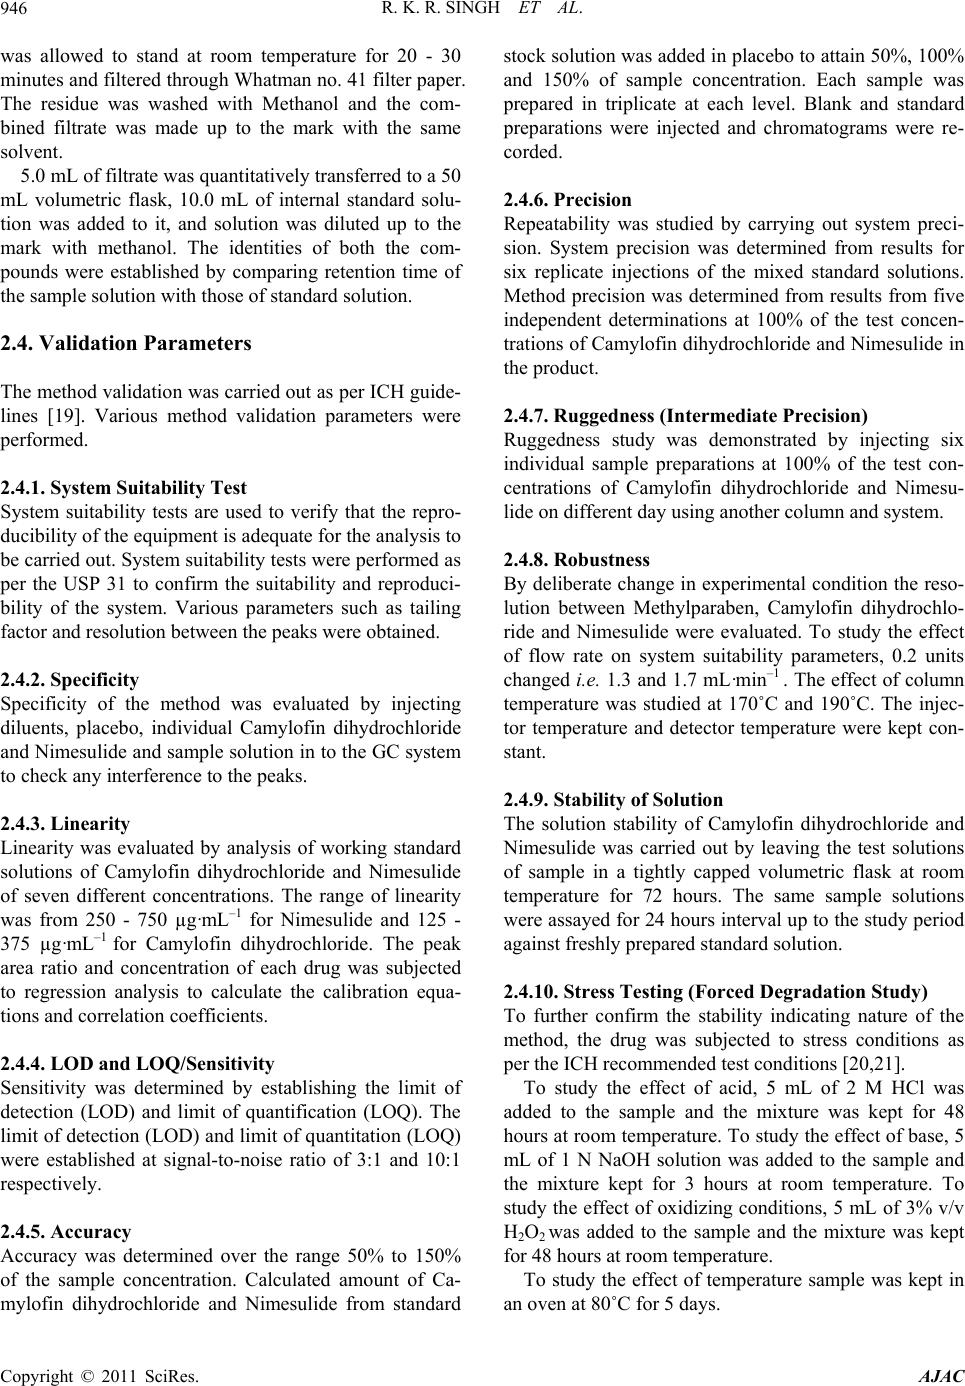 R. K. R. SINGH ET AL. Copyright © 2011 SciRes. AJAC 946 was allowed to stand at room temperature for 20 - 30 minutes and filtered throug h Whatman no. 41 filter paper. The residue was washed with Methanol and the com- bined filtrate was made up to the mark with the same solvent. 5.0 mL of filtrate was quantitatively transferred to a 50 mL volumetric flask, 10.0 mL of internal standard solu- tion was added to it, and solution was diluted up to the mark with methanol. The identities of both the com- pounds were established by comparing retention time of the sample solution with those of standard solution. 2.4. Validation Parameters The method validation was carried out as per ICH guide- lines [19]. Various method validation parameters were performed. 2.4.1. System Suitability Test System suitability tests are used to verify that the repro- ducibility of the equipment is adequate for the an alysis to be carried out. System suitability tests were performed as per the USP 31 to confirm the suitability and reproduci- bility of the system. Various parameters such as tailing factor and resol ut i on be t w een the peaks were obtained. 2.4.2. Specificity Specificity of the method was evaluated by injecting diluents, placebo, individual Camylofin dihydrochloride and Nimesulide and sample solution in to the GC system to check any interference to the peaks. 2.4.3. Linearity Linearity was evaluated by analysis of working standard solutions of Camylofin dihydrochloride and Nimesulide of seven different concentrations. The range of linearity was from 250 - 750 µg·mL–1 for Nimesulide and 125 - 375 µg·mL–1 for Camylofin dihydrochloride. The peak area ratio and concentration of each drug was subjected to regression analysis to calculate the calibration equa- tions and correlation coefficients. 2.4.4. LOD and LOQ/Sensitivity Sensitivity was determined by establishing the limit of detection (LOD) and limit of quantification (LOQ). The limit of detectio n (LOD) and limit of quantitation (LOQ) were established at signal-to-noise ratio of 3:1 and 10:1 respectively. 2.4.5. Accu racy Accuracy was determined over the range 50% to 150% of the sample concentration. Calculated amount of Ca- mylofin dihydrochloride and Nimesulide from standard stock solution was added in placebo to attain 50%, 100% and 150% of sample concentration. Each sample was prepared in triplicate at each level. Blank and standard preparations were injected and chromatograms were re- corded. 2.4.6. Precision Repeatability was studied by carrying out system preci- sion. System precision was determined from results for six replicate injections of the mixed standard solutions. Method precision was determined from results from five independent determinations at 100% of the test concen- trations of Camylofin dihydrochloride and Nimesulide in the product. 2.4.7. Ruggedness (Intermediate Precision) Ruggedness study was demonstrated by injecting six individual sample preparations at 100% of the test con- centrations of Camylofin dihydrochloride and Nimesu- lide on different day using another column and system. 2.4.8. Robustness By deliberate change in experimental condition the reso- lution between Methylparaben, Camylofin dihydrochlo- ride and Nimesulide were evaluated. To study the effect of flow rate on system suitability parameters, 0.2 units changed i.e. 1.3 and 1.7 mL·min–1 . T he effect of column temperature was studied at 170˚C and 190˚C. The injec- tor temperature and detector temperature were kept con- stant. 2.4.9. Stability of Solution The solution stability of Camylofin dihydrochloride and Nimesulide was carried out by leaving the test solutions of sample in a tightly capped volumetric flask at room temperature for 72 hours. The same sample solutions were assayed for 24 hours interval up to the study period against freshly prepared standard solution. 2.4.10. Stress Testing (Forced Degradation Study) To further confirm the stability indicating nature of the method, the drug was subjected to stress conditions as per the ICH recommended test conditions [20,21]. To study the effect of acid, 5 mL of 2 M HCl was added to the sample and the mixture was kept for 48 hours at room temperature. To study the effect of base, 5 mL of 1 N NaOH solution was added to the sample and the mixture kept for 3 hours at room temperature. To study the effect of oxidizing conditions, 5 mL of 3% v/v H2O2 was added to the sample and the mixture was kept for 48 hours at room temperature. To study the effect of temperature sample was kept in an oven at 8 0˚C for 5 days. 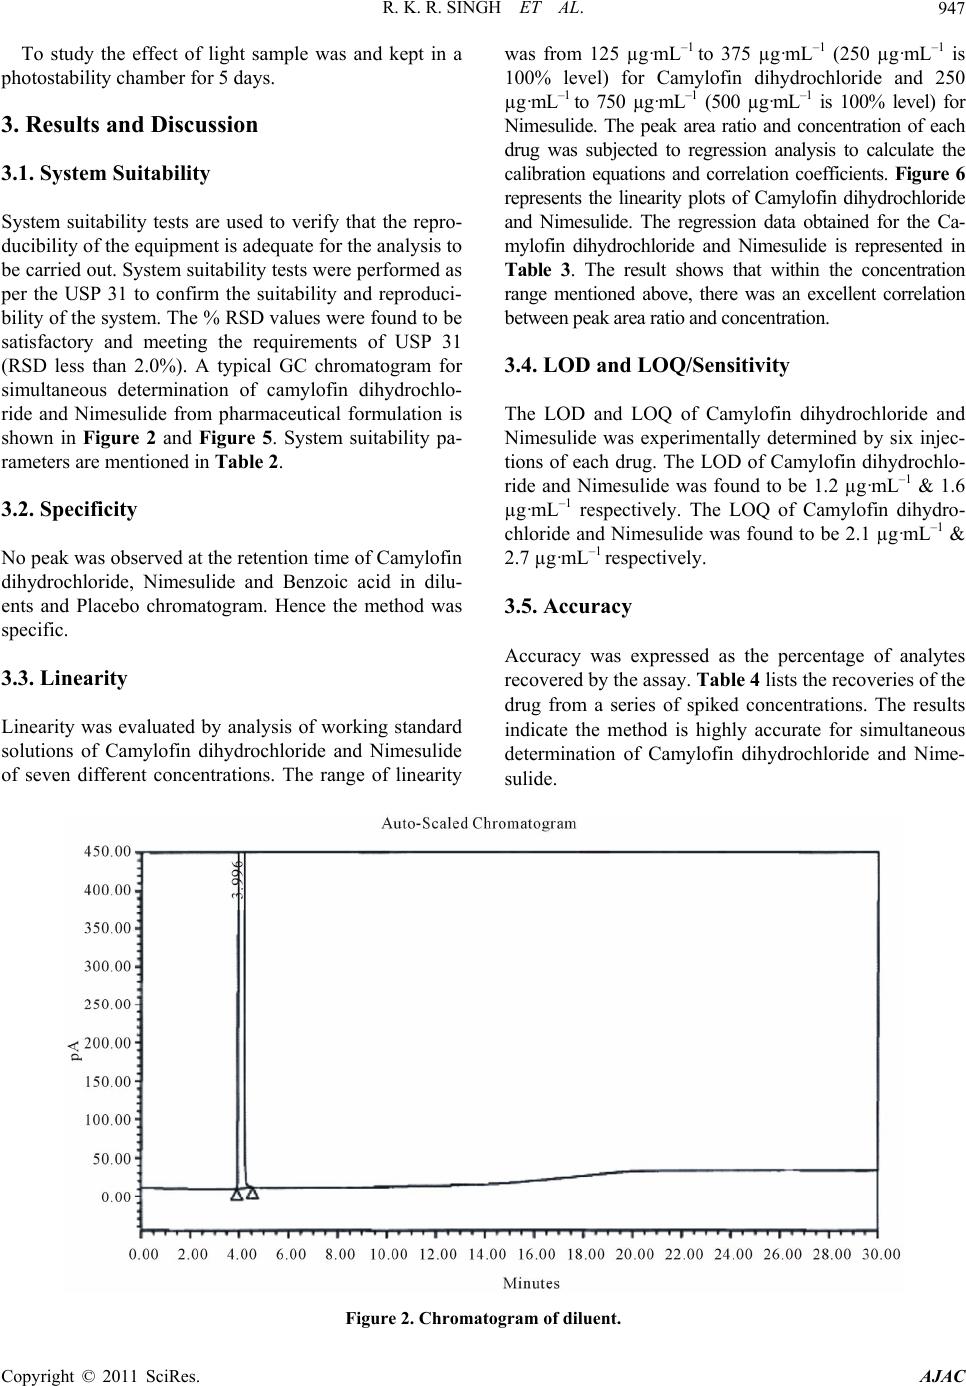 R. K. R. SINGH ET AL.947 To study the effect of light sample was and kept in a photostability chamber for 5 days. 3. Results and Discussion 3.1. System Suitability System suitability tests are used to verify that the repro- ducibility of the equipment is adequate for the an alysis to be carried out. System suitability tests were performed as per the USP 31 to confirm the suitability and reproduci- bility of the system. The % RSD values were found to be satisfactory and meeting the requirements of USP 31 (RSD less than 2.0%). A typical GC chromatogram for simultaneous determination of camylofin dihydrochlo- ride and Nimesulide from pharmaceutical formulation is shown in Figure 2 and Figure 5. System suitability pa- rameters are mentioned in Table 2. 3.2. Specificity No peak was observed at the retention ti me of Camylofin dihydrochloride, Nimesulide and Benzoic acid in dilu- ents and Placebo chromatogram. Hence the method was specific. 3.3. Linearity Linearity was evaluated by analysis of working standard solutions of Camylofin dihydrochloride and Nimesulide of seven different concentrations. The range of linearity was from 125 µg·mL–1 to 375 µg·mL–1 (250 µg·mL–1 is 100% level) for Camylofin dihydrochloride and 250 µg·mL–1 to 750 µg·mL–1 (500 µg·mL–1 is 100% level) for Nimesulide. The peak area ratio and concentration of each drug was subjected to regression analysis to calculate the calibration equations and correlation coefficients. Figure 6 represents the linearity plots of Camylofin dihydrochloride and Nimesulide. The regression data obtained for the Ca- mylofin dihydrochloride and Nimesulide is represented in Table 3. The result shows that within the concentration range mentioned above, there was an excellent correlation between peak area ratio and concentration. 3.4. LOD and LOQ/Sensitivity The LOD and LOQ of Camylofin dihydrochloride and Nimesulide was experimentally determined by six injec- tions of each drug. The LOD of Camylofin dihydrochlo- ride and Nimesulide was found to be 1.2 µg·mL–1 & 1.6 µg·mL–1 respectively. The LOQ of Camylofin dihydro- chloride and Nimesulide was found to be 2.1 µg·mL–1 & 2.7 µg·mL–1 respectively. 3.5. Accuracy Accuracy was expressed as the percentage of analytes recovered by the assay. Table 4 lists the recoveries of the drug from a series of spiked concentrations. The results indicate the method is highly accurate for simultaneous determination of Camylofin dihydrochloride and Nime- sulide. Figure 2. Chromatogram of diluent. Copyright © 2011 SciRes. AJAC 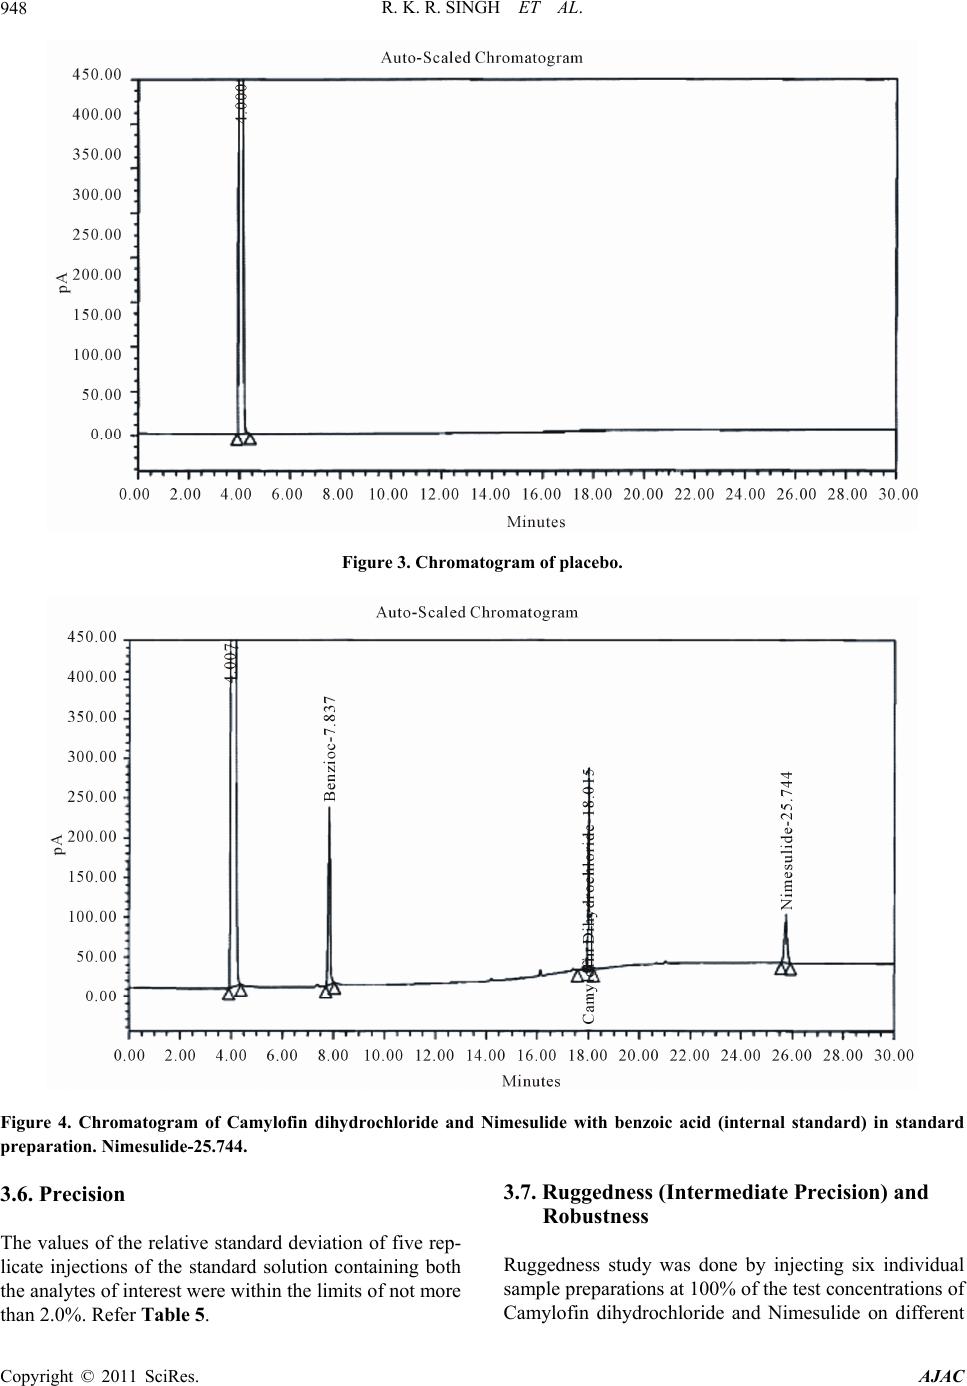 R. K. R. SINGH ET AL. 948 Figure 3. Chromatogram of placebo. Figure 4. Chromatogram of Camylofin dihydrochloride and Nimesulide with benzoic acid (internal standard) in standard preparation. Nimesulide-25.744. 3.6. Precision The values of the relative standard deviation of five rep- licate injections of the standard solution containing both the analytes of interest were within the limits of not more than 2.0%. Ref e r Table 5. 3.7. Ruggedness (Intermediate Precision) and Robustness Ruggedness study was done by injecting six individual sample preparations at 100% of the test concentrations of amylofin dihydrochloride and Nimesulide on different C Copyright © 2011 SciRes. AJAC 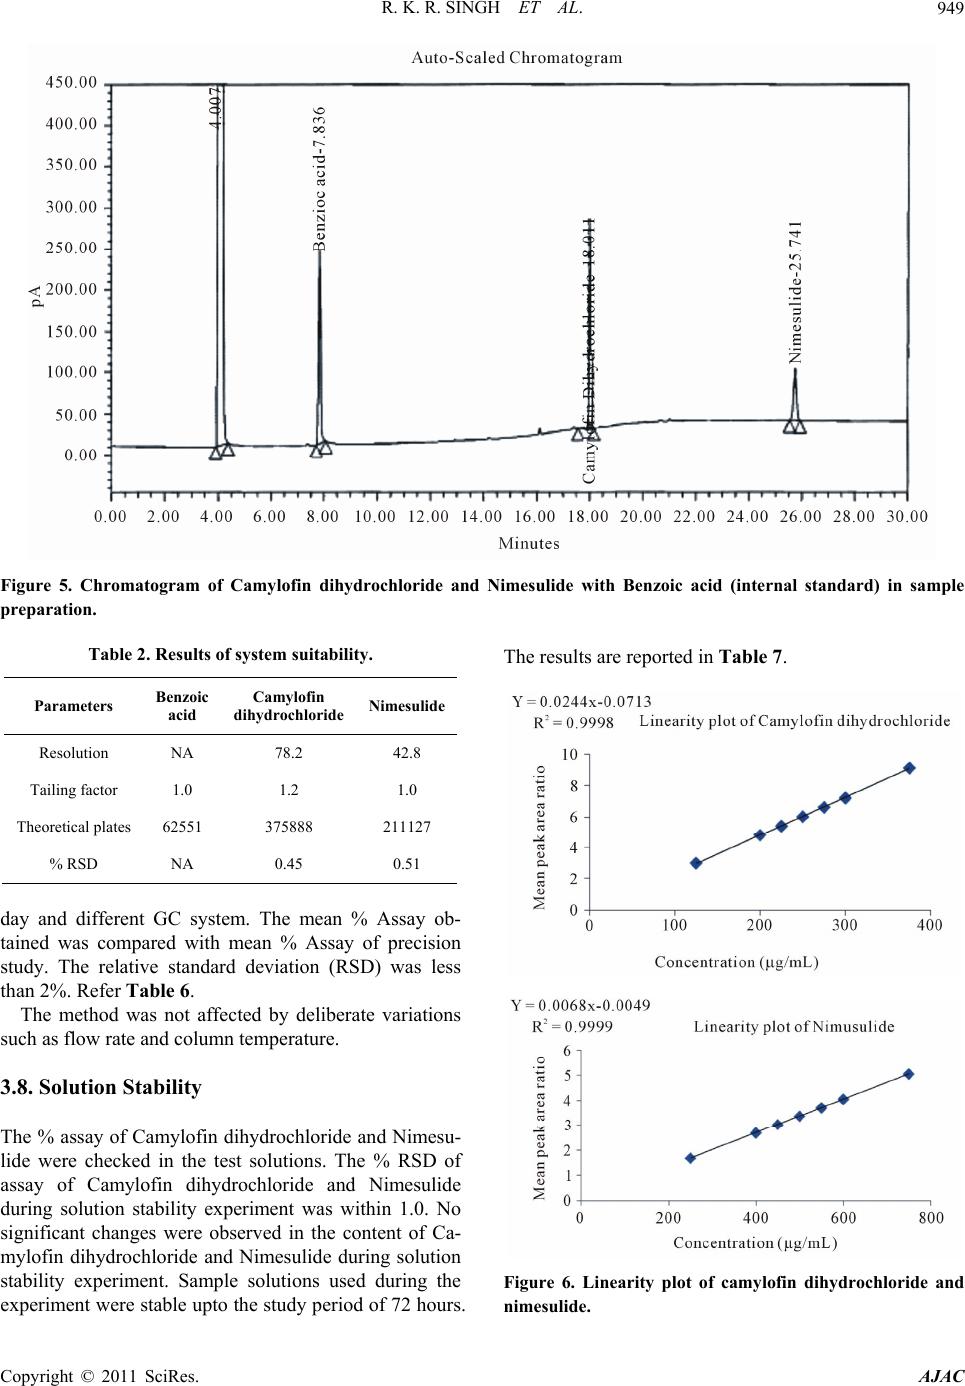 R. K. R. SINGH ET AL. Copyright © 2011 SciRes. AJAC 949 Figure 5. Chromatogram of Camylofin dihydrochloride and Nimesulide with Benzoic acid (internal standard) in sample preparation. Table 2. Results of system suitability. Parameters Benzoic acid Camylofin dihydrochloride Nimesulide Resolution NA 78.2 42.8 Tailing factor 1.0 1.2 1.0 Theoretical plates 62551 375888 211127 % RSD NA 0.45 0.51 day and different GC system. The mean % Assay ob- tained was compared with mean % Assay of precision study. The relative standard deviation (RSD) was less than 2%. Refer Table 6. The method was not affected by deliberate variations such as flow rate and column temperature. 3.8. Solution Stability The % assay of Camylofin dihydrochloride and Nimesu- lide were checked in the test solutions. The % RSD of assay of Camylofin dihydrochloride and Nimesulide during solution stability experiment was within 1.0. No significant changes were observed in the content of Ca- mylofin dihydrochloride and Nimesulide during solution stability experiment. Sample solutions used during the experiment were stable up to the study period of 72 hours. The results are reported in Table 7. Figure 6. Linearity plot of camylofin dihydrochloride and imesulide. n 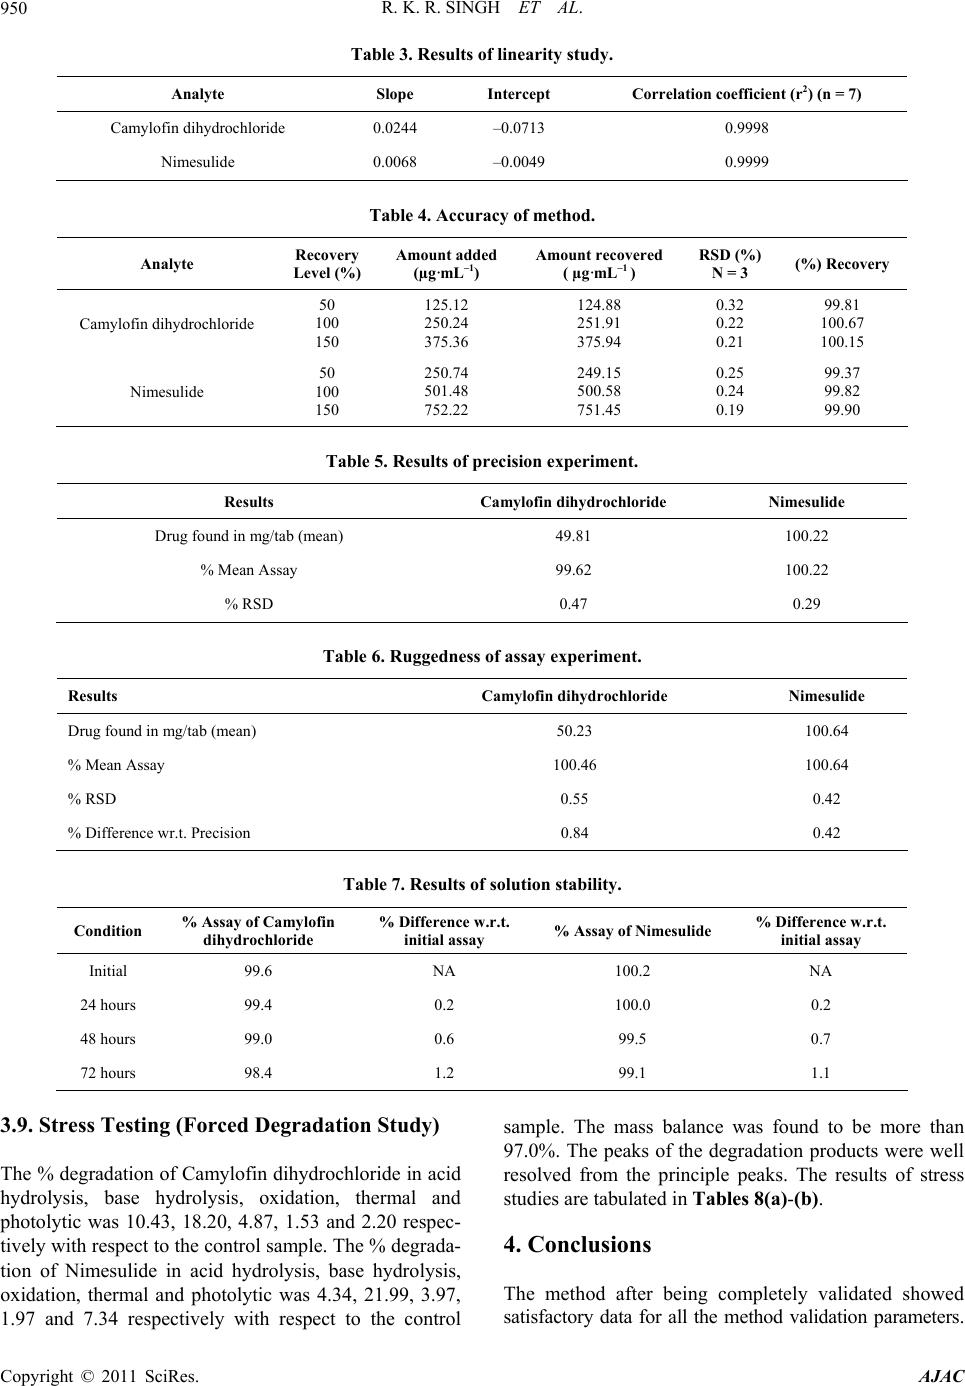 R. K. R. SINGH ET AL. Copyright © 2011 SciRes. AJAC 950 Table 3. Results of linearity study. Analyte Slope Intercept Correlation coefficient (r2) (n = 7) Camylofin dihydrochloride 0.0244 –0.0713 0.9998 Nimesulide 0.0068 –0.0049 0.9999 Table 4. Accuracy of method. Analyte Recovery Level (%) Amount added (µg·mL–1) Amount recovered ( µg·mL–1 ) RSD (%) N = 3 (%) Recovery Camylofin dihydrochloride 50 100 150 125.12 250.24 375.36 124.88 251.91 375.94 0.32 0.22 0.21 99.81 100.67 100.15 Nimesulide 50 100 150 250.74 501.48 752.22 249.15 500.58 751.45 0.25 0.24 0.19 99.37 99.82 99.90 Table 5. Results of precision experiment. Results Camylofin dihydrochloride Nimesulide Drug found in m g/tab (mean) 49.81 100.22 % Mean Assay 99.62 100.22 % RSD 0.47 0.29 Table 6. Ruggedness of assay experiment. Results Camylofin dihydrochloride Nimesulide Drug found in m g/tab (mean) 50.23 100.64 % Mean Assay 100.46 100.64 % RSD 0.55 0.42 % Difference wr.t. Precision 0.84 0.42 Table 7. Results of solution stability. Condition % Assay of Camylofin dihydrochloride % Difference w.r.t. initial assay % Assay of Nimesulide % Difference w.r.t. initial assay Initial 99.6 NA 100.2 NA 24 hours 99.4 0.2 100.0 0.2 48 hours 99.0 0.6 99.5 0.7 72 hours 98.4 1.2 99.1 1.1 3.9. Stress Testing (Forced Degradation Study) The % degradation of Camylofin dihydrochloride in acid hydrolysis, base hydrolysis, oxidation, thermal and photolytic was 10.43, 18.20, 4.87, 1.53 and 2.20 respec- tively with respect to the control sample. The % degrada- tion of Nimesulide in acid hydrolysis, base hydrolysis, oxidation, thermal and photolytic was 4.34, 21.99, 3.97, 1.97 and 7.34 respectively with respect to the control sample. The mass balance was found to be more than 97.0%. The peaks of the degradation products were well resolved from the principle peaks. The results of stress studies are tabulated in Tables 8(a)-(b). 4. Conclusions The method after being completely validated showed atisfactory data for all the method validation parameters. s 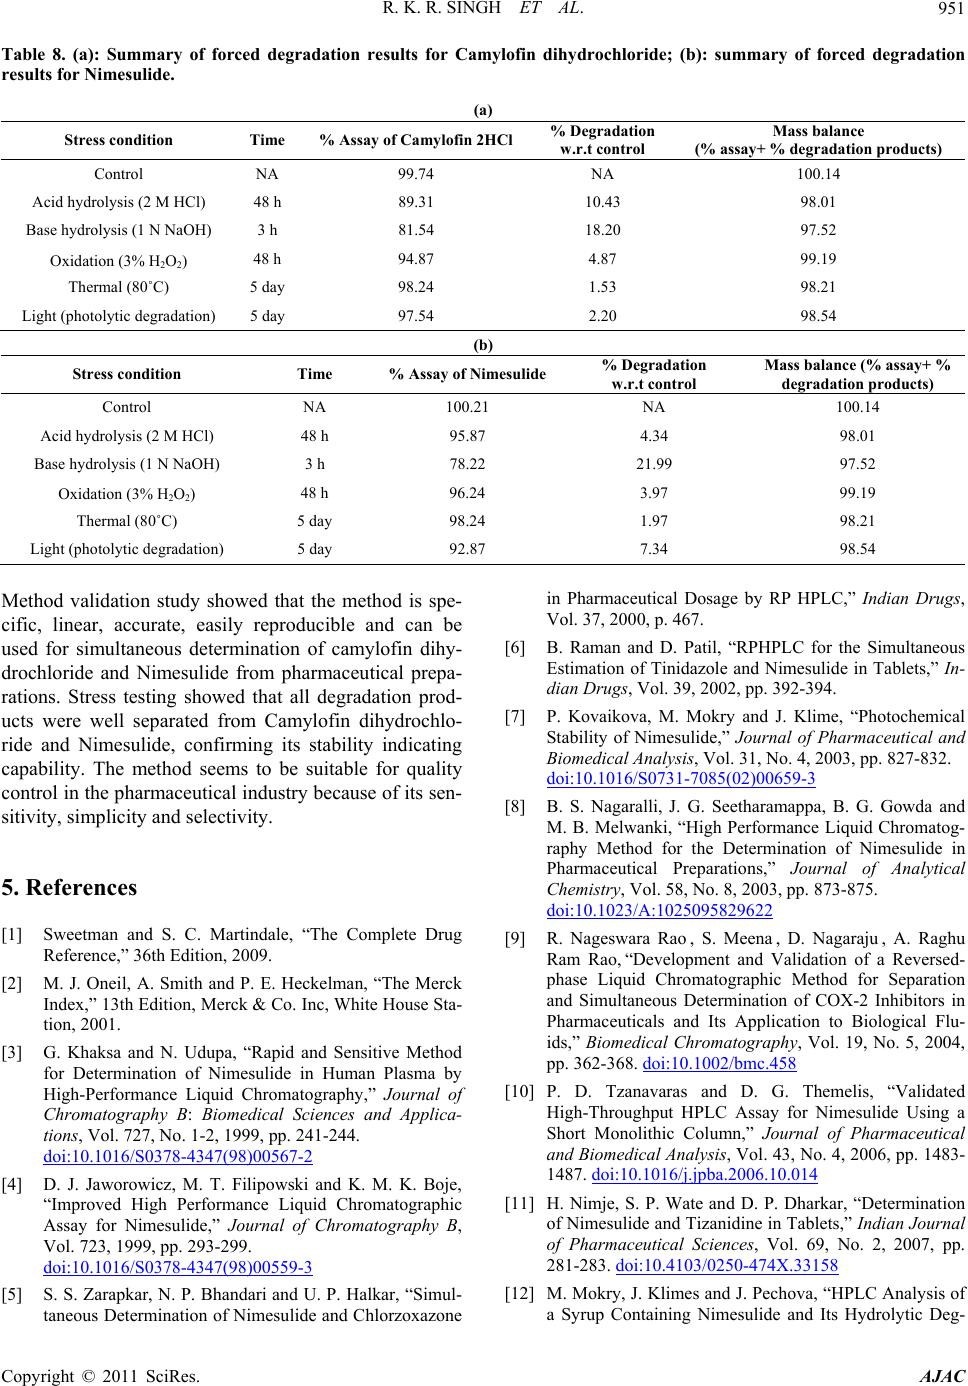 R. K. R. SINGH ET AL. Copyright © 2011 SciRes. AJAC 951 Table 8. (a): Summary of forced degradation results for Camylofin dihydrochloride; (b): summary of forced degradation results for Nimesulide. (a) Stress condition Time % Assay of Camylofin 2HCl % Degradation w.r.t control Mass balance (% assay+ % degradation products) Control NA 99.74 NA 100.14 Acid hydrolysis (2 M HCl) 48 h 89.31 10.43 98.01 Base hydrolysis (1 N NaOH) 3 h 81.54 18.20 97.52 Oxidation (3% H2O2) 48 h 94.87 4.87 99.19 Thermal (80˚C) 5 day 98.24 1.53 98.21 Light (photolytic degradation) 5 day 97.54 2.20 98.54 (b) Stress condition Time % Assay of Nimesulide% Degradation w.r.t control Mass balance (% assay+ % degradation products) Control NA 100.21 NA 100.14 Acid hydrolysis (2 M HCl) 48 h 95.87 4.34 98.01 Base hydrolysis (1 N NaOH) 3 h 78.22 21.99 97.52 Oxidation (3% H2O2) 48 h 96.24 3.97 99.19 Thermal (80˚C) 5 day 98.24 1.97 98.21 Light (photolytic degradation) 5 day 92.87 7.34 98.54 Method validation study showed that the method is spe- cific, linear, accurate, easily reproducible and can be used for simultaneous determination of camylofin dihy- drochloride and Nimesulide from pharmaceutical prepa- rations. Stress testing showed that all degradation prod- ucts were well separated from Camylofin dihydrochlo- ride and Nimesulide, confirming its stability indicating capability. The method seems to be suitable for quality control in the pharmaceutical industry because of its sen- sitivity, simplicity and selectivity. 5. References [1] Sweetman and S. C. Martindale, “The Complete Drug Reference,” 36th Edition, 2009. [2] M. J. Oneil, A. Smith and P. E. Heckelman, “The Merck Index,” 13th Edition, Merck & Co. Inc, White House Sta- tion, 2001. [3] G. Khaksa and N. Udupa, “Rapid and Sensitive Method for Determination of Nimesulide in Human Plasma by High-Performance Liquid Chromatography,” Journal of Chromatography B: Biomedical Sciences and Applica- tions, Vol. 727, No. 1-2, 1999, pp. 241-244. doi:10.1016/S0378-4347(98)00567-2 [4] D. J. Jaworowicz, M. T. Filipowski and K. M. K. Boje, “Improved High Performance Liquid Chromatographic Assay for Nimesulide,” Journal of Chromatography B, Vol. 723, 1999, pp. 293-299. doi:10.1016/S0378-4347(98)00559-3 [5] S. S. Zarapka r, N. P. Bhandari and U. P. Halkar, “Simul- taneous Determination of Nimesulide and Chlorzoxazone in Pharmaceutical Dosage by RP HPLC,” Indian Drugs, Vol. 37, 2000, p. 467. [6] B. Raman and D. Patil, “RPHPLC for the Simultaneous Estimation of Tinidazole and Nimesulide in Tablets,” In- dian Drugs, Vol. 39, 2002, pp. 392-394. [7] P. Kovaikova, M. Mokry and J. Klime, “Photochemical Stability of Nimesulide,” Journal of Pharmaceutical and Biomedical Analysis , Vol. 31, No. 4, 2003, pp. 827-832. doi:10.1016/S0731-7085(02)00659-3 [8] B. S. Nagaralli, J. G. Seetharamappa, B. G. Gowda and M. B. Melwanki, “High Performance Liquid Chromatog- raphy Method for the Determination of Nimesulide in Pharmaceutical Preparations,” Journal of Analytical Chemistry, Vol. 58, No. 8, 2003, pp. 873-875. doi:10.1023/A:1025095829622 [9] R. Nageswara Rao , S. Meena , D. Nagaraju , A. Raghu Ram Rao, “Development and Validation of a Reversed- phase Liquid Chromatographic Method for Separation and Simultaneous Determination of COX-2 Inhibitors in Pharmaceuticals and Its Application to Biological Flu- ids,” Biomedical Chromatography, Vol. 19, No. 5, 2004, pp. 362-368. doi:10.1002/bmc.458 [10] P. D. Tzanavaras and D. G. Themelis, “Validated High-Throughput HPLC Assay for Nimesulide Using a Short Monolithic Column,” Journal of Pharmaceutical and Biomedical Analysis, Vol. 43, No. 4, 2006, pp. 1483- 1487. doi:10.1016/j.jpba.2006.10.014 [11] H. Nimje, S. P. Wate and D. P. Dharkar, “Determination of Nimesulide and Tizanidine in Tablets,” Indian Journal of Pharmaceutical Sciences, Vol. 69, No. 2, 2007, pp. 281-283. doi:10.4103/0250-474X.33158 [12] M. Mokry, J. Klime s and J. Pechova, “HPLC Analysis of a Syrup Containing Nimesulide and Its Hydrolytic Deg-  R. K. R. SINGH ET AL. 952 radation Product,” Chemical Papers, Vol. 64, 2010, pp. 405-408. doi:10.2478/s11696-010-0001-2 [13] F. A. Elbarbry, M. M. Mabrouk and M. A. El-Dway, “Determination of the Analgesic Components of Spas- momigraine Tablet by Liquid Chromatography with Ul- traviole t Detect ion,” Journal of AOAC International, Vol. 90, No. 1, 2007, pp. 94-101. [14] P. S. Barde, A. Y. Desai, S. M. N. Roy and V. V. Vaidy a, “Simultaneous RP HPLC Determination of Camylofin Dihydrochloride in Pharmaceutical Preparation,” TSI Journal, Vol. 7, No. 10, 2008. [15] R. R. Singh, M. V. Rathnam and R. Vegesna, “Simulta- neous RP HPLC Determination of Camylofin Dihydro- chloride and Paracetamol in Pharmaceutical Prepara- tions,” TSI Journal, Vol. 7, No. 11, 2008. [16] M. V. Rathnam and R. R. Singh, “Simultaneous RP HPLC Determination of Camylofin Dihydrochloride and Diclofenac Potassium in Pharmaceutical Preparations,” Pharm Anal Acta, Vol. 1, No. 2, 2010, p. 1000108. doi:10.4172/2153-2435.1000108 [17] E. Crombeza, W. Van Den Bosschea and P. De Moer- loosea, “Gas Chromatographic Determination of Camy- lofine Dihydrochloride in Tablets and Suppositories,” Journal of Chromatography A, Vol. 117, No. 1, 1976, pp 161-166. doi:10.1016/S0021-9673(00)81077-8 [18] L. R. Snyder, J. J. Kirland and J. L. Glajch, “Practical HPLC Method Development,” 2nd Edition, John Wiley and sons, Inc., Hokoben, 1997. [19] ICH, “Validation of Analytical Procedures; Text and Methodology,” International Conference on Harmoniza- tion Guidance Documents, Q2 (R1), 2005. [20] ICH, “Photo Stability Testing of New Drugs Substances and Products,” International Conference on Harmoniza- tion Guidance Documents, Q1B, 2005. [21] ICH, “Stability Testing of New Drug Substances and Products,” International Conference on Harmonization Guidance Documents, Q1A (R20), 2005. Copyright © 2011 SciRes. AJAC |