

Paper Menu >>
Journal Menu >>
 Optics and Photonics Journal, 2011, 1, 197-203 doi:10.4236/opj.2011.14031 Published Online December 2011 (http://www.SciRP.org/journal/opj) Copyright © 2011 SciRes. OPJ Real Time Monitoring of Fluorescent Particles in Micro-Channels by High Resolution Dual Modality Probe Imaging Krishnan Sathiyamoorthy, Valiyambath Krishnan Mohankumar, Vadakke Matham Murukeshan School of Mechanical and Aerospace engineering, Nanyang Technological University, Singapore E-mail: [email protected] Received July 27, 2011; revised September 6, 2011; accepted September 26, 2011 Abstract Imaging of micro particles in micro-fluidic channels is one of the recent thrust areas in research as it pro- vides more flexibility in setup and analysis compared to conventional microscopy. However, a probe based imaging scheme, with achievable high resolutions incorporating multimodal analysis is one of the challenges researchers have been facing. In this context, this paper illustrates a simple dual modality high resolution flexible probe imaging system for imaging applications in micro/optofluidic channels. The proposed system exhibits axial and lateral resolution of about 16 μm and 3.12 μm respectively. This proposed system also ex- hibits a modulation transfer function (MTF) of about 38.42%. The performance of the system is validated by imaging micro particles in a microchannel and obtaining the fluorescent emission spectrum simultaneously. Keywords: Microscopy, Image Fiber, Spectrophotometer, Microchannel 1. Introduction Micro-fluidic devices have found an exquisite position in the biomedical technology in recent decades due to their successful implementation in the development of DNA chips, lab-on-a-chip and optofluidic technologies [1-9]. Micro-channels have been implemented as pseudo blood vessels with confocal Particle Image Velocimetry (mi- cro-PIV) as the detection system to better understand blood rheology [4,7]. Microchannels also find applica- tion in biochemical analysis as they help in reducing the usage of analytes significantly. Moreover, a complete microchemical system with a large number of micro- channels for simultaneous analysis of a large number of samples becomes possible as a result of its miniature size and easy fabrication [4]. The detection modes in these systems can be as varied as UV-vis absorbance, refrac- tive index measurements, electrochemical detection, or laser-induced fluorescence detection. But most of the detection systems remained aloof from the microchannel as close monitoring was found to be less feasible. Hence the development of on-chip methods for the investigation of physical, chemical and biological processes is receiv- ing rapidly increasing attention [3,5,6]. Image fiber based probe system will help in interrogation of remote sites due to its flexibility and miniature size [10-15]. Several groups have investigated different configurations of fiber based imaging systems for diverse applications [11,14-22]. For example, the flexibility miniature size of the image fiber based optical imaging system enables it to be readily integrated with commercially available en- doscopic systems. Fiber-based profilometer is preferred in inspecting hard- to-reach surfaces than microscope-type profilometers because of their size. Confocal Particle Image Velocime- try (micro-PIV) has been successfully employed in mi- crochannel to study the blood rheology [4,7]. But its flexibility and ease of application in a system containing a large number of microchannels for multianalyte analy- sis is curtailed due to its bulky size. Flexible fiber image guides can be used to transmit spatially parallel optical data between a multichannel array in large microchannel system and a photodetector array [23]. Besides, image fiber based system has an advantage that it can also be operated in a quasi/confocal regime due to possible excitation of each individual fiberlets/group of fiberlets. It can also enable imaging of the targeted sample without mechanical scanning by adopting point by point illumination of individual fiberlets at a time employing appropriate optics at the appropriate planes [11-15,19,24]. 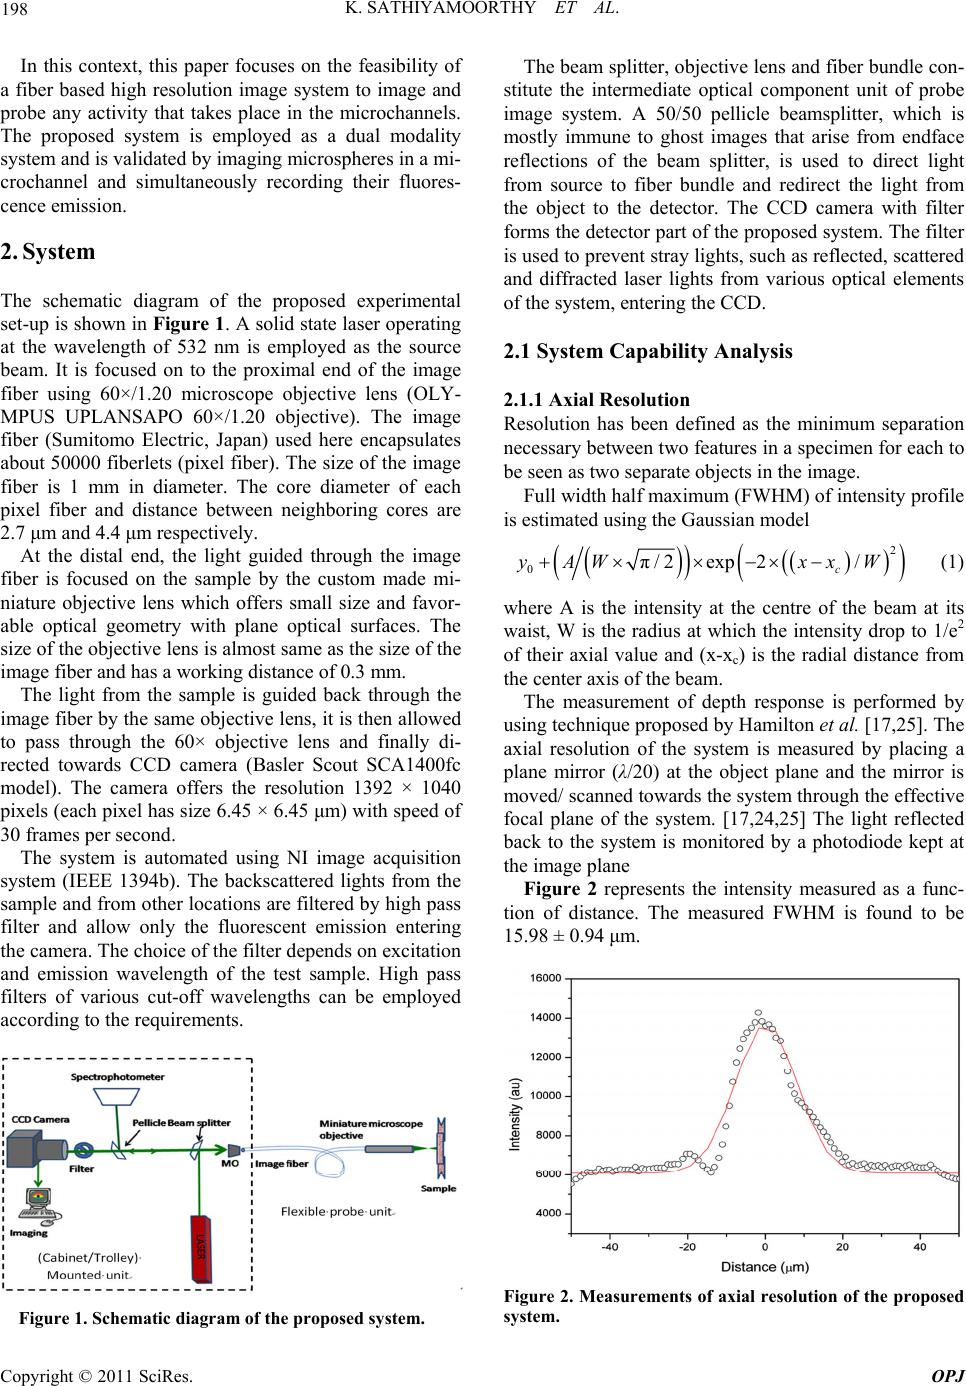 K. SATHIYAMOORTHY ET AL. 198 In this context, this paper focuses on the feasibility of a fiber based high resolution image system to image and probe any activity that takes place in the microchannels. The proposed system is employed as a dual modality system and is validated by imaging microspheres in a mi- crochannel and simultaneously recording their fluores- cence emission. 2. System The schematic diagram of the proposed experimental set-up is shown in Figure 1. A solid state laser operating at the wavelength of 532 nm is employed as the source beam. It is focused on to the proximal end of the image fiber using 60×/1.20 microscope objective lens (OLY- MPUS UPLANSAPO 60×/1.20 objective). The image fiber (Sumitomo Electric, Japan) used here encapsulates about 50000 fiberlets (pixel fiber). The size of the image fiber is 1 mm in diameter. The core diameter of each pixel fiber and distance between neighboring cores are 2.7 μm and 4.4 μm respectively. At the distal end, the light guided through the image fiber is focused on the sample by the custom made mi- niature objective lens which offers small size and favor- able optical geometry with plane optical surfaces. The size of the objective lens is almost same as the size of the image fiber and has a working distance of 0.3 mm. The light from the sample is guided back through the image fiber by the same objective lens, it is then allowed to pass through the 60× objective lens and finally di- rected towards CCD camera (Basler Scout SCA1400fc model). The camera offers the resolution 1392 × 1040 pixels (each pixel has size 6.45 × 6.45 μm) with speed of 30 frames per second. The system is automated using NI image acquisition system (IEEE 1394b). The backscattered lights from the sample and from other locations are filtered by high pass filter and allow only the fluorescent emission entering the camera. The choice of the filter depends on excitation and emission wavelength of the test sample. High pass filters of various cut-off wavelengths can be employed according to the requirements. Figure 1. Schematic diagram of the proposed system. The beam splitter, objective lens and fiber bundle con- stitute the intermediate optical component unit of probe image system. A 50/50 pellicle beamsplitter, which is mostly immune to ghost images that arise from endface reflections of the beam splitter, is used to direct light from source to fiber bundle and redirect the light from the object to the detector. The CCD camera with filter forms the detector part of the proposed system. The filter is used to prevent stray lights, such as reflected, scattered and diffracted laser lights from various optical elements of the system, entering the CCD. 2.1 System Capability Analysis 2.1.1 Axi al Resoluti o n Resolution has been defined as the minimum separation necessary between two features in a specimen for each to be seen as two separate objects in the image. Full width half maximum (FWHM) of intensity profile is estimated using the Gaussian model 2 0π/2exp 2/ c yAW xxW (1) where A is the intensity at the centre of the beam at its waist, W is the radius at which the intensity drop to 1/e2 of their axial value and (x-xc) is the radial distance from the center axis of the beam. The measurement of depth response is performed by using technique proposed by Hamilton et al. [17,25]. The axial resolution of the system is measured by placing a plane mirror (λ/20) at the object plane and the mirror is moved/ scanned towards the system through the effective focal plane of the system. [17,24,25] The light reflected back to the system is monitored by a photodiode kept at the image plane Figure 2 represents the intensity measured as a func- tion of distance. The measured FWHM is found to be 15.98 ± 0.94 μm. Figure 2. Measurements of axial resolution of the proposed system. Copyright © 2011 SciRes. OPJ 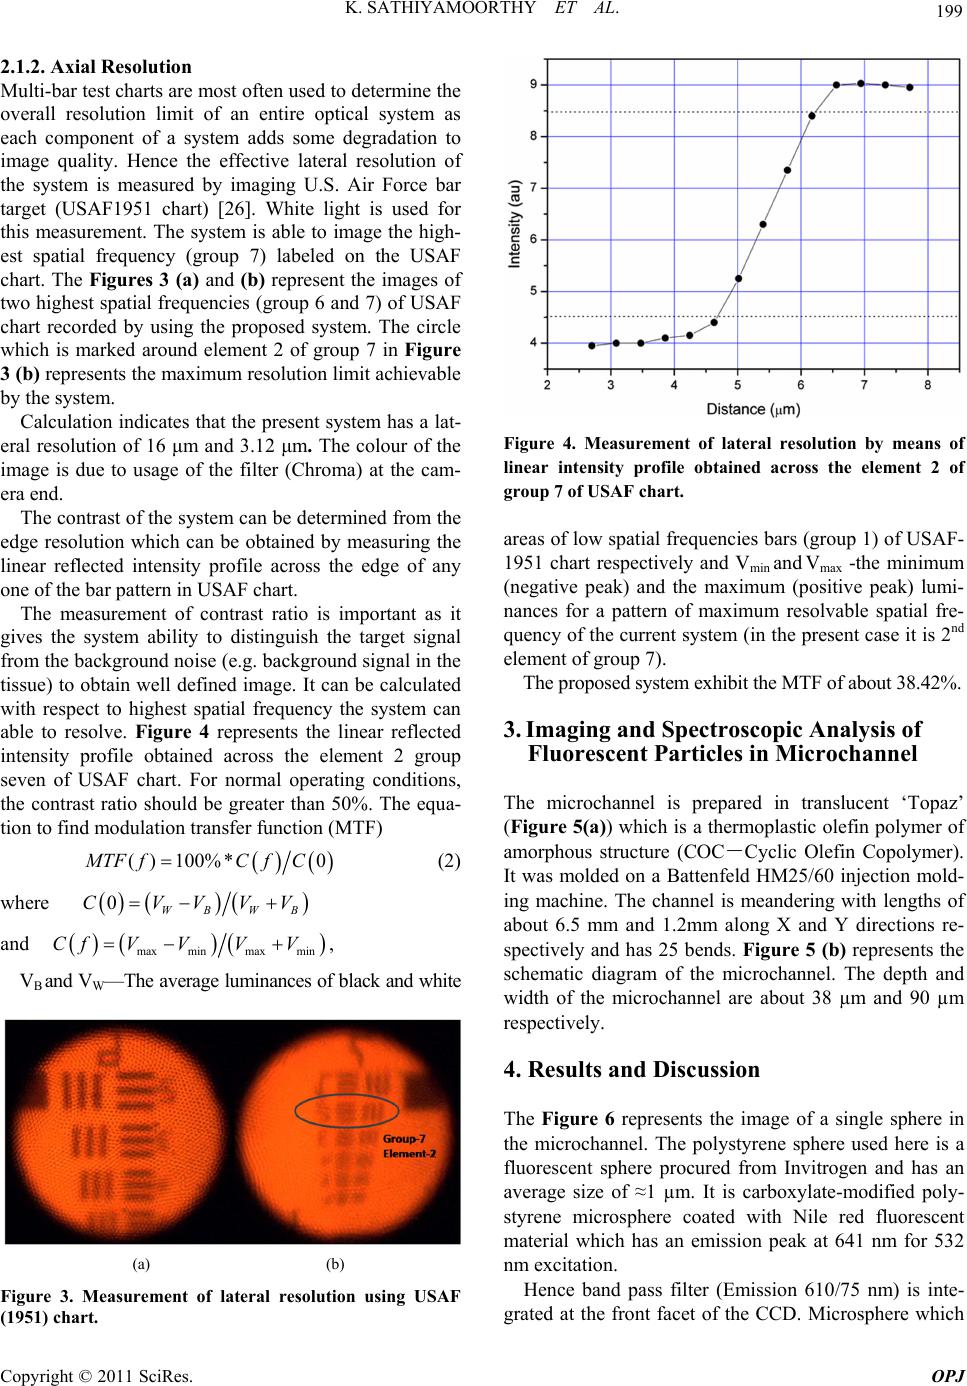 199 K. SATHIYAMOORTHY ET AL. 2.1.2. Axi al R e sol ution Multi-bar test charts are most often used to determine the overall resolution limit of an entire optical system as each component of a system adds some degradation to image quality. Hence the effective lateral resolution of the system is measured by imaging U.S. Air Force bar target (USAF1951 chart) [26]. White light is used for this measurement. The system is able to image the high- est spatial frequency (group 7) labeled on the USAF chart. The Figures 3 (a) and (b) represent the images of two highest spatial frequencies (group 6 and 7) of USAF chart recorded by using the proposed system. The circle which is marked around element 2 of group 7 in Figure 3 (b) represents the maximum resolution limit achievable by the system. Calculation indicates that the present system has a lat- eral resolution of 16 μm and 3.12 μm. The colour of the image is due to usage of the filter (Chroma) at the cam- era end. The contrast of the system can be determined from the edge resolution which can be obtained by measuring the linear reflected intensity profile across the edge of any one of the bar pattern in USAF chart. The measurement of contrast ratio is important as it gives the system ability to distinguish the target signal from the background noise (e.g. background signal in the tissue) to obtain well defined image. It can be calculated with respect to highest spatial frequency the system can able to resolve. Figure 4 represents the linear reflected intensity profile obtained across the element 2 group seven of USAF chart. For normal operating conditions, the contrast ratio should be greater than 50%. The equa- tion to find modulation transfer function (MTF) ()100% *0MTF fCfC (2) where 0WB WB CVVVV and max minmax min Cf V VV V , VB and VW—The average luminances of black and white (a) (b) Figure 3. Measurement of lateral resolution using USAF (1951) chart. Figure 4. Measurement of lateral resolution by means of linear intensity profile obtained across the element 2 of group 7 of USAF chart. areas of low spatial frequencies bars (group 1) of USAF- 1951 chart respectively and Vmin and Vmax -the minimum (negative peak) and the maximum (positive peak) lumi- nances for a pattern of maximum resolvable spatial fre- quency of the current system (in the present case it is 2nd element of group 7). The proposed system exhibit the MTF of about 38.42%. 3. Imaging and Spectroscopic Analysis of Fluorescent Particles in Microchannel The microchannel is prepared in translucent ‘Topaz’ (Figure 5(a)) which is a thermoplastic olefin polymer of amorphous structure (COC-Cyclic Olefin Copolymer). It was molded on a Battenfeld HM25/60 injection mold- ing machine. The channel is meandering with lengths of about 6.5 mm and 1.2mm along X and Y directions re- spectively and has 25 bends. Figure 5 (b) represents the schematic diagram of the microchannel. The depth and width of the microchannel are about 38 µm and 90 µm respectively. 4. Results and Discussion The Figure 6 represents the image of a single sphere in the microchannel. The polystyrene sphere used here is a fluorescent sphere procured from Invitrogen and has an average size of ≈1 µm. It is carboxylate-modified poly- styrene microsphere coated with Nile red fluorescent material which has an emission peak at 641 nm for 532 nm excitation. Hence band pass filter (Emission 610/75 nm) is inte- grated at the front facet of the CCD. Microsphere which Copyright © 2011 SciRes. OPJ 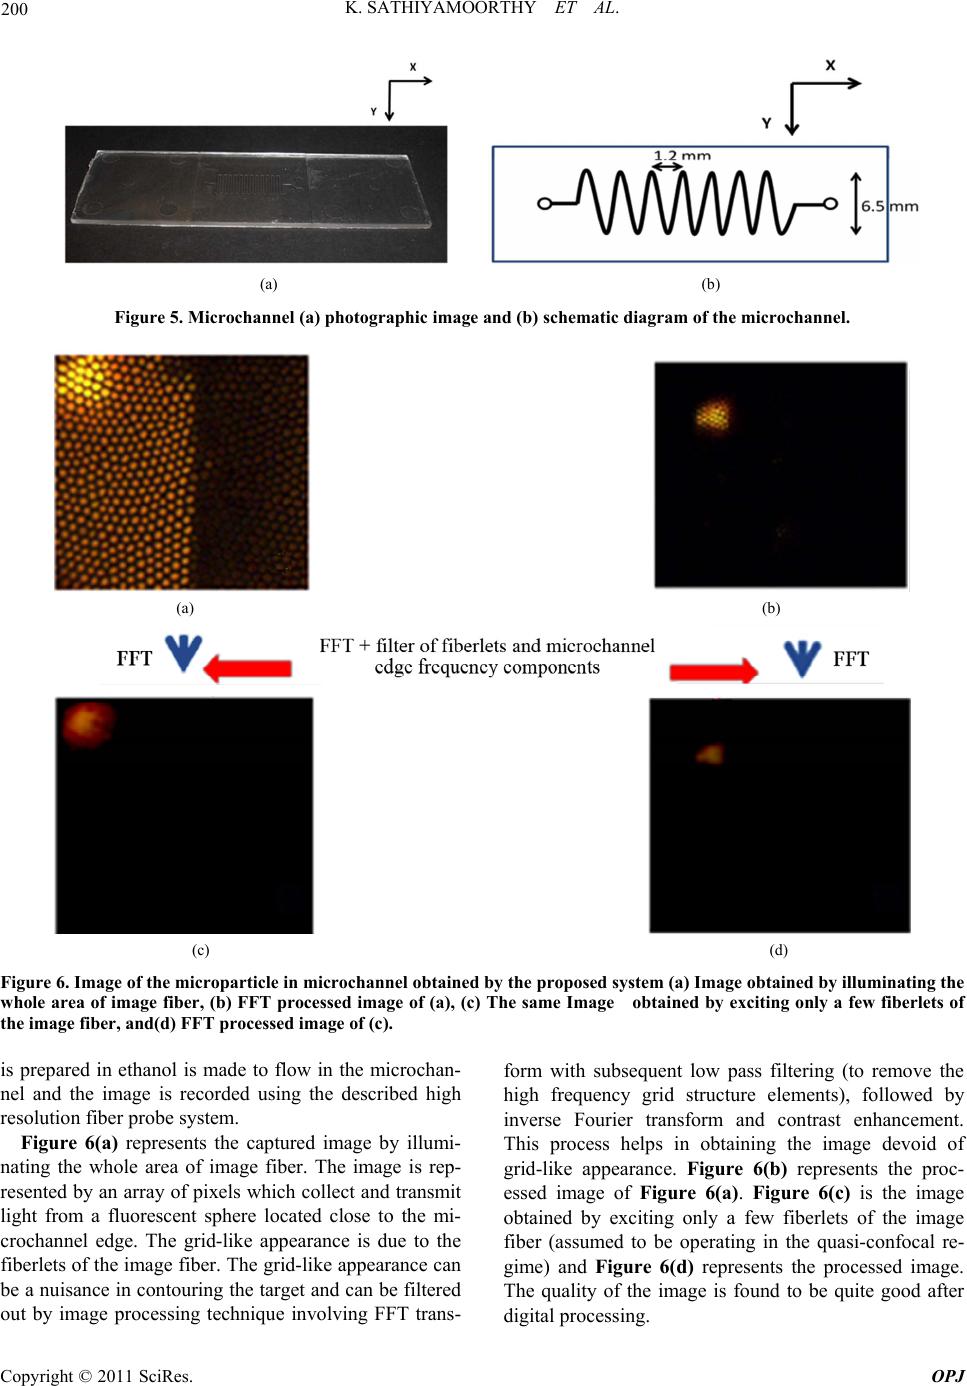 K. SATHIYAMOORTHY ET AL. Copyright © 2011 SciRes. OPJ 200 (a) (b) Figure 5. Microchannel (a) photographic image and (b) schematic diagram of the microchannel. (a) (b) (c) (d) Figure 6. Image of the microparticle in microchannel obtained by the proposed system (a) Image obtained by illuminating the whole area of image fiber, (b) FFT processed image of (a), (c) The same Image obtained by exciting only a few fiberlets of the image fiber, and(d) FFT processed image of (c ). is prepared in ethanol is made to flow in the microchan- nel and the image is recorded using the described high resolution fiber probe system. Figure 6(a) represents the captured image by illumi- nating the whole area of image fiber. The image is rep- resented by an array of pixels which collect and transmit light from a fluorescent sphere located close to the mi- crochannel edge. The grid-like appearance is due to the fiberlets of the image fiber. The grid-like appearance can be a nuisance in contouring the target and can be filtered out by image processing technique involving FFT trans- form with subsequent low pass filtering (to remove the high frequency grid structure elements), followed by inverse Fourier transform and contrast enhancement. This process helps in obtaining the image devoid of grid-like appearance. Figure 6(b) represents the proc- essed image of Figure 6(a). Figure 6(c) is the image obtained by exciting only a few fiberlets of the image fiber (assumed to be operating in the quasi-confocal re- gime) and Figure 6(d) represents the processed image. The quality of the image is found to be quite good after digital processing. 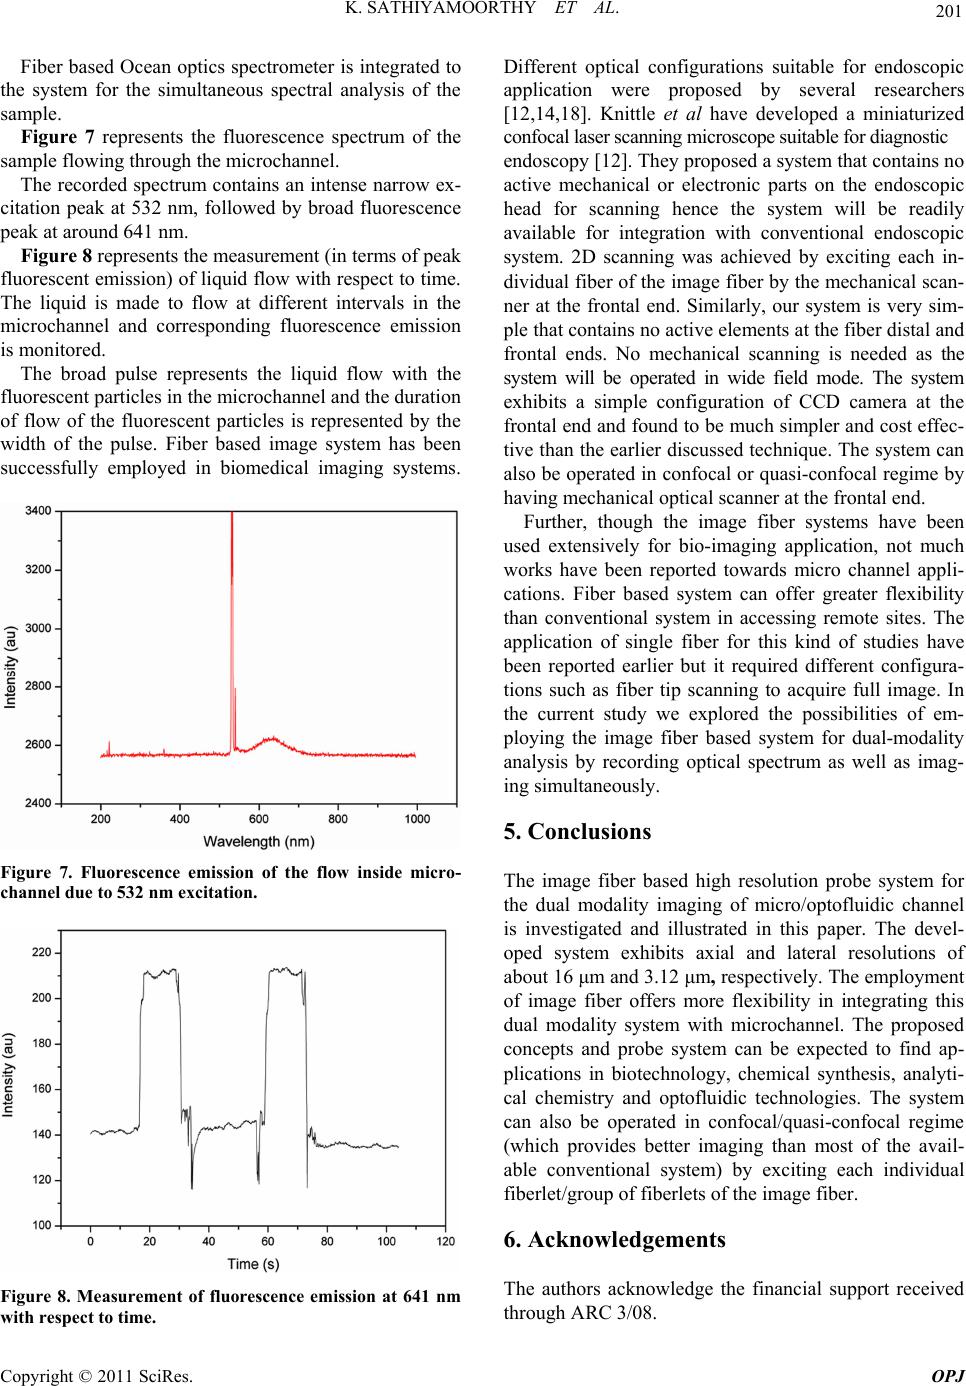 201 K. SATHIYAMOORTHY ET AL. Fiber based Ocean optics spectrometer is integrated to the system for the simultaneous spectral analysis of the sample. Figure 7 represents the fluorescence spectrum of the sample flowing through the microchannel. The recorded spectrum contains an intense narrow ex- citation peak at 532 nm, followed by broad fluorescence peak at around 641 nm. Figure 8 represents the measurement (in terms of peak fluorescent emission) of liquid flow with respect to time. The liquid is made to flow at different intervals in the microchannel and corresponding fluorescence emission is monitored. The broad pulse represents the liquid flow with the fluorescent particles in the microchannel and the duration of flow of the fluorescent particles is represented by the width of the pulse. Fiber based image system has been successfully employed in biomedical imaging systems. Figure 7. Fluorescence emission of the flow inside micro- channel due to 532 nm excitation. Figure 8. Measurement of fluorescence emission at 641 nm with respect to time. Different optical configurations suitable for endoscopic application were proposed by several researchers [12,14,18]. Knittle et al have developed a miniaturized confocal laser scanning microscope suitable for diagnostic endoscopy [12]. They proposed a system that contains no active mechanical or electronic parts on the endoscopic head for scanning hence the system will be readily available for integration with conventional endoscopic system. 2D scanning was achieved by exciting each in- dividual fiber of the image fiber by the mechanical scan- ner at the frontal end. Similarly, our system is very sim- ple that contains no active elements at the fiber distal and frontal ends. No mechanical scanning is needed as the system will be operated in wide field mode. The system exhibits a simple configuration of CCD camera at the frontal end and found to be much simpler and cost effec- tive than the earlier discussed technique. The system can also be operated in confocal or quasi-confocal regime by having mechanical optical scanner at the frontal end. Further, though the image fiber systems have been used extensively for bio-imaging application, not much works have been reported towards micro channel appli- cations. Fiber based system can offer greater flexibility than conventional system in accessing remote sites. The application of single fiber for this kind of studies have been reported earlier but it required different configura- tions such as fiber tip scanning to acquire full image. In the current study we explored the possibilities of em- ploying the image fiber based system for dual-modality analysis by recording optical spectrum as well as imag- ing simultaneously. 5. Conclusions The image fiber based high resolution probe system for the dual modality imaging of micro/optofluidic channel is investigated and illustrated in this paper. The devel- oped system exhibits axial and lateral resolutions of about 16 μm and 3.12 μm, respectively. The employment of image fiber offers more flexibility in integrating this dual modality system with microchannel. The proposed concepts and probe system can be expected to find ap- plications in biotechnology, chemical synthesis, analyti- cal chemistry and optofluidic technologies. The system can also be operated in confocal/quasi-confocal regime (which provides better imaging than most of the avail- able conventional system) by exciting each individual fiberlet/group of fiberlets of the image fiber. 6. Acknowledgements The authors acknowledge the financial support received through ARC 3/08. Copyright © 2011 SciRes. OPJ 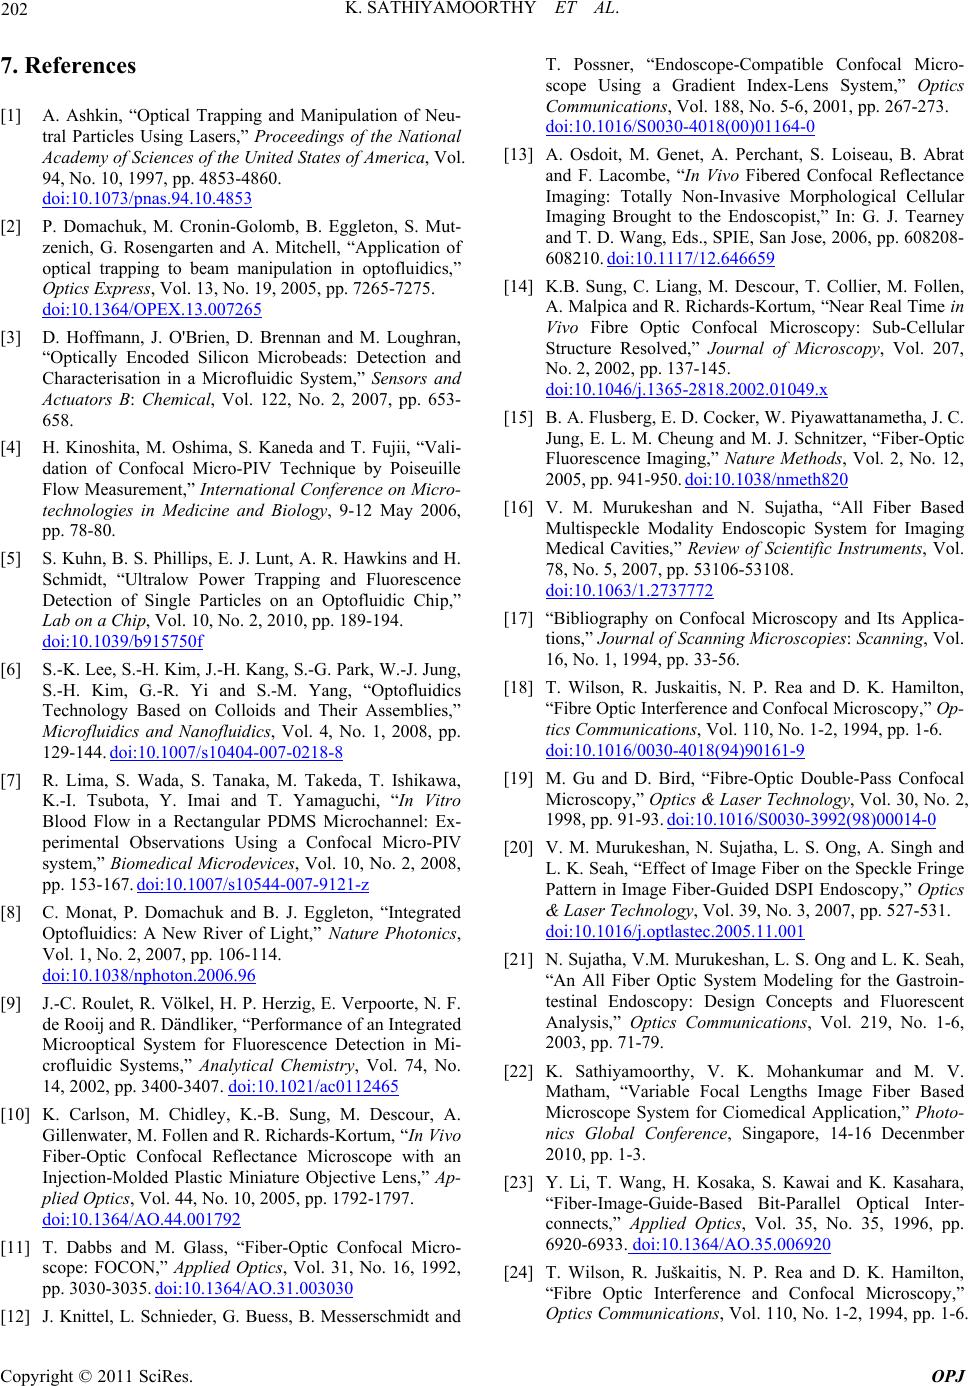 K. SATHIYAMOORTHY ET AL. 202 7. References [1] A. Ashkin, “Optical Trapping and Manipulation of Neu- tral Particles Using Lasers,” Proceedings of the National Academy of Sciences of the United States of America, Vol. 94, No. 10, 1997, pp. 4853-4860. doi:10.1073/pnas.94.10.4853 [2] P. Domachuk, M. Cronin-Golomb, B. Eggleton, S. Mut- zenich, G. Rosengarten and A. Mitchell, “Application of optical trapping to beam manipulation in optofluidics,” Optics Express, Vol. 13, No. 19, 2005, pp. 7265-7275. doi:10.1364/OPEX.13.007265 [3] D. Hoffmann, J. O'Brien, D. Brennan and M. Loughran, “Optically Encoded Silicon Microbeads: Detection and Characterisation in a Microfluidic System,” Sensors and Actuators B: Chemical, Vol. 122, No. 2, 2007, pp. 653- 658. [4] H. Kinoshita, M. Oshima, S. Kaneda and T. Fujii, “Vali- dation of Confocal Micro-PIV Technique by Poiseuille Flow Measurement,” International Conference on Micro- technologies in Medicine and Biology, 9-12 May 2006, pp. 78-80. [5] S. Kuhn, B. S. Phillips, E. J. Lunt, A. R. Hawkins and H. Schmidt, “Ultralow Power Trapping and Fluorescence Detection of Single Particles on an Optofluidic Chip,” Lab on a Chip, Vol. 10, No. 2, 2010, pp. 189-194. doi:10.1039/b915750f [6] S.-K. Lee, S.-H. Kim, J.-H. Kang, S.-G. Park, W.-J. Jung, S.-H. Kim, G.-R. Yi and S.-M. Yang, “Optofluidics Technology Based on Colloids and Their Assemblies,” Microfluidics and Nanofluidics, Vol. 4, No. 1, 2008, pp. 129-144. doi:10.1007/s10404-007-0218-8 [7] R. Lima, S. Wada, S. Tanaka, M. Takeda, T. Ishikawa, K.-I. Tsubota, Y. Imai and T. Yamaguchi, “In Vitro Blood Flow in a Rectangular PDMS Microchannel: Ex- perimental Observations Using a Confocal Micro-PIV system,” Biomedical Microdevices, Vol. 10, No. 2, 2008, pp. 153-167. doi:10.1007/s10544-007-9121-z [8] C. Monat, P. Domachuk and B. J. Eggleton, “Integrated Optofluidics: A New River of Light,” Nature Photonics, Vol. 1, No. 2, 2007, pp. 106-114. doi:10.1038/nphoton.2006.96 [9] J.-C. Roulet, R. Völkel, H. P. Herzig, E. Verpoorte, N. F. de Rooij and R. Dändliker, “Performance of an Integrated Microoptical System for Fluorescence Detection in Mi- crofluidic Systems,” Analytical Chemistry, Vol. 74, No. 14, 2002, pp. 3400-3407. doi:10.1021/ac0112465 [10] K. Carlson, M. Chidley, K.-B. Sung, M. Descour, A. Gillenwater, M. Follen and R. Richards-Kortum, “In Vivo Fiber-Optic Confocal Reflectance Microscope with an Injection-Molded Plastic Miniature Objective Lens,” Ap- plied Optics, Vol. 44, No. 10, 2005, pp. 1792-1797. doi:10.1364/AO.44.001792 [11] T. Dabbs and M. Glass, “Fiber-Optic Confocal Micro- scope: FOCON,” Applied Optics, Vol. 31, No. 16, 1992, pp. 3030-3035. doi:10.1364/AO.31.003030 [12] J. Knittel, L. Schnieder, G. Buess, B. Messerschmidt and T. Possner, “Endoscope-Compatible Confocal Micro- scope Using a Gradient Index-Lens System,” Optics Communications, Vol. 188, No. 5-6, 2001, pp. 267-273. doi:10.1016/S0030-4018(00)01164-0 [13] A. Osdoit, M. Genet, A. Perchant, S. Loiseau, B. Abrat and F. Lacombe, “In Vivo Fibered Confocal Reflectance Imaging: Totally Non-Invasive Morphological Cellular Imaging Brought to the Endoscopist,” In: G. J. Tearney and T. D. Wang, Eds., SPIE, San Jose, 2006, pp. 608208- 608210. doi:10.1117/12.646659 [14] K.B. Sung, C. Liang, M. Descour, T. Collier, M. Follen, A. Malpica and R. Richards-Kortum, “Near Real Time in Vivo Fibre Optic Confocal Microscopy: Sub-Cellular Structure Resolved,” Journal of Microscopy, Vol. 207, No. 2, 2002, pp. 137-145. doi:10.1046/j.1365-2818.2002.01049.x [15] B. A. Flusberg, E. D. Cocker, W. Piyawattanametha, J. C. Jung, E. L. M. Cheung and M. J. Schnitzer, “Fiber-Optic Fluorescence Imaging,” Nature Methods, Vol. 2, No. 12, 2005, pp. 941-950. doi:10.1038/nmeth820 [16] V. M. Murukeshan and N. Sujatha, “All Fiber Based Multispeckle Modality Endoscopic System for Imaging Medical Cavities,” Review of Scientific Instruments, Vol. 78, No. 5, 2007, pp. 53106-53108. doi:10.1063/1.2737772 [17] “Bibliography on Confocal Microscopy and Its Applica- tions,” Journal of Scanning Microscopies: Scanning, Vol. 16, No. 1, 1994, pp. 33-56. [18] T. Wilson, R. Juskaitis, N. P. Rea and D. K. Hamilton, “Fibre Optic Interference and Confocal Microscopy,” Op- tics Communications, Vol. 110, No. 1-2, 1994, pp. 1-6. doi:10.1016/0030-4018(94)90161-9 [19] M. Gu and D. Bird, “Fibre-Optic Double-Pass Confocal Microscopy,” Optics & Laser Technology, Vol. 30, No. 2, 1998, pp. 91-93. doi:10.1016/S0030-3992(98)00014-0 [20] V. M. Murukeshan, N. Sujatha, L. S. Ong, A. Singh and L. K. Seah, “Effect of Image Fiber on the Speckle Fringe Pattern in Image Fiber-Guided DSPI Endoscopy,” Optics & Laser Technology, Vol. 39, No. 3, 2007, pp. 527-531. doi:10.1016/j.optlastec.2005.11.001 [21] N. Sujatha, V.M. Murukeshan, L. S. Ong and L. K. Seah, “An All Fiber Optic System Modeling for the Gastroin- testinal Endoscopy: Design Concepts and Fluorescent Analysis,” Optics Communications, Vol. 219, No. 1-6, 2003, pp. 71-79. [22] K. Sathiyamoorthy, V. K. Mohankumar and M. V. Matham, “Variable Focal Lengths Image Fiber Based Microscope System for Ciomedical Application,” Photo- nics Global Conference, Singapore, 14-16 Decenmber 2010, pp. 1-3. [23] Y. Li, T. Wang, H. Kosaka, S. Kawai and K. Kasahara, “Fiber-Image-Guide-Based Bit-Parallel Optical Inter- connects,” Applied Optics, Vol. 35, No. 35, 1996, pp. 6920-6933. doi:10.1364/AO.35.006920 [24] T. Wilson, R. Juškaitis, N. P. Rea and D. K. Hamilton, “Fibre Optic Interference and Confocal Microscopy,” Optics Communications, Vol. 110, No. 1-2, 1994, pp. 1-6. Copyright © 2011 SciRes. OPJ  K. SATHIYAMOORTHY ET AL. Copyright © 2011 SciRes. OPJ 203 doi:10.1016/0030-4018(94)90161-9 [25] J. B. Pawley and B. R. Masters, “Handbook of Biological Confocal Microscopy,” 3rd Edition, Journal of Biomedi- cal Optics, Vol. 13, No. 2, 2008, pp. 29902-29903. doi:10.1117/1.2911629 [26] K. C. Maitland, H. J. Shin, H. Ra, D. Lee, O. Solgaard and R. Richards-Kortum, “Single Fiber Confocal Micro- scope with a Two-Axis Gimbaled MEMS Scanner for Cellular Imaging,” Optics Express, Vol. 14, No. 19, 2006, pp. 8604-8612. doi:10.1364/OE.14.008604 |