

Paper Menu >>
Journal Menu >>
 Journal of Software Engineering and Applications, 2011, 4, 710-717 doi:10.4236/jsea.2011.412083 Published Online December 2011 (http://www.SciRP.org/journal/jsea) Copyright © 2011 SciRes. JSEA Power-Law Distributions in Hard Drive Behavior Dominik Strzałka, Piotr Szurlej Department of Distributed Systems, Rzeszów University of Technology, Rzeszów, Poland. Email: [email protected], [email protected] Received September 13th, 2011; revised October 21st, 2011; accepted November 7th, 2011. ABSTRACT Taking into account the fact that the computer systems, as the implementations of Turing machine, are physical devices, the paper shows considerations in which hard drive behavior will be presented in terms of statistical mechanics. Be- cause computer is a machine, its analysis cannot be based only on mathematical models apart of physical conditions. In the paper it will be presented a very narrow part this problem—an analysis of hard drive behavior in the context of the power-law distributions. We will focus only on four selected hard drive parameters, i.e. the rate of transfer bytes to or from the disk during the read or write, the number of pending requests to the disk and the rate of read operations. Our research was performed under the Windows operating system and this allows to make a statistical analysis for the pos- sible occurrence of power-laws representing the lack of characteristic scale for considered processes. This property will be confirmed in all analyzed cases. A presented study can help describing the behavior of the whole computer sys- tem in terms of physics of computer processing. Keywords: Power Laws, Hard Drive Behavior, Performance Monitor, Windows Operating System, Physics of Computer Processing 1. Introduction It can be observed that nowadays a high computing power and the great possible efficiency are required from mod- ern computer systems. This applies not only to special- ized computers, but also to personal ones. As a rule, this problem is realized by the increase of the processor clock frequency or by the number of its cores, eventually by the memory capacity expansion. Meanwhile, the com- puter system exhibits the characteristics of the complex systems and hence its parameters are not merely the sum of the features of individual components, but the results of both: the characteristics of these elements properties and the phenomena (processes) that occur inside them as well. There is no doubt that the computer system, as the implementation of Turing machine, is a physical device, which is governed by the laws of physics. Because it’s a machine in which the processing can be considered as a transformation of energy for a useful form of work (that is for example to perform calculations), its analysis can- not be based only on mathematical models apart of phy- sical conditions. The considerations and results of research presented in this paper will be related to the wide context of systems analysis. Taking into account the historical background it can be said that the problem of each system analysis can be based on two possible approaches. The first one (and so far the most popular) is the approach based on the rules given by Rene Descartes, who in his Discourse de la methode [1] proposed a rule that can be related to the ancient Romans: divide and conquer [2]. In the case of systems analysis this require to divide each system into parts (subsystems), analyze their behavior and basing on this making a simple sum of part components properties to have the picture of the whole system. But nowadays it is known [3-5] that this approach can be used only in the case of simple systems. On the other hand we have sys- tems that can be considered as the complex ones. In the case of these ones we can said, according to Aristotle [6], that they follow a rule in which the whole is more that a sum of its parts. For such systems it’s not only important what kind of properties exist for each of their parts but also how they act together [2]. In the case of computer systems such an approach can be also used—this is sug- gested by their complexity: for example this fact was noted by Dijkstra [7] and Murray Gell-Mann [4]. Thus in this paper this approach will be taken it in the case of hard drive behavior analysis. Obviously, only a part of this more general problem will be shown, but presented considerations will be related to a different approach than the so far is usually taken where the hard disks behavior (and further performance) is related only to their physical 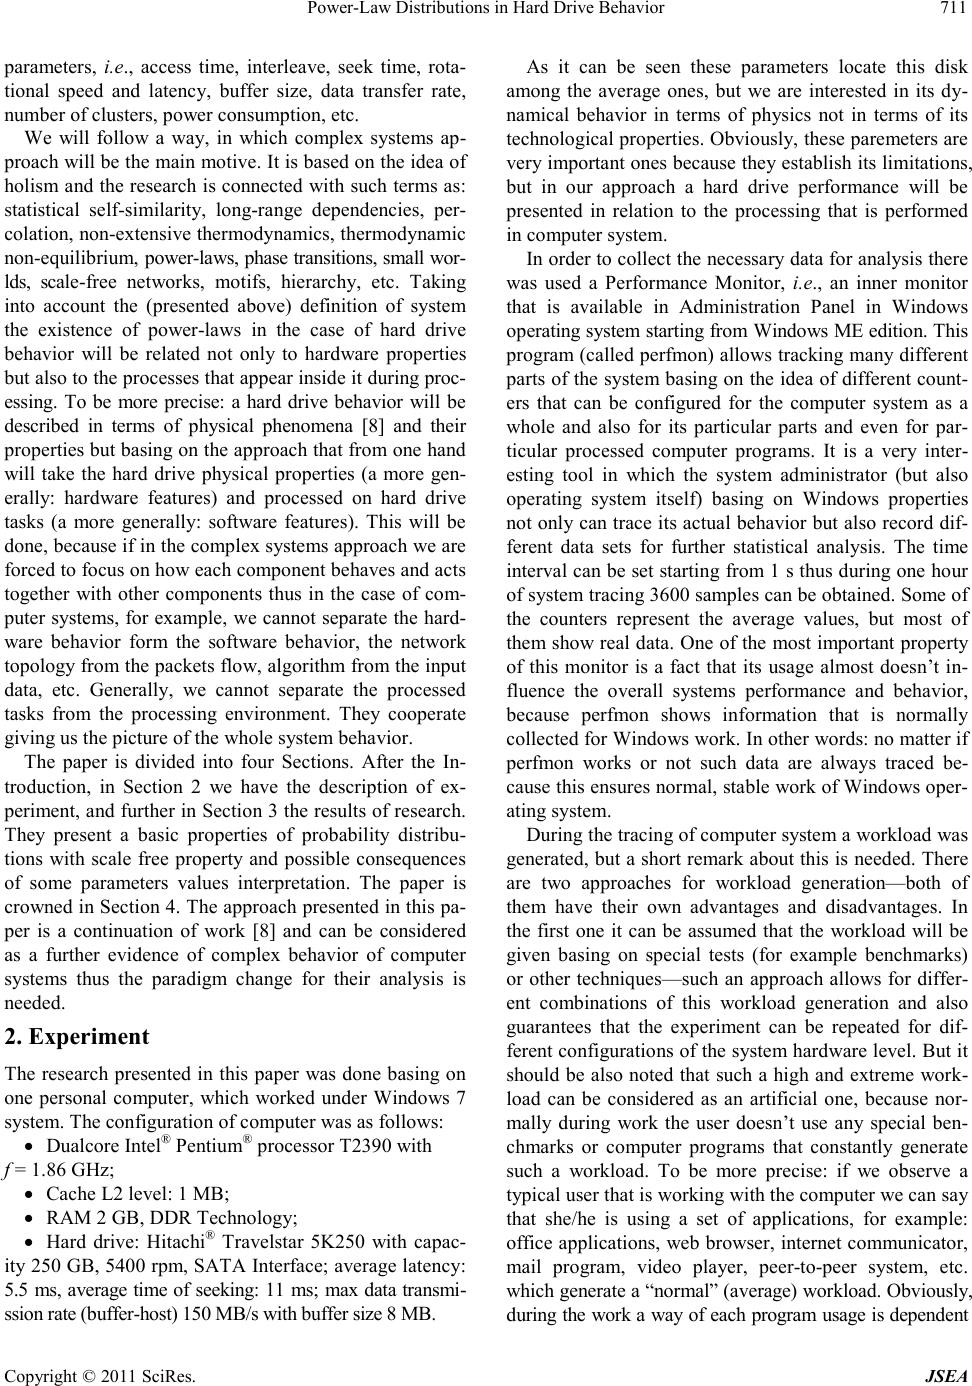 Power-Law Distributions in Hard Drive Behavior711 parameters, i.e., access time, interleave, seek time, rota- tional speed and latency, buffer size, data transfer rate, number of clusters, power consumption, etc. We will follow a way, in which complex systems ap- proach will be the main motive. It is based on the idea of holism and the research is connected with such terms as: statistical self-similarity, long-range dependencies, per- colation, non-extensive thermodynamics, thermodynamic non-equilibrium, power-laws, phase transitions, small wor- lds, scale-free networks, motifs, hierarchy, etc. Taking into account the (presented above) definition of system the existence of power-laws in the case of hard drive behavior will be related not only to hardware properties but also to the processes that appear inside it during proc- essing. To be more precise: a hard drive behavior will be described in terms of physical phenomena [8] and their properties but basing on the approach that from one hand will take the hard drive physical properties (a more gen- erally: hardware features) and processed on hard drive tasks (a more generally: software features). This will be done, because if in the complex systems approach we are forced to focus on how each component behaves and acts together with other components thus in the case of com- puter systems, for example, we cannot separate the hard- ware behavior form the software behavior, the network topology from the packets flow, algorithm from the input data, etc. Generally, we cannot separate the processed tasks from the processing environment. They cooperate giving us the picture of the whole system behavior. The paper is divided into four Sections. After the In- troduction, in Section 2 we have the description of ex- periment, and further in Section 3 the results of research. They present a basic properties of probability distribu- tions with scale free property and possible consequences of some parameters values interpretation. The paper is crowned in Section 4. The approach presented in this pa- per is a continuation of work [8] and can be considered as a further evidence of complex behavior of computer systems thus the paradigm change for their analysis is needed. 2. Experiment The research presented in this paper was done basing on one personal computer, which worked under Windows 7 system. The configuration of computer was as follows: Dualcore Intel® Pentium® processor T2390 with f = 1.86 GHz; Cache L2 level: 1 MB; RAM 2 GB, DDR Technology; Hard drive: Hitachi® Travelstar 5K250 with capac- ity 250 GB, 5400 rpm, SATA Interface; average latency: 5.5 ms, average time of seeking: 11 ms; max data transmi- ssion rate (buffer-host) 150 MB/s with buffer size 8 MB. As it can be seen these parameters locate this disk among the average ones, but we are interested in its dy- namical behavior in terms of physics not in terms of its technological properties. Obviously, these paremeters are very important ones because they establish its limitations, but in our approach a hard drive performance will be presented in relation to the processing that is performed in computer system. In order to collect the necessary data for analysis there was used a Performance Monitor, i.e., an inner monitor that is available in Administration Panel in Windows operating system starting from Windows ME edition. This program (called perfmon) allows tracking many different parts of the system basing on the idea of different count- ers that can be configured for the computer system as a whole and also for its particular parts and even for par- ticular processed computer programs. It is a very inter- esting tool in which the system administrator (but also operating system itself) basing on Windows properties not only can trace its actual behavior but also record dif- ferent data sets for further statistical analysis. The time interval can be set starting from 1 s thus during one hour of system tracing 3600 samples can be obtained. Some of the counters represent the average values, but most of them show real data. One of the most important property of this monitor is a fact that its usage almost doesn’t in- fluence the overall systems performance and behavior, because perfmon shows information that is normally collected for Windows work. In other words: no matter if perfmon works or not such data are always traced be- cause this ensures normal, stable work of Windows oper- ating system. During the tracing of computer system a workload was generated, but a short remark about this is needed. There are two approaches for workload generation—both of them have their own advantages and disadvantages. In the first one it can be assumed that the workload will be given basing on special tests (for example benchmarks) or other techniques—such an approach allows for differ- ent combinations of this workload generation and also guarantees that the experiment can be repeated for dif- ferent configurations of the system hardware level. But it should be also noted that such a high and extreme work- load can be considered as an artificial one, because nor- mally during work the user doesn’t use any special ben- chmarks or computer programs that constantly generate such a workload. To be more precise: if we observe a typical user that is working with the computer we can say that she/he is using a set of applications, for example: office applications, web browser, internet communicator, mail program, video player, peer-to-peer system, etc. which generate a “normal” (average) workload. Obviously, during the work a way of each program usage is dependent Copyright © 2011 SciRes. JSEA 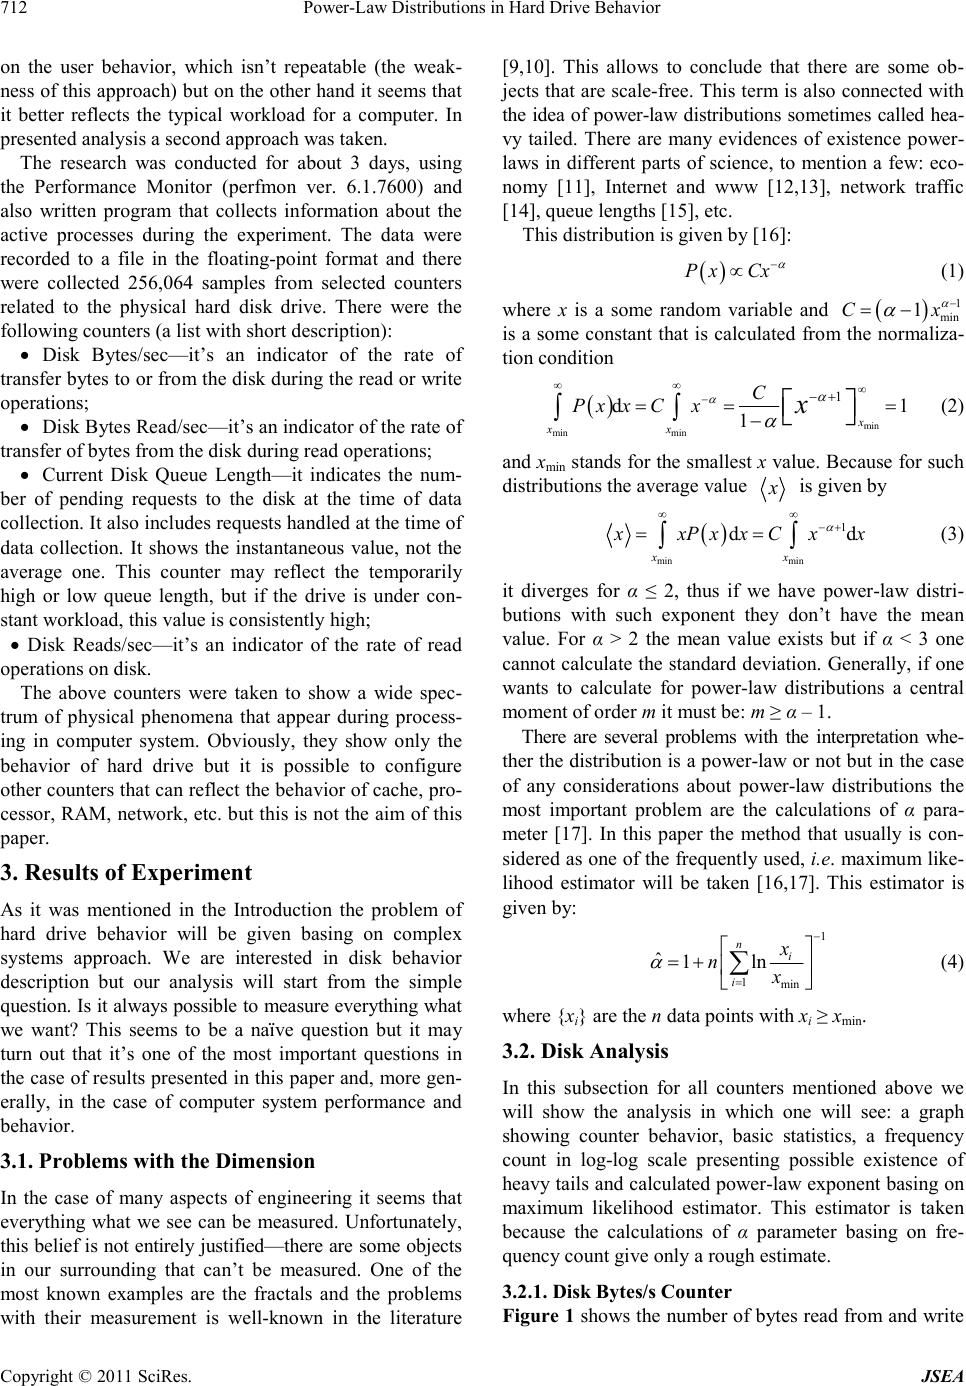 Power-Law Distributions in Hard Drive Behavior 712 on the user behavior, which isn’t repeatable (the weak- ness of this approach) but on the other hand it seems that it better reflects the typical workload for a computer. In presented analysis a second approach was taken. The research was conducted for about 3 days, using the Performance Monitor (perfmon ver. 6.1.7600) and also written program that collects information about the active processes during the experiment. The data were recorded to a file in the floating-point format and there were collected 256,064 samples from selected counters related to the physical hard disk drive. There were the following counters (a list with short description): Disk Bytes/sec—it’s an indicator of the rate of transfer bytes to or from the disk during the read or write operations; Disk Bytes Read/sec—it’s an indicator of the rate of transfer of bytes from the disk during read operations; Current Disk Queue Length—it indicates the num- ber of pending requests to the disk at the time of data collection. It also includes requests handled at the time of data collection. It shows the instantaneous value, not the average one. This counter may reflect the temporarily high or low queue length, but if the drive is under con- stant workload, this value is consistently high; Disk Reads/sec—it’s an indicator of the rate of read operations on disk. The above counters were taken to show a wide spec- trum of physical phenomena that appear during process- ing in computer system. Obviously, they show only the behavior of hard drive but it is possible to configure other counters that can reflect the behavior of cache, pro- cessor, RAM, network, etc. but this is not the aim of this paper. 3. Results of Experiment As it was mentioned in the Introduction the problem of hard drive behavior will be given basing on complex systems approach. We are interested in disk behavior description but our analysis will start from the simple question. Is it always possible to measure everything what we want? This seems to be a naïve question but it may turn out that it’s one of the most important questions in the case of results presented in this paper and, more gen- erally, in the case of computer system performance and behavior. 3.1. Problems with the Dimension In the case of many aspects of engineering it seems that everything what we see can be measured. Unfortunately, this belief is not entirely justified—there are some objects in our surrounding that can’t be measured. One of the most known examples are the fractals and the problems with their measurement is well-known in the literature [9,10]. This allows to conclude that there are some ob- jects that are scale-free. This term is also connected with the idea of power-law distributions sometimes called hea- vy tailed. There are many evidences of existence power- laws in different parts of science, to mention a few: eco- nomy [11], Internet and www [12,13], network traffic [14], queue lengths [15], etc. This distribution is given by [16]: Px Cx (1) where x is a some random variable and 1 min 1Cx is a some constant that is calculated from the normaliza- tion condition min min min 1 d1 1x xx C Px xCxx (2) and xmin stands for the smallest x value. Because for such distributions the average value x is given by min min 1 d xx xxPxxCx dx (3) it diverges for α ≤ 2, thus if we have power-law distri- butions with such exponent they don’t have the mean value. For α > 2 the mean value exists but if α < 3 one cannot calculate the standard deviation. Generally, if one wants to calculate for power-law distributions a central moment of order m it must be: m ≥ α – 1. There are several problems with the interpretation whe- ther the distribution is a power-law or not but in the case of any considerations about power-law distributions the most important problem are the calculations of α para- meter [17]. In this paper the method that usually is con- sidered as one of the frequently used, i.e. maximum like- lihood estimator will be taken [16,17]. This estimator is given by: 1 1min ˆ1ln n i i x nx (4) where {xi} are the n data points with xi ≥ xmin. 3.2. Disk Analysis In this subsection for all counters mentioned above we will show the analysis in which one will see: a graph showing counter behavior, basic statistics, a frequency count in log-log scale presenting possible existence of heavy tails and calculated power-law exponent basing on maximum likelihood estimator. This estimator is taken because the calculations of α parameter basing on fre- quency count give only a rough estimate. 3.2.1. Disk Bytes/s Counter Figure 1 shows the number of bytes read from and write Copyright © 2011 SciRes. JSEA 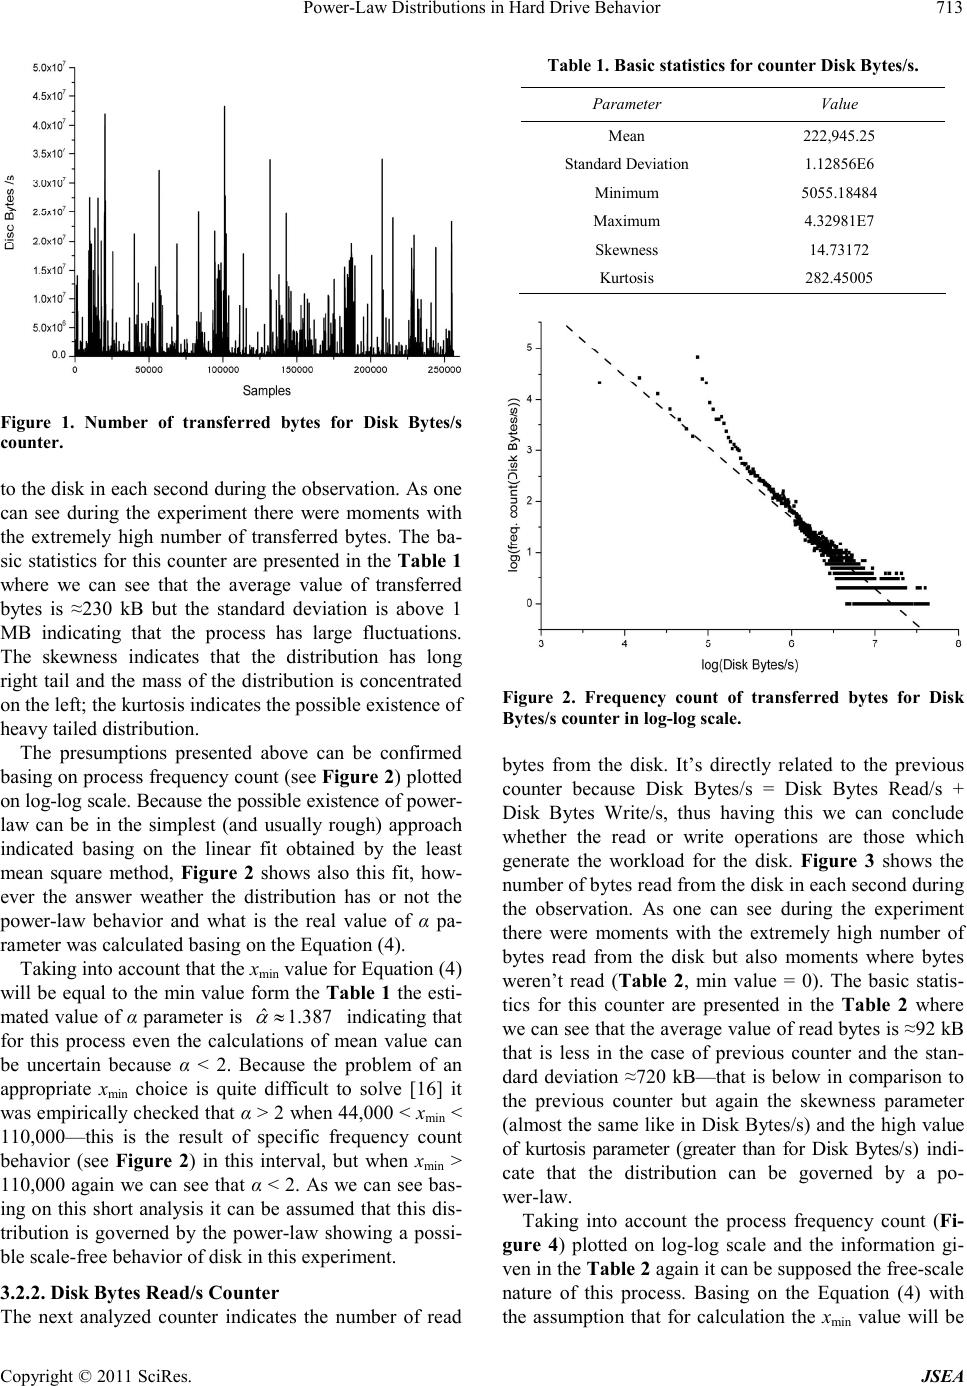 Power-Law Distributions in Hard Drive Behavior713 Figure 1. Number of transferred bytes for Disk Bytes/s counter. to the disk in each second during the observation. As one can see during the experiment there were moments with the extremely high number of transferred bytes. The ba- sic statistics for this counter are presented in the Table 1 where we can see that the average value of transferred bytes is ≈230 kB but the standard deviation is above 1 MB indicating that the process has large fluctuations. The skewness indicates that the distribution has long right tail and the mass of the distribution is concentrated on the left; the kurtosis indicates the possible existence of heavy tailed distribution. The presumptions presented above can be confirmed basing on process frequency count (see Figure 2) plotted on log-log scale. Because the possible existence of power- law can be in the simplest (and usually rough) approach indicated basing on the linear fit obtained by the least mean square method, Figure 2 shows also this fit, how- ever the answer weather the distribution has or not the power-law behavior and what is the real value of α pa- rameter was calculated basing on the Equation (4). Taking into account that the xmin value for Equation (4) will be equal to the min value form the Table 1 the esti- mated value of α parameter is indicating that for this process even the calculations of mean value can be uncertain because α < 2. Because the problem of an appropriate xmin choice is quite difficult to solve [16] it was empirically checked that α > 2 when 44,000 < xmin < 110,000—this is the result of specific frequency count behavior (see Figure 2) in this interval, but when xmin > 110,000 again we can see that α < 2. As we can see bas- ing on this short analysis it can be assumed that this dis- tribution is governed by the power-law showing a possi- ble scale-free behavior of disk in this experiment. ˆ1.387 3.2.2. Disk Bytes Read/s Counter The next analyzed counter indicates the number of read Table 1. Basic statistics for counter Disk Bytes/s. Parameter Value Mean 222,945.25 Standard Deviation 1.12856E6 Minimum 5055.18484 Maximum 4.32981E7 Skewness 14.73172 Kurtosis 282.45005 Figure 2. Frequency count of transferred bytes for Disk Bytes/s counter in log-log scale. bytes from the disk. It’s directly related to the previous counter because Disk Bytes/s = Disk Bytes Read/s + Disk Bytes Write/s, thus having this we can conclude whether the read or write operations are those which generate the workload for the disk. Figure 3 shows the number of bytes read from the disk in each second during the observation. As one can see during the experiment there were moments with the extremely high number of bytes read from the disk but also moments where bytes weren’t read (Table 2, min value = 0). The basic statis- tics for this counter are presented in the Table 2 where we can see that the average value of read bytes is ≈92 kB that is less in the case of previous counter and the stan- dard deviation ≈720 kB—that is below in comparison to the previous counter but again the skewness parameter (almost the same like in Disk Bytes/s) and the high value of kurtosis parameter (greater than for Disk Bytes/s) indi- cate that the distribution can be governed by a po- wer-law. Taking into account the process frequency count (Fi- gure 4) plotted on log-log scale and the information gi- ven in the Table 2 again it can be supposed the free-scale nature of this process. Basing on the Equation (4) with the assumption that for calculation the xmin value will be Copyright © 2011 SciRes. JSEA 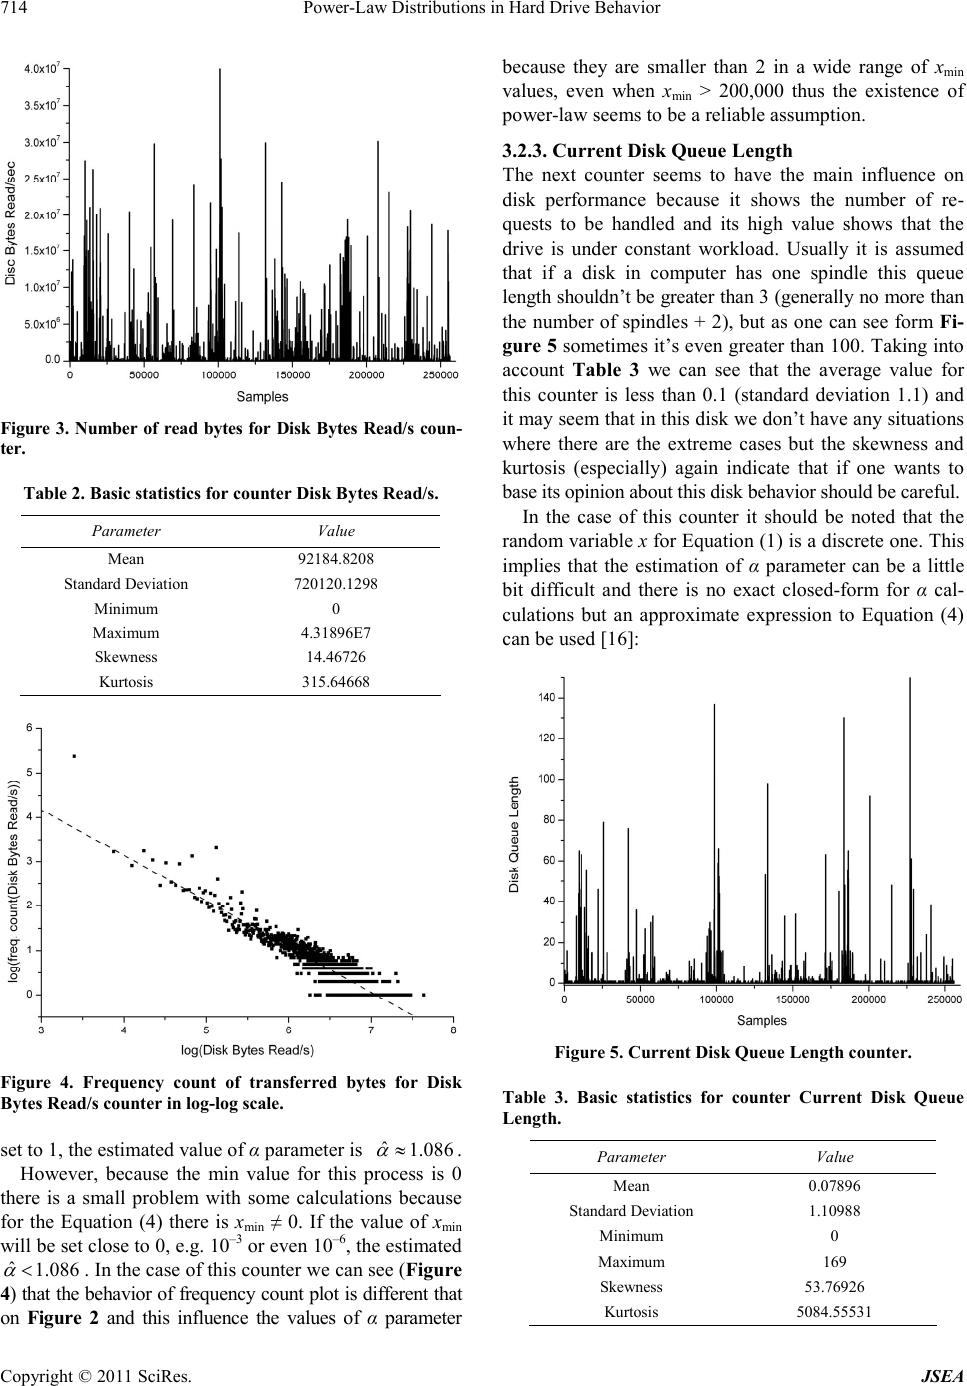 Power-Law Distributions in Hard Drive Behavior 714 Figure 3. Number of read bytes for Disk Bytes Read/s coun- ter. Table 2. Basic statistics for counter Disk Bytes Read/s. Parameter Value Mean 92184.8208 Standard Deviation 720120.1298 Minimum 0 Maximum 4.31896E7 Skewness 14.46726 Kurtosis 315.64668 Figure 4. Frequency count of transferred bytes for Disk Bytes Read/s counter in log-log scale. set to 1, the estimated value of α parameter is . ˆ1.086 However, because the min value for this process is 0 there is a small problem with some calculations because for the Equation (4) there is xmin ≠ 0. If the value of xmin will be set close to 0, e.g. 10–3 or even 10–6, the estimated . In the case of this counter we can see (Figure 4) that the behavior of frequency count plot is different that on Figure 2 and this influence the values of α parameter because they are smaller than 2 in a wide range of xmi n values, even when xmin > 200,000 thus the existence of power-law seems to be a reliable assumption. ˆ1.086 3.2.3. Current Disk Queue Length The next counter seems to have the main influence on disk performance because it shows the number of re- quests to be handled and its high value shows that the drive is under constant workload. Usually it is assumed that if a disk in computer has one spindle this queue length shouldn’t be greater than 3 (generally no more than the number of spindles + 2), but as one can see form Fi- gure 5 sometimes it’s even greater than 100. Taking into account Table 3 we can see that the average value for this counter is less than 0.1 (standard deviation 1.1) and it may seem that in this disk we don’t have any situations where there are the extreme cases but the skewness and kurtosis (especially) again indicate that if one wants to base its opinion about this disk behavior should be careful. In the case of this counter it should be noted that the random variable x for Equation (1) is a discrete one. This implies that the estimation of α parameter can be a little bit difficult and there is no exact closed-form for α cal- culations but an approximate expression to Equation (4) can be used [16]: Figure 5. Current Disk Queue Length counter. Table 3. Basic statistics for counter Current Disk Queue Length. Parameter Value Mean 0.07896 Standard Deviation 1.10988 Minimum 0 Maximum 169 Skewness 53.76926 Kurtosis 5084.55531 Copyright © 2011 SciRes. JSEA 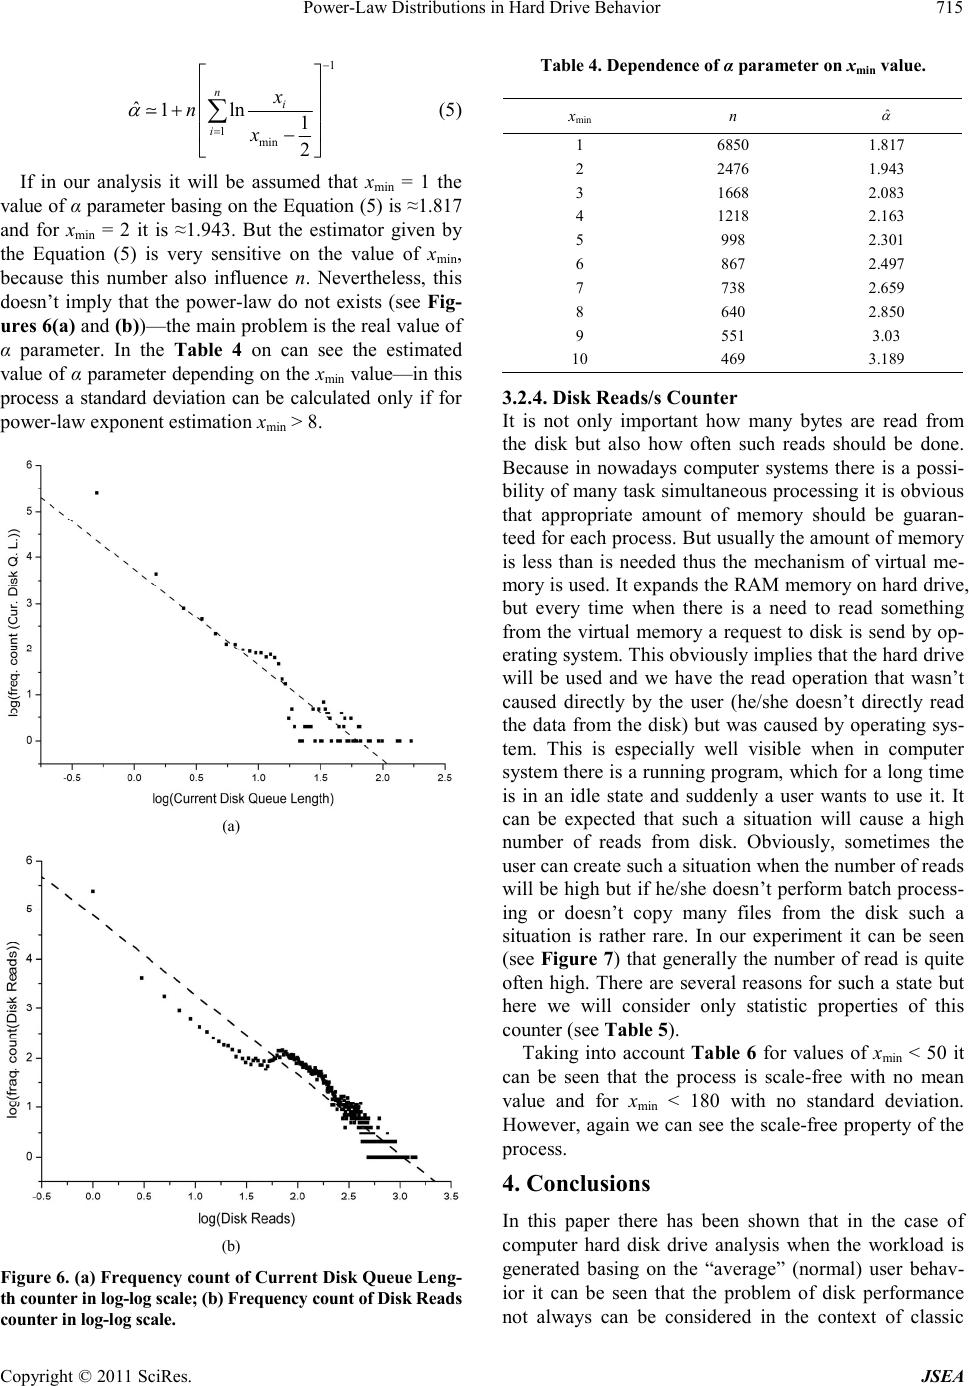 Power-Law Distributions in Hard Drive Behavior715 1 1 min ˆ1ln 1 2 n i i x n x (5) If in our analysis it will be assumed that xmin = 1 the value of α parameter basing on the Equation (5) is ≈1.817 and for xmin = 2 it is ≈1.943. But the estimator given by the Equation (5) is very sensitive on the value of xmin, because this number also influence n. Nevertheless, this doesn’t imply that the power-law do not exists (see Fig- ures 6(a) and (b))—the main problem is the real value of α parameter. In the Table 4 on can see the estimated value of α parameter depending on the xmin value—in this process a standard deviation can be calculated only if for power-law exponent estimation xmin > 8. (a) (b) Figure 6. (a) Frequency count of Current Disk Queue Leng- th counter in log-log scale; (b) Frequency count of Disk Reads counter in log-log scale. Table 4. Dependence of α parameter on xmin value. xmin n ˆ 1 6850 1.817 2 2476 1.943 3 1668 2.083 4 1218 2.163 5 998 2.301 6 867 2.497 7 738 2.659 8 640 2.850 9 551 3.03 10 469 3.189 3.2.4. Disk Reads/s Counter It is not only important how many bytes are read from the disk but also how often such reads should be done. Because in nowadays computer systems there is a possi- bility of many task simultaneous processing it is obvious that appropriate amount of memory should be guaran- teed for each process. But usually the amount of memory is less than is needed thus the mechanism of virtual me- mory is used. It expands the RAM memory on hard drive, but every time when there is a need to read something from the virtual memory a request to disk is send by op- erating system. This obviously implies that the hard drive will be used and we have the read operation that wasn’t caused directly by the user (he/she doesn’t directly read the data from the disk) but was caused by operating sys- tem. This is especially well visible when in computer system there is a running program, which for a long time is in an idle state and suddenly a user wants to use it. It can be expected that such a situation will cause a high number of reads from disk. Obviously, sometimes the user can create such a situation when the number of reads will be high but if he/she doesn’t perform batch process- ing or doesn’t copy many files from the disk such a situation is rather rare. In our experiment it can be seen (see Figure 7) that generally the number of read is quite often high. There are several reasons for such a state but here we will consider only statistic properties of this counter (see Table 5). Taking into account Table 6 for values of xmin < 50 it can be seen that the process is scale-free with no mean value and for xmin < 180 with no standard deviation. However, again we can see the scale-free property of the process. 4. Conclusions In this paper there has been shown that in the case of computer hard disk drive analysis when the workload is generated basing on the “average” (normal) user behav- ior it can be seen that the problem of disk performance not always can be considered in the context of classic Copyright © 2011 SciRes. JSEA 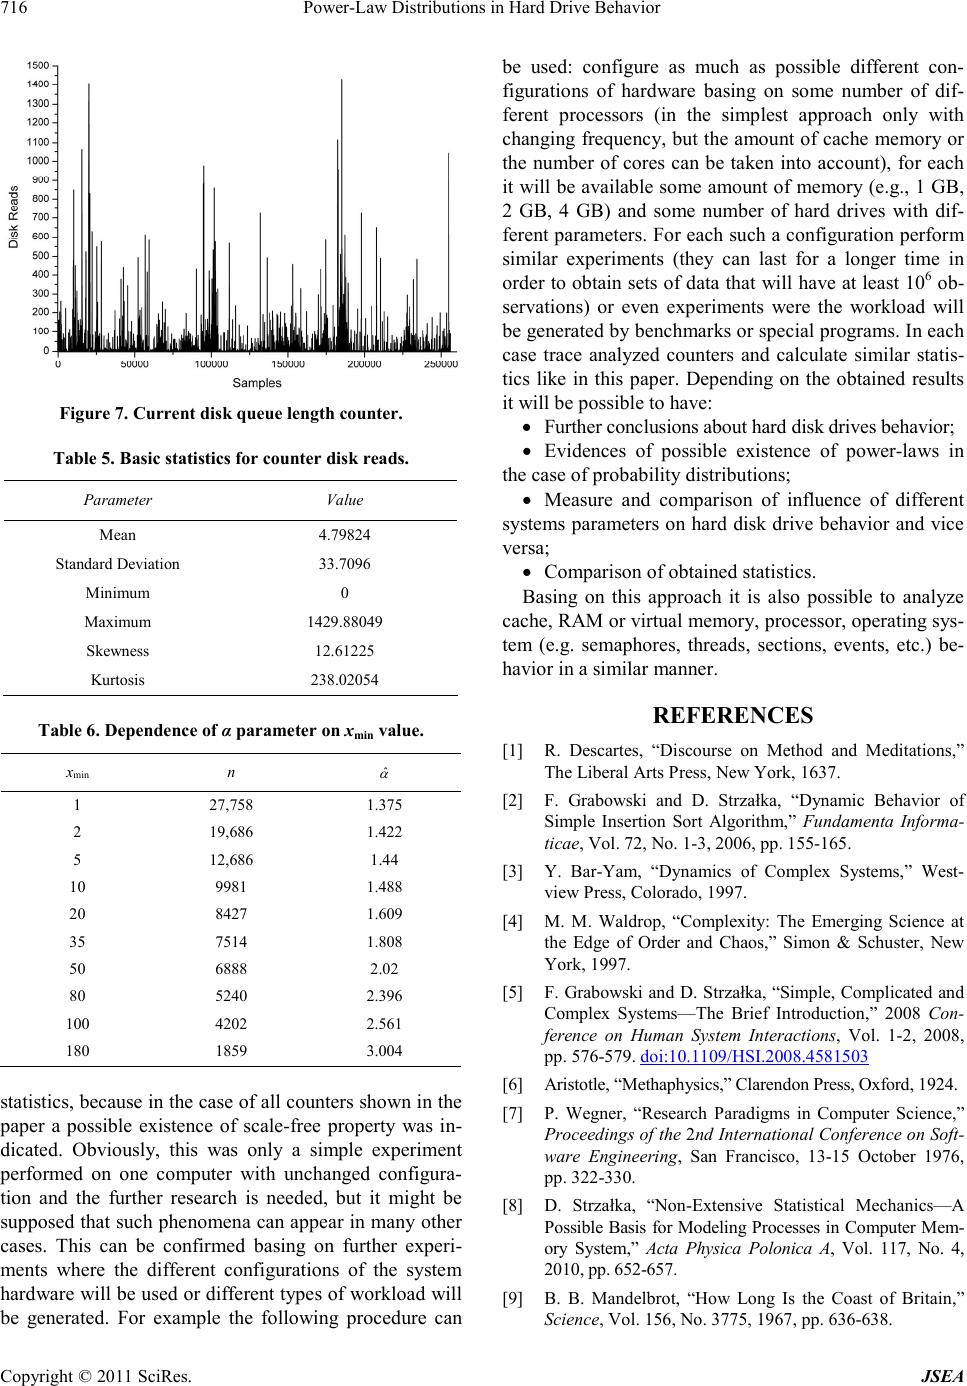 Power-Law Distributions in Hard Drive Behavior 716 Figure 7. Current disk queue length counter. Table 5. Basic statistics for counter disk reads. Parameter Value Mean 4.79824 Standard Deviation 33.7096 Minimum 0 Maximum 1429.88049 Skewness 12.61225 Kurtosis 238.02054 Table 6. Dependence of α parameter on xmin value. xmin n ˆ 1 27,758 1.375 2 19,686 1.422 5 12,686 1.44 10 9981 1.488 20 8427 1.609 35 7514 1.808 50 6888 2.02 80 5240 2.396 100 4202 2.561 180 1859 3.004 statistics, because in the case of all counters shown in the paper a possible existence of scale-free property was in- dicated. Obviously, this was only a simple experiment performed on one computer with unchanged configura- tion and the further research is needed, but it might be supposed that such phenomena can appear in many other cases. This can be confirmed basing on further experi- ments where the different configurations of the system hardware will be used or different types of workload will be generated. For example the following procedure can be used: configure as much as possible different con- figurations of hardware basing on some number of dif- ferent processors (in the simplest approach only with changing frequency, but the amount of cache memory or the number of cores can be taken into account), for each it will be available some amount of memory (e.g., 1 GB, 2 GB, 4 GB) and some number of hard drives with dif- ferent parameters. For each such a configuration perform similar experiments (they can last for a longer time in order to obtain sets of data that will have at least 106 ob- servations) or even experiments were the workload will be generated by benchmarks or special programs. In each case trace analyzed counters and calculate similar statis- tics like in this paper. Depending on the obtained results it will be possible to have: Further conclusions about hard disk drives behavior; Evidences of possible existence of power-laws in the case of probability distributions; Measure and comparison of influence of different systems parameters on hard disk drive behavior and vice versa; Comparison of obtained statistics. Basing on this approach it is also possible to analyze cache, RAM or virtual memory, processor, operating sys- tem (e.g. semaphores, threads, sections, events, etc.) be- havior in a similar manner. REFERENCES [1] R. Descartes, “Discourse on Method and Meditations,” The Liberal Arts Press, New York, 1637. [2] F. Grabowski and D. Strzałka, “Dynamic Behavior of Simple Insertion Sort Algorithm,” Fundamenta Informa- ticae, Vol. 72, No. 1-3, 2006, pp. 155-165. [3] Y. Bar-Yam, “Dynamics of Complex Systems,” West- view Press, Colorado, 1997. [4] M. M. Waldrop, “Complexity: The Emerging Science at the Edge of Order and Chaos,” Simon & Schuster, New York, 1997. [5] F. Grabowski and D. Strzałka, “Simple, Complicated and Complex Systems—The Brief Introduction,” 2008 Con- ference on Human System Interactions, Vol. 1-2, 2008, pp. 576-579. doi:10.1109/HSI.2008.4581503 [6] Aristotle, “Methaphysics,” Clarendon Press, Oxford, 1924. [7] P. Wegner, “Research Paradigms in Computer Science,” Proceedings of the 2nd International Conference on Soft- ware Engineering, San Francisco, 13-15 October 1976, pp. 322-330. [8] D. Strzałka, “Non-Extensive Statistical Mechanics—A Possible Basis for Modeling Processes in Computer Mem- ory System,” Acta Physica Polonica A, Vol. 117, No. 4, 2010, pp. 652-657. [9] B. B. Mandelbrot, “How Long Is the Coast of Britain,” Science, Vol. 156, No. 3775, 1967, pp. 636-638. Copyright © 2011 SciRes. JSEA 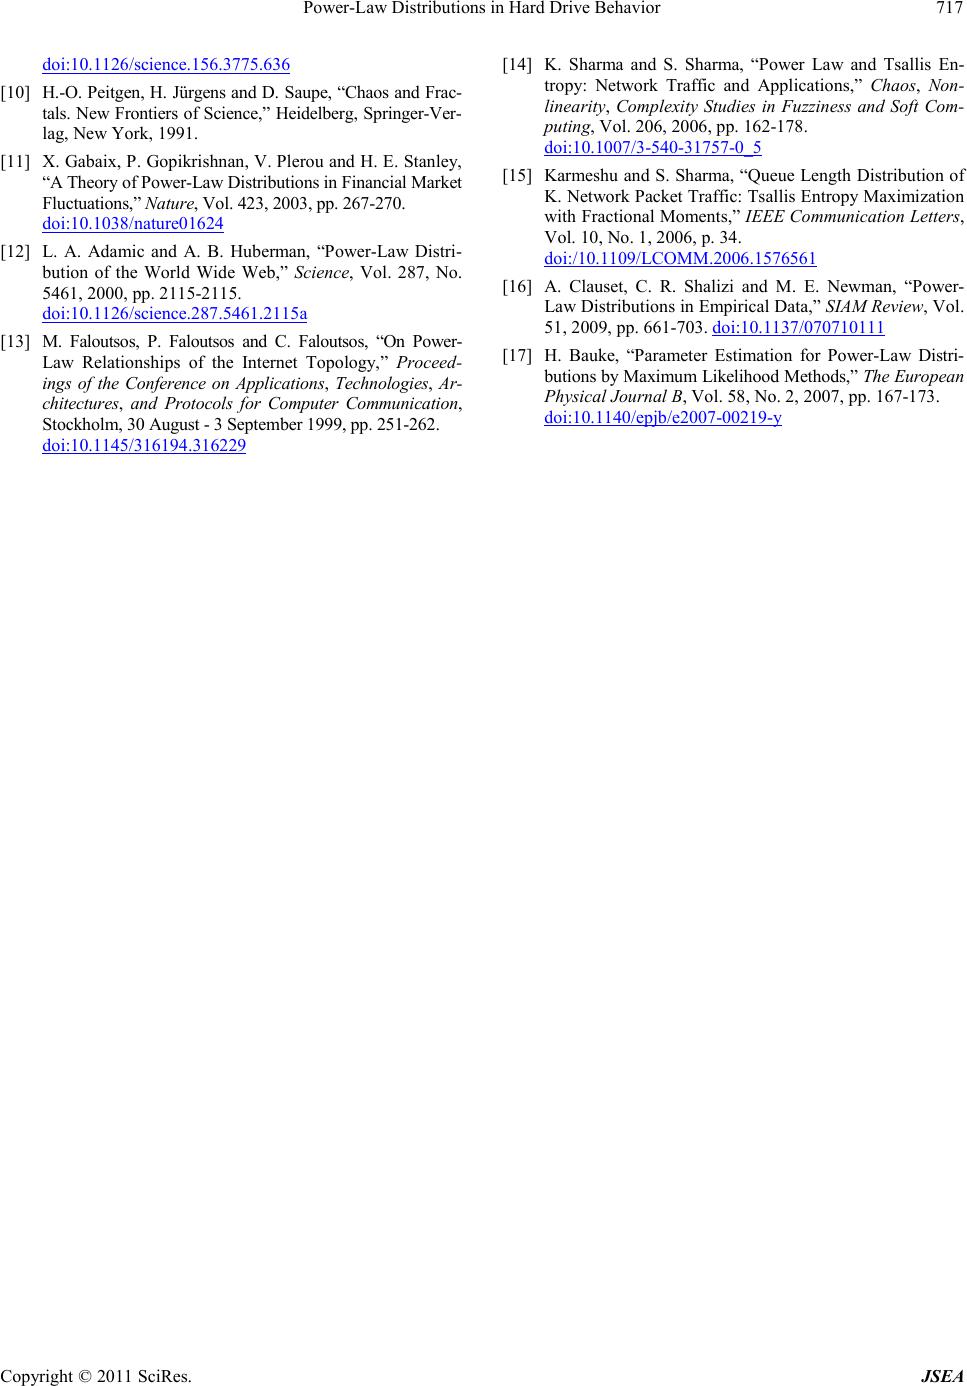 Power-Law Distributions in Hard Drive Behavior Copyright © 2011 SciRes. JSEA 717 doi :1 0. 1126 / sci en ce.1 56 . 37 75 .6 36 [10] H.-O. Peitgen, H. Jürgens and D. Saupe, “Chaos and Frac- tals. New Frontiers of Science,” Heidelberg, Springer-Ver- lag, New York, 1991. [11] X. Gabaix, P. Gopikrishnan, V. Plerou and H. E. Stanley, “A Theory of Power-Law Distributions in Financial Market Fluctuations,” Nature, Vol. 423, 2003, pp. 267-270. do i:1 0. 10 38 /n atu r e0 16 24 [12] L. A. Adamic and A. B. Huberman, “Power-Law Distri- bution of the World Wide Web,” Science, Vol. 287, No. 5461, 2000, pp. 2115-2115. doi :1 0. 1126 / sci en ce.2 87 . 54 61 .2 115 a [13] M. Faloutsos, P. Faloutsos and C. Faloutsos, “On Power- Law Relationships of the Internet Topology,” Proceed - ings of the Conference on Applications, Technologies, Ar- chitect ures, and Protocols for Computer Communication, Stockholm, 30 August - 3 September 1999, pp. 251-262. do i:1 0. 11 45 / 31 61 94 . 31 62 29 [14] K. Sharma and S. Sharma, “Power Law and Tsallis En- tropy: Network Traffic and Applications,” Cha os, Non- linearity, Complexity Studies in Fuzziness and Soft Com- puting, Vol. 206, 2006, pp. 162-178. doi:10.1007/3-540-31757-0_5 [15] Karmeshu and S. Sharma, “Queue Length Distribution of K. Network Packet Traffic: Tsallis Entropy Maximization with Fractional Moments,” IEEE Communication Letters, Vol. 10, No. 1, 2006, p. 34. doi:/10.1109/LCOMM.2006.1576561 [16] A. Clauset, C. R. Shalizi and M. E. Newman, “Power- Law Distributions in Empirical Data,” SIAM Review, Vol. 51, 2009, pp. 661-703. doi:10.1137/070710111 [17] H. Bauke, “Parameter Estimation for Power-Law Distri- butions by Maximum Likelihood Methods,” The European Physical Journal B, Vol. 58, No. 2, 2007, pp. 167-173. doi:10.1140/epjb/e2007-00219-y |