

Paper Menu >>
Journal Menu >>
 American Journal of Oper ations Research, 2011, 1, 236-242 doi:10.4236/ajor.2011.14027 Published Online December 2011 (http://www.SciRP.org/journal/ajor) Copyright © 2011 SciRes. AJOR Performance of Risk Measures in Portfolio Construction on Central and South-East Eur opean Emerging Markets Jelena Vidovic Department of Fi na nce , University Centre for Professional Studies, Split, Croatia E-mail: [email protected] Received May 24, 2011; revised June 30, 2011; accepted July 8, 2011 Abstract Aim of this paper is to characterize different risk measures in portfolio construction on seven Central and South-East European stock markets; Slovenia, Croatia, Hungary, Poland, Chez Republic, Romania and Tur- key. Selected countries are members of EU, except Croatia and Turkey which have candidate status. Em- pirical part of this paper consists of three stages; at first descriptive statistics on stock returns was performed, afterwards different risk measures were employed in portfolio construction and in the last part, portfolios were tested in the out-of-sample period. Results indicate presence of extreme kurtosis and skewness in stock return series. Resulting portfolios incorporate stocks with extremely high kurtosis and stocks with negative skewness. Portfolio construction based only on risk and return results in major exposure to extreme returns and unsatisfactory portfolio out-of-sample results. Keywords: Alternative Risk Measures, Central and South-East European Emerging Markets, Portfolio, Skewness, Kurtosis 1. Introduction Transition economies in Central and South-Eastern Europe (CSEE) represent very attractive investment area for foreign investors. In the past few years these stock markets witnessed tremendous growth both in number of listed securities as well as in market capitalization. In 2007 stock market indices grew tremendously. In 2007 value of stock market index on Zagreb Stock Exchange rose 63.20%, Slovene stock market index rose 71.0%, while German stock market index rose 22.3%. Risk and illiquidity of stocks are the main problem on these mar- kets especially in the recent period when the global economy was struck by financial crisis. Aim of this pa- per is to define characteristics of stock returns on CSEE equity markets. Portfolios of stocks will be formed on these markets using five risk measures: variance, semiva- riance, lower partial moment when target return is equal to 0, Mean Absolute Deviation and Conditional Value at Risk. Out-of-sample analysis of formed portfolios char- acterizes selected risk measures and their performance in presence of kurtosis and skewness. Paper is organized as follows: Section 2 presents a brief review of previous researches. Risk measures employed in forming portfolios are presented in Sec- tion 3. Section 4 discusses data and methodology. Sec- tion 5 presents results of empirical analysis. Results include portfolio composition and their out-of-sample performance. In Section 6 main conclusions were dr- awn. 2. Previous Researches The analysis of emerging capital markets has increased substantially in the recent years, however many studies had failed to take into account the characteristics of emerging markets in their analysis. The underlying as- sumption of the standard mean-variance model is that stock returns must be normally distributed, however this is in direct contradiction with the empirical evidence concerning the distribution of emerging markets returns. [1-5] concluded that Central and South-Eastern European equity markets have fat tails indicating presence of many extreme observations. According to [3] who examined the use of downside risk measures in construction of an optimal portfolio, the use of downside risk measures re- sults in significant improvement in the out-of-sample performance of those portfolios. [6] examined benefits of diversification into three leading Central European eq- uity markets using lower partial moment in the presence  237 J. VIDOVIC of nonnormality of returns on those markets. Their study shows that investors could benefit diversifying into Cen- tral European equity markets. These results are supported by the relatively low short term correlations as well as the lack of cointegration between these markets and de- veloped equity markets, their prospects for future eco- nomic growth and positive impact associated with their recent accession to the EU. Similar conclusion was brought in [7] where EU accession was highlighted as the key contributor to the reduction of risk on these mar- kets. [8] indicates that South-Eastern Europe emerging markets are loosely related in periods of normal eco- nomic activity while in conditions of economic recession they exhibit strong interrelationship. [9] concluded that return distribution appears to be leptokurtic for all Euro stock markets. Investors are more exposed to the risk since the distribution of returns has a greater exposure to outlier events and bias to the downside. 3. Risk Measures Many researches had their idea of the “best” risk meas- ure to be applied in the portfolio selection; mean lower partial moment [10-12], Mean-absolute deviation (MAD) [13] and Conditional Value-at-Risk (CVaR) [14]. This study involves empirical analysis of most important risk measures proposed and compared in literature in con- struction of optimal portfolios on selected markets. Variance which is by its definition measure of disper- sion considers the positive and negative deviations from the mean as potential risk. Variance of security is defined as: 2 2 iii ExE x (1) where 2 i -variance of security , i i x is random return on security , and is expectation operator. iE In the case of variance, over-performance relative to the mean is penalized just as much as under-perfor- mance. In order to overcome this anomaly [10] pro- posed semivariance as risk measure. The natural exten- sion of the semivariance [11,12] is the lower partial moment risk. Semivariance is a statistical measure equal to sum of square deviations from the mean, taking into account only observations below the mean: , 0, iii iii i x Exx Ex x x Ex , (2) Semivariance = (3) 2 () i Ex Two alternative downside risk measures are examined in this paper. The first uses the mean as target rate, the mean semivariance, and the second uses a target rate of zero. These two risk measures are denoted as LPMM and LPM0. Both measures compute risk using only returns below the mean return or alternatively below a target return. In the presence of negative skewness in a return series downside returns will occur in larger magnitudes than upside returns, the opposite is true in the presence of positive skewness. The absolute deviation of random variable is expected absolute value of difference between the random variable and its mean. [13] proved that minimizing Mean Abso- lute Deviation (MAD) is similar to minimizing variance if stock returns are multivariate normally distributed. Mean absolute deviation can be calculated using follow- ing expression: MAD ii Ex Ex (4) The Conditional Value-at-Risk (CVaR) can be ex- plained trough Value-at-Risk (VaR) [15]. Following equation defines conditional expectation in the lower tail of the distribution of returns and is equal to average of returns beyond VaR at level : p CVaRxEx xVaRx (5) Unlike Value-at-Risk, the CVaR is coherent risk measure [16,17]. 4. Data and Methodology Analysis includes seven stock markets form CSEE re- gion, five countries are members of EU: Poland, Czech Republic, Hungary and Romania, while two; Croatia and Turkey have candidate status. On every market ten stocks [18,19] from correspondent stock index were se- lected. Data series consists of 500 daily closing prices for each security in time period from November 2007 until the end of October 2009. Stocks were selected according to following criteria: stock was listed before 2007 and all stock prices were available in period from November 2007 until October 2009, selected stocks are members of national stock index which includes best stocks in the country irrelevant which sector they belong. Stocks which have the biggest share in construction of national index have advantage. Series of daily logarithmic returns for each stock were calculated. In order to determine whether the stock re- turns follow the normal distribution in this paper are presented results of descriptive statistics (mean, standard deviation, skewness and kurtosis) and normality tests. Normality tests conducted in this paper are Shapiro Wilk (W test) and Kolmogorov-Smirnov (K-S) D test [20]. Copyright © 2011 SciRes. AJOR 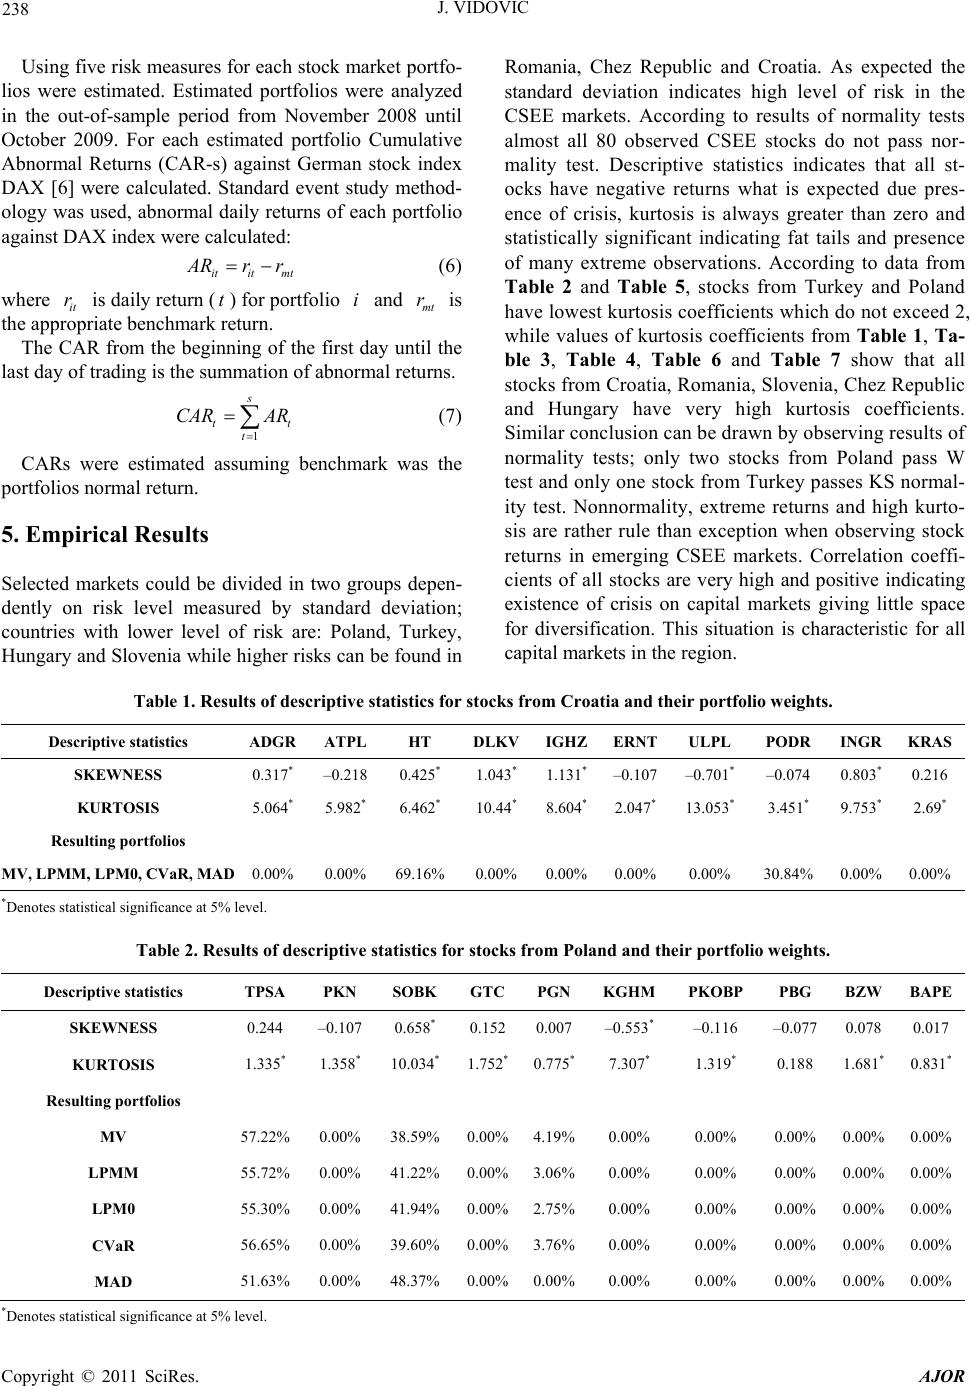 J. VIDOVIC Copyright © 2011 SciRes. AJOR 238 Using five risk measures for each stock market portfo- lios were estimated. Estimated portfolios were analyzed in the out-of-sample period from November 2008 until October 2009. For each estimated portfolio Cumulative Abnormal Returns (CAR-s) against German stock index DAX [6] were calculated. Standard event study method- ology was used, abnormal daily returns of each portfolio against DAX index were calculated: Romania, Chez Republic and Croatia. As expected the standard deviation indicates high level of risk in the CSEE markets. According to results of normality tests almost all 80 observed CSEE stocks do not pass nor- mality test. Descriptive statistics indicates that all st- ocks have negative returns what is expected due pres- ence of crisis, kurtosis is always greater than zero and statistically significant indicating fat tails and presence of many extreme observations. According to data from Table 2 and Table 5, stocks from Turkey and Poland have lowest kurtosis coefficients which do not exceed 2, while values of kurtosis coefficients from Table 1, Ta- ble 3, Table 4, Table 6 and Table 7 show that all stocks from Croatia, Romania, Slovenia, Chez Republic and Hungary have very high kurtosis coefficients. Similar conclusion can be drawn by observing results of normality tests; only two stocks from Poland pass W test and only one stock from Turkey passes KS normal- ity test. Nonnormality, extreme returns and high kurto- sis are rather rule than exception when observing stock returns in emerging CSEE markets. Correlation coeffi- cients of all stocks are very high and positive indicating existence of crisis on capital markets giving little space for diversification. This situation is characteristic for all capital markets in the region. itit mt A Rrr (6) where it is daily return () for portfolio and is the appropriate benchmark return. rtimt r The CAR from the beginning of the first day until the last day of trading is the summation of abnormal returns. 1 s t t CAR AR t (7) CARs were estimated assuming benchmark was the portfolios normal return. 5. Empirical Results Selected markets could be divided in two groups depen- dently on risk level measured by standard deviation; countries with lower level of risk are: Poland, Turkey, Hungary and Slovenia while higher risks can be found in Table 1. Results of descriptive statistics for stocks from Croatia and their portfolio weights. Descriptive statistics ADGR ATPL HT DLKVIGHZERNTULPL PODR INGRKRAS SKEWNESS 0.317* –0.218 0.425* 1.043* 1.131*–0.107 –0.701* –0.074 0.803*0.216 KURTOSIS 5.064* 5.982* 6.462* 10.44* 8.604*2.047*13.053* 3.451* 9.753*2.69* Resulting portfolios MV, LPMM, LPM0, CVaR, MAD0.00% 0.00% 69.16%0.00% 0.00%0.00%0.00% 30.84% 0.00%0.00% *Denotes statistical significance at 5% level. Table 2. Results of descriptive statistics for stocks fr om Poland and their portfolio weights. Descriptive statistics TPSA PKN SOBK GTC PGN KGHM PKOBP PBG BZWBAPE SKEWNESS 0.244 –0.107 0.658* 0.1520.007–0.553* –0.116 –0.077 0.0780.017 KURTOSIS 1.335* 1.358* 10.034*1.752*0.775*7.307* 1.319* 0.188 1.681*0.831* Resulting portfolios MV 57.22% 0.00% 38.59%0.00%4.19%0.00% 0.00% 0.00% 0.00%0.00% LPMM 55.72% 0.00% 41.22%0.00%3.06%0.00% 0.00% 0.00% 0.00%0.00% LPM0 55.30% 0.00% 41.94%0.00%2.75%0.00% 0.00% 0.00% 0.00%0.00% CVaR 56.65% 0.00% 39.60%0.00%3.76%0.00% 0.00% 0.00% 0.00%0.00% MAD 51.63% 0.00% 48.37%0.00%0.00%0.00% 0.00% 0.00% 0.00%0.00% *Denotes statistical significance at 5% level. 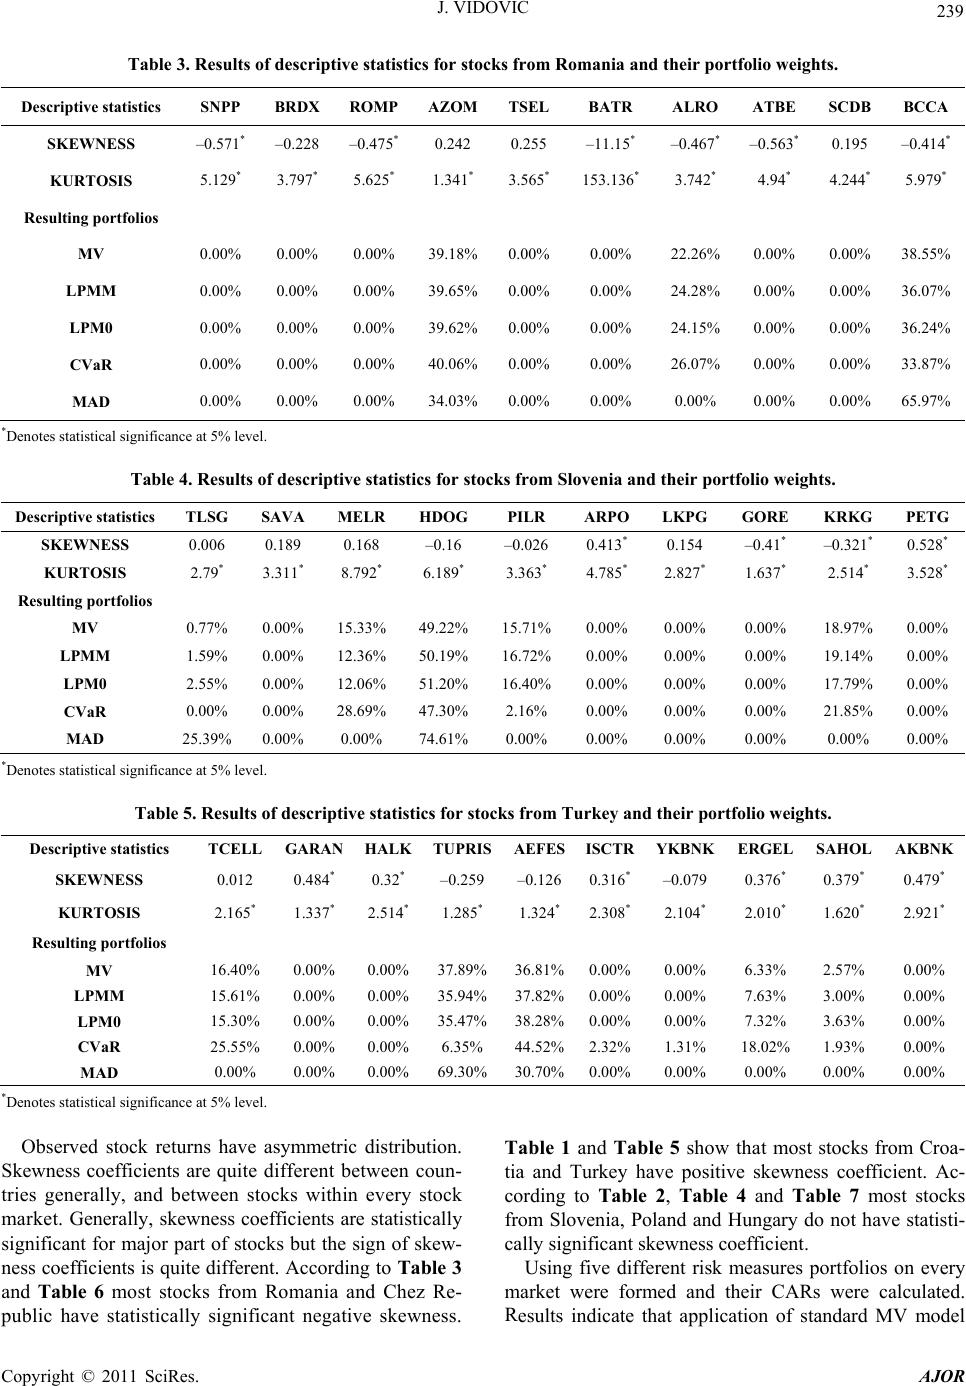 239 J. VIDOVIC Table 3. Results of descriptive statistics for stocks fr om Romania and their portfolio weights. Descriptive statistics SNPP BRDX ROMPAZOMTSEL BATR ALRO ATBE SCDBBCCA SKEWNESS –0.571*–0.228 –0.475*0.242 0.255 –11.15* –0.467*–0.563* 0.195 –0.414* KURTOSIS 5.129* 3.797* 5.625* 1.341* 3.565* 153.136* 3.742* 4.94* 4.244* 5.979* Resulting portfolios MV 0.00% 0.00% 0.00% 39.18%0.00% 0.00% 22.26%0.00% 0.00% 38.55% LPMM 0.00% 0.00% 0.00% 39.65%0.00% 0.00% 24.28%0.00% 0.00% 36.07% LPM0 0.00% 0.00% 0.00% 39.62%0.00% 0.00% 24.15%0.00% 0.00% 36.24% CVaR 0.00% 0.00% 0.00% 40.06%0.00% 0.00% 26.07%0.00% 0.00% 33.87% MAD 0.00% 0.00% 0.00% 34.03%0.00% 0.00% 0.00% 0.00% 0.00% 65.97% *Denotes statistical significance at 5% level. Table 4. Results of descriptive statistics for stocks fr om Slovenia and their portfolio weights. Descriptive statistics TLSG SAVA MELR HDOG PILR ARPO LKPG GORE KRKG PETG SKEWNESS 0.006 0.189 0.168 –0.16 –0.026 0.413* 0.154 –0.41* –0.321* 0.528* KURTOSIS 2.79* 3.311* 8.792* 6.189* 3.363* 4.785* 2.827* 1.637* 2.514* 3.528* Resulting portfolios MV 0.77% 0.00% 15.33% 49.22% 15.71% 0.00% 0.00% 0.00% 18.97% 0.00% LPMM 1.59% 0.00% 12.36% 50.19% 16.72% 0.00% 0.00% 0.00% 19.14% 0.00% LPM0 2.55% 0.00% 12.06% 51.20% 16.40% 0.00% 0.00% 0.00% 17.79% 0.00% CVaR 0.00% 0.00% 28.69% 47.30% 2.16% 0.00% 0.00% 0.00% 21.85% 0.00% MAD 25.39% 0.00% 0.00% 74.61% 0.00% 0.00% 0.00% 0.00% 0.00% 0.00% *Denotes statistical significance at 5% level. Table 5. Results of descriptive statistics for stocks fr om Turkey and their portfolio weights. Descriptive statistics TCELL GARAN HALKTUPRISAEFESISCTRYKBNKERGEL SAHOLAKBNK SKEWNESS 0.012 0.484* 0.32* –0.259 –0.1260.316*–0.079 0.376* 0.379* 0.479* KURTOSIS 2.165* 1.337* 2.514*1.285* 1.324*2.308*2.104* 2.010* 1.620* 2.921* Resulting portfolios MV 16.40% 0.00% 0.00%37.89% 36.81%0.00%0.00% 6.33% 2.57% 0.00% LPMM 15.61% 0.00% 0.00%35.94% 37.82%0.00%0.00% 7.63% 3.00% 0.00% LPM0 15.30% 0.00% 0.00%35.47% 38.28%0.00%0.00% 7.32% 3.63% 0.00% CVaR 25.55% 0.00% 0.00%6.35% 44.52%2.32% 1.31% 18.02% 1.93% 0.00% MAD 0.00% 0.00% 0.00%69.30% 30.70%0.00%0.00% 0.00% 0.00% 0.00% *Denotes statistical significance at 5% level. Observed stock returns have asymmetric distribution. Skewness coefficients are quite different between coun- tries generally, and between stocks within every stock market. Generally, skewness coefficients are statistically significant for major part of stocks but the sign of skew- ness coefficients is quite different. According to Tab le 3 and Table 6 most stocks from Romania and Chez Re- public have statistically significant negative skewness. Table 1 and Table 5 show that most stocks from Croa- tia and Turkey have positive skewness coefficient. Ac- cording to Table 2, Table 4 and Table 7 most stocks from Slovenia, Poland and Hungary do not have statisti- cally significant skewness coefficient. Using five different risk measures portfolios on every market were formed and their CARs were calculated. esults indicate that application of standard MV model R Copyright © 2011 SciRes. AJOR 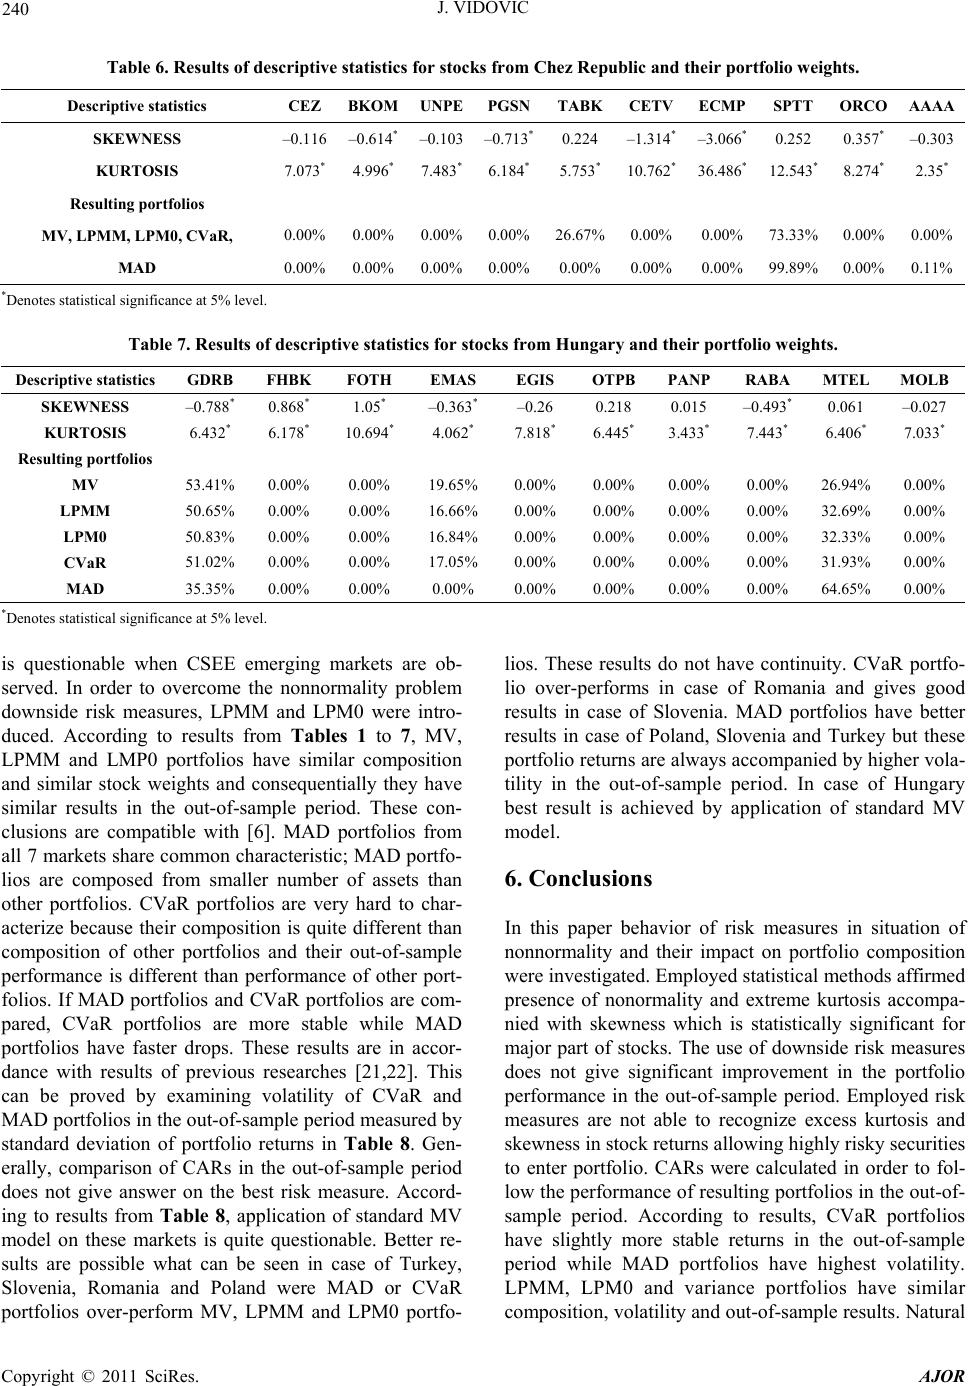 J. VIDOVIC 240 Table 6. Results of descriptive statistics for stoc ks fr om Che z Republic and their portfolio weights. Descriptive statistics CEZ BKOMUNPEPGSNTABKCETVECMP SPTT ORCOAAAA SKEWNESS –0.116 –0.614*–0.103 –0.713*0.224 –1.314*–3.066* 0.252 0.357*–0.303 KURTOSIS 7.073* 4.996* 7.483*6.184*5.753*10.762*36.486* 12.543* 8.274*2.35* Resulting portfolios MV, LPMM, LPM0, CVaR, 0.00% 0.00% 0.00%0.00%26.67%0.00%0.00% 73.33% 0.00% 0.00% MAD 0.00% 0.00% 0.00%0.00%0.00%0.00%0.00% 99.89% 0.00%0.11% *Denotes statistical significance at 5% level. Table 7. Results of descriptive statistics for stocks fr om Hungary and their portfolio weights. Descriptive statistics GDRB FHBK FOTH EMAS EGIS OTPB PANP RABA MTEL MOLB SKEWNESS –0.788* 0.868* 1.05* –0.363* –0.26 0.218 0.015 –0.493* 0.061 –0.027 KURTOSIS 6.432* 6.178* 10.694* 4.062* 7.818* 6.445* 3.433* 7.443* 6.406* 7.033* Resulting portfolios MV 53.41% 0.00% 0.00% 19.65% 0.00% 0.00% 0.00% 0.00% 26.94% 0.00% LPMM 50.65% 0.00% 0.00% 16.66% 0.00% 0.00% 0.00% 0.00% 32.69% 0.00% LPM0 50.83% 0.00% 0.00% 16.84% 0.00% 0.00% 0.00% 0.00% 32.33% 0.00% CVaR 51.02% 0.00% 0.00% 17.05% 0.00% 0.00% 0.00% 0.00% 31.93% 0.00% MAD 35.35% 0.00% 0.00% 0.00% 0.00% 0.00% 0.00% 0.00% 64.65% 0.00% *Denotes statistical significance at 5% level. is questionable when CSEE emerging markets are ob- served. In order to overcome the nonnormality problem downside risk measures, LPMM and LPM0 were intro- duced. According to results from Tables 1 to 7, MV, LPMM and LMP0 portfolios have similar composition and similar stock weights and consequentially they have similar results in the out-of-sample period. These con- clusions are compatible with [6]. MAD portfolios from all 7 markets share common characteristic; MAD portfo- lios are composed from smaller number of assets than other portfolios. CVaR portfolios are very hard to char- acterize because their composition is quite different than composition of other portfolios and their out-of-sample performance is different than performance of other port- folios. If MAD portfolios and CVaR portfolios are com- pared, CVaR portfolios are more stable while MAD portfolios have faster drops. These results are in accor- dance with results of previous researches [21,22]. This can be proved by examining volatility of CVaR and MAD portfolios in the out-of-sample period measured by standard deviation of portfolio returns in Table 8. Gen- erally, comparison of CARs in the out-of-sample period does not give answer on the best risk measure. Accord- ing to results from Table 8, application of standard MV model on these markets is quite questionable. Better re- sults are possible what can be seen in case of Turkey, Slovenia, Romania and Poland were MAD or CVaR portfolios over-perform MV, LPMM and LPM0 portfo- lios. These results do not have continuity. CVaR portfo- lio over-performs in case of Romania and gives good results in case of Slovenia. MAD portfolios have better results in case of Poland, Slovenia and Turkey but these portfolio returns are always accompanied by higher vola- tility in the out-of-sample period. In case of Hungary best result is achieved by application of standard MV model. 6. Conclusions In this paper behavior of risk measures in situation of nonnormality and their impact on portfolio composition were investigated. Employed statistical methods affirmed presence of nonormality and extreme kurtosis accompa- nied with skewness which is statistically significant for major part of stocks. The use of downside risk measures does not give significant improvement in the portfolio performance in the out-of-sample period. Employed risk measures are not able to recognize excess kurtosis and skewness in stock returns allowing highly risky securities to enter portfolio. CARs were calculated in order to fol- low the performance of resulting portfolios in the out-of- sample period. According to results, CVaR portfolios have slightly more stable returns in the out-of-sample period while MAD portfolios have highest volatility. LPMM, LPM0 and variance portfolios have similar omposition, volatility and out-of-sample results. Natural c Copyright © 2011 SciRes. AJOR 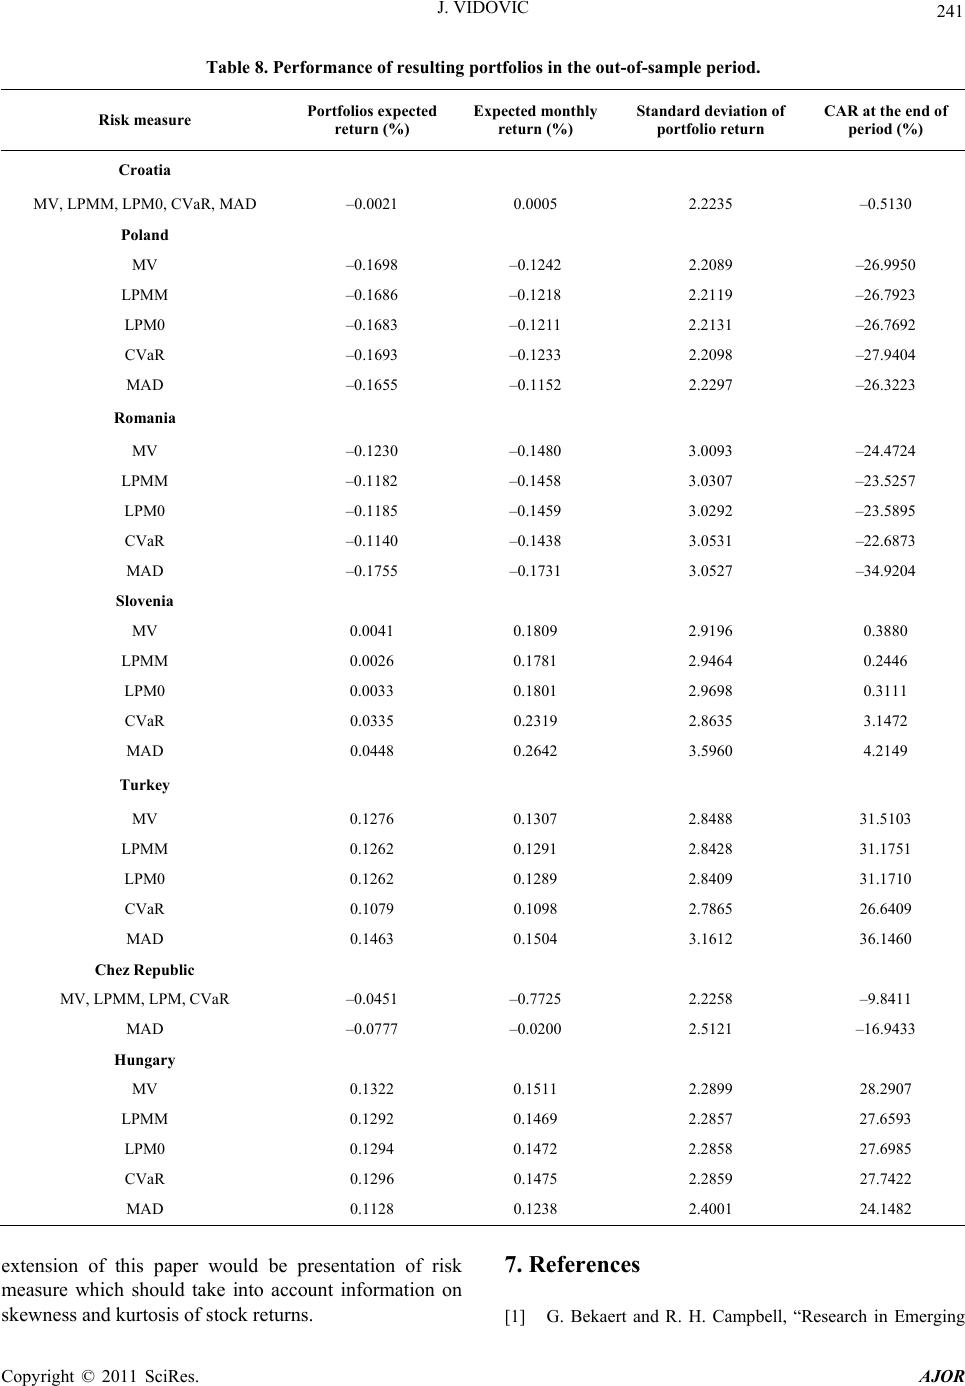 241 J. VIDOVIC Table 8. Performance of resulting portfolios in the out-of-sample period. Risk measure Portfolios expected return (%) Expected monthly return (%) Standard deviation of portfolio return CAR at the end of period (%) Croatia MV, LPMM, LPM0, CVaR, MAD –0.0021 0.0005 2.2235 –0.5130 Poland MV –0.1698 –0.1242 2.2089 –26.9950 LPMM –0.1686 –0.1218 2.2119 –26.7923 LPM0 –0.1683 –0.1211 2.2131 –26.7692 CVaR –0.1693 –0.1233 2.2098 –27.9404 MAD –0.1655 –0.1152 2.2297 –26.3223 Romania MV –0.1230 –0.1480 3.0093 –24.4724 LPMM –0.1182 –0.1458 3.0307 –23.5257 LPM0 –0.1185 –0.1459 3.0292 –23.5895 CVaR –0.1140 –0.1438 3.0531 –22.6873 MAD –0.1755 –0.1731 3.0527 –34.9204 Slovenia MV 0.0041 0.1809 2.9196 0.3880 LPMM 0.0026 0.1781 2.9464 0.2446 LPM0 0.0033 0.1801 2.9698 0.3111 CVaR 0.0335 0.2319 2.8635 3.1472 MAD 0.0448 0.2642 3.5960 4.2149 Turkey MV 0.1276 0.1307 2.8488 31.5103 LPMM 0.1262 0.1291 2.8428 31.1751 LPM0 0.1262 0.1289 2.8409 31.1710 CVaR 0.1079 0.1098 2.7865 26.6409 MAD 0.1463 0.1504 3.1612 36.1460 Chez Republic MV, LPMM, LPM, CVaR –0.0451 –0.7725 2.2258 –9.8411 MAD –0.0777 –0.0200 2.5121 –16.9433 Hungary MV 0.1322 0.1511 2.2899 28.2907 LPMM 0.1292 0.1469 2.2857 27.6593 LPM0 0.1294 0.1472 2.2858 27.6985 CVaR 0.1296 0.1475 2.2859 27.7422 MAD 0.1128 0.1238 2.4001 24.1482 extension of this paper would be presentation of risk measure which should take into account information on skewness and kurtosis of stock returns. 7. References [1] G. Bekaert and R. H. Campbell, “Research in Emerging Copyright © 2011 SciRes. AJOR  J. VIDOVIC 242 Markets Finance: Looking to the Future,” Emerging Mar- kets Review, Vol. 3, No. 4, 2002, pp. 429-448. doi:10.1016/S1566-0141(02)00045-6 [2] G. Bekaert and C. Harvey, “Emerging Markets Finance,” Journal of Empirical Finance, Vol. 10, No. 1-2, 2003, pp. 3-56. doi:10.1016/S0927-5398(02)00054-3 [3] S. Stevenson, “Emerging Markets, Downside Risk and the Asset Allocation Decision,” Emerging Markets Re- view, Vol. 2, No. 1, 2001, pp. 50-66. doi:10.1016/S1566-0141(00)00019-4 [4] R. Susmel, “Extreme Observations and Diversification in Latin America Emerging Equity Markets,” Journal of In- ternational Money and Finance, Vol. 20, No. 7, 2001, pp. 971-986. doi:10.1016/S0261-5606(01)00014-6 [5] J. Vidović and Z. Aljinović, “Research on Stock Returns in Central and South-East European Transitional Econo- mies,” Proceedings KOI 10th International Symposium on Operational Research in Slovenia, Nova Gorica, 23 - 25 September 2009, pp. 237-246. [6] C. G. Gilmore, G. M. McManus and A. Tezel, “Portfolio Allocations and the Emerging Equity Markets of Central Europe,” Journal of Multinational Financial Manage- ment, Vol. 15, No. 3, 2005, pp. 287-300. doi:10.1016/j.mulfin.2004.12.001 [7] C. A. J. Middleton, S. G. M. Fifield and D. M. Power, “Investment in Central and Eastern European Equities,” Studies in Economics and Finance, Vol. 24, No. 1, 2007, pp. 13-31. doi:10.1108/10867370710737364 [8] T. Gklezakou and J. Mylonakis, “Interdependence of the Developing Stock Markets, before and during the Eco- nomic Crisis: The Case of South Europe,” Journal of Money, Investment and Banking, Vol. 11, 2009, pp. 70- 78. [9] J. Bley, “European Stock Market Integration: Fact or Fiction?” Journal of International Financial Markets, In- stitutions and Money, Vol. 19, No. 5, 2009, pp. 759-776. [10] H. M. Markowitz, “Portfolio Selection: Efficient Diversi- fication of Investments,” John Wiley & Sons, New York, 1959. [11] P. C. Fishburn, “Mean-Risk Analysis with Risk Associ- ated with Below-Target Returns,” American Economic Review, Vol. 67, No. 2, 1977, pp. 116-126. [12] V. S. Bawa and E. B. Lindenberg, “Capital Market Equi- librium in a Mean-Lower Partial Moments Framework,” Journal of Financial Economics, Vol. 5, No. 2, 1977, pp. 198-200. doi:10.1016/0304-405X(77)90017-4 [13] H. Konno and H. Yamazaki, “Mean-Absolute Deviation Portfolio Optimization Model and Its Application to To- kyo Stock Market,” Management Science, Vol. 37, No. 5, 1991, pp. 519-531. doi:10.1287/mnsc.37.5.519 [14] S. Uryasev, “Conditional Value-at-Risk (CVaR): Algo- rithms and Applications,” Working Paper, University of Florida, 2002. http://www.ise.ufl.edu/uryasev [15] A. Alexandre, M. Houkari and J.-P. Laurent, “Spectral Risk Measures and Portfolio Selection,” Journal of Bank- ing and Finance, Vol. 32, No. 9, 2008, pp. 1870-1882. doi:10.1016/j.jbankfin.2007.12.032 [16] C. Acerbi and D. Tasche, “On the Coherence of Expected Shortfall,” Journal of Banking and Finance, Vol. 26, No. 7, 2002, pp. 1487-1503. doi:10.1016/S0378-4266(02)00283-2 [17] R. T. Rockafellar and S. Uraysev, “Optimization of Con- ditional Value-at-Risk,” Journal of Risk, Vol. 2, No. 3, 2000, pp. 21-41. [18] G. Y. N. Tang, “How Efficient Is Naive Portfolio Diver- sification? An Educational Note,” Omega—The Interna- tional Journal of Management Science, Vol. 32, No. 2, 2004, pp. 155-160. [19] L. R. Irala and P. Patil, “Portfolio Size and Diversifica- tion,” SMCS Journal of Indian Management, Vol. 4, No. 1, 2007, pp. 1-6. [20] S. S. Shapiro, M. B. Wilk and H. J. Chen, “A Compara- tive Study of Various Tests of Normality,” Journal of the American Statistical Association, Vol. 63, No. 324, 1968, pp. 1343-1372. doi:10.2307/2285889 [21] Y. Simaan, “Estimation Risk in Portfolio Selection: The Mean Variance Model versus the Mean Absolute Devia- tion Model,” Management Science, Vol. 43, No. 10, 1997, pp. 1437-1446. doi:10.1287/mnsc.43.10.1437 [22] E. Angelelli, R. Mansini and G. M. Speranza, “A Com- parison of MAD and CVaR Model with Real Features,” Journal of Banking & Finance, Vol. 32, No. 7, 2008, pp. 1188-1197. doi:10.1016/j.jbankfin.2006.07.015 Copyright © 2011 SciRes. AJOR |