

Paper Menu >>
Journal Menu >>
 Engineering, 2009, 1, 177-187 doi:10.4236/eng.2009.13021 Published Online November 2009 (http://www.scirp.org/journal/eng). Copyright © 2009 SciRes. ENGINEERING Condition-Based Diagnostic Approach for Predicting the Maintenance Requirements of Machinery C. I. UGECHI1, E. A. OGBONNAYA2, M. T. LILLY1, S. O. T. OGAJI3*, S. D. PROBERT3 1Department of Mechanical Engineering, Rivers State University of Science and Technology, Port Harcourt, Nigeria 2Department of Marine Engineering, Rivers State University of Science and Technology, Port Harcourt, Nigeria 3School of Engineering, Cranfield University, Bedfordshire, U K E-mail: [email protected] Received January 10, 2009; revised February 21, 2009; accepted February 23, 2009 Abstract Wise maintenance-procedures are essential for achieving high industrial productivities and low energy ex- penditure. A major part of the energy used in any production process is expended during the maintenance of the employed equipment. To ensure plant reliability and equipment availability, a condition-based mainte- nance policy has been developed in this investigation. In particular, this project explored the use of vibration parameters in the diagnosis of equipment failure. A computer-based diagnostic tool employing an artificial neural-network (ANN) was developed to analyse the ensuing machinery faults, their causes and conse- quences. For various categories of this type of machinery, a vibration-severity chart (ISO 12372 / BS 4675: 1971) appropriately colour coded according to defined mechanical faults, was used in training of the ANN. The model was validated using data obtained from a centrifugal pump on full load and fed into the program written in Visual Basic. The results revealed that, for centrifugal pumps within 15 to 300kw power range, vibration-velocity amplitude of between 0.9 and 2.7mm/s was within acceptable limits. When the values rose to between 2.8 and 7.0mm/s, closer monitoring and improved understanding of the equipment condition was needed. The evolved diagnostic and prognostic model is applicable for other rotary equipment that is used within the same power limits. Keywords: Condition Based, Diagnostic Model, Predictive Maintenance, Machinery, Centrifugal Pumps 1. The Challenge Maintenance, although requiring the expenditure of sig- nificant amounts of energy, is usually required in order to keep (or restore) facilities at an acceptable operational standard [1]. For most plants, maintenance practice is predominantly based on routine-scheduled prevention as well as previously unanticipated reactions to overcome faults. Predictive maintenance (PdM) procedures, such as that devised in this project, are evolving and results in less wasted effort. According to Ogbonnaya [2], Con- treras et al. [3] and Salva et al. [4] condition monitoring (CM) an aspect of PdM is defined as the use of appropri- ate technologies to determine the operational state of the considered machinery. For instance, it may involve vi- bration measurements, infrared thermography, and/or oil analyses etc. For decades, conventional wisdom suggested that the best way to optimise the performance of physical assets was to overhaul or replace them at fixed interval (PM). This was based on the premise that there is a direct rela- tionship between the amount of time (or number of cy- cles) equipment spends in service and the likelihood that it will fail. Moubray [5], stated that this relationship be- tween running time (age) and failure is true for some failure modes, but that it is no longer very productive as equipment are now much more complex than it was even fifteen years ago. He pointed out that fixed interval overhaul ignores the fact that overhauls are extraordinar- ily invasive undertakings that massively upset stable 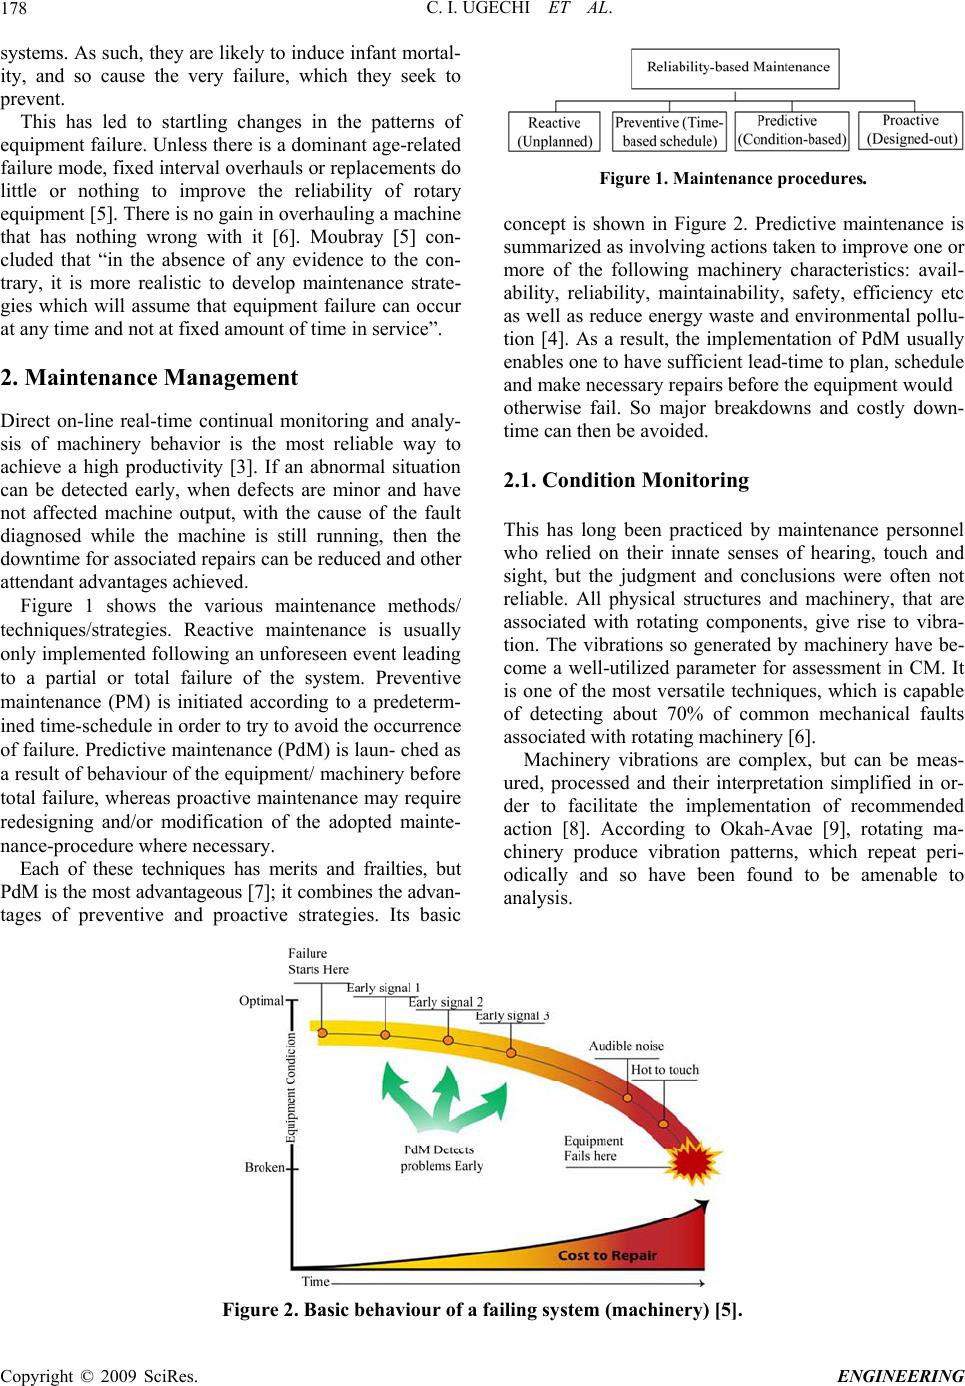 C. I. UGECHI ET AL. Copyright © 2009 SciRes. ENGINEERING 178 systems. As such, they are likely to induce infant mortal- ity, and so cause the very failure, which they seek to prevent. This has led to startling changes in the patterns of equipment failure. Unless there is a dominant age-related failure mode, fixed interval overhauls or replacements do little or nothing to improve the reliability of rotary equipment [5]. There is no gain in overhauling a machine that has nothing wrong with it [6]. Moubray [5] con- cluded that “in the absence of any evidence to the con- trary, it is more realistic to develop maintenance strate- gies which will assume that equipment failure can occur at any time and not at fixed amount of time in service”. 2. Maintenance Management Direct on-line real-time continual monitoring and analy- sis of machinery behavior is the most reliable way to achieve a high productivity [3]. If an abnormal situation can be detected early, when defects are minor and have not affected machine output, with the cause of the fault diagnosed while the machine is still running, then the downtime for associated repairs can be reduced and other attendant advantages achieved. Figure 1 shows the various maintenance methods/ techniques/strategies. Reactive maintenance is usually only implemented following an unforeseen event leading to a partial or total failure of the system. Preventive maintenance (PM) is initiated according to a predeterm- ined time-schedule in order to try to avoid the occurrence of failure. Predictive maintenance (PdM) is laun- ched as a result of behaviour of the equipment/ machinery before total failure, whereas proactive maintenance may require redesigning and/or modification of the adopted mainte- nance-procedure where necessary. Each of these techniques has merits and frailties, but PdM is the most advantageous [7]; it combines the advan- tages of preventive and proactive strategies. Its basic Figure 1. Maintenance procedures. concept is shown in Figure 2. Predictive maintenance is summarized as involving actions taken to improve one or more of the following machinery characteristics: avail- ability, reliability, maintainability, safety, efficiency etc as well as reduce energy waste and environmental pollu- tion [4]. As a result, the implementation of PdM usually enables one to have sufficient lead-time to plan, schedule and make necessary repairs before the equipment would otherwise fail. So major breakdowns and costly down- time can then be avoided. 2.1. Condition Monitoring This has long been practiced by maintenance personnel who relied on their innate senses of hearing, touch and sight, but the judgment and conclusions were often not reliable. All physical structures and machinery, that are associated with rotating components, give rise to vibra- tion. The vibrations so generated by machinery have be- come a well-utilized parameter for assessment in CM. It is one of the most versatile techniques, which is capable of detecting about 70% of common mechanical faults associated with rotating machinery [6]. Machinery vibrations are complex, but can be meas- ured, processed and their interpretation simplified in or- der to facilitate the implementation of recommended action [8]. According to Okah-Avae [9], rotating ma- chinery produce vibration patterns, which repeat peri- odically and so have been found to be amenable to analysis. Figure 2. Basic behaviour of a failing system (machinery) [5].  C. I. UGECHI ET AL. 179 2.2. Vibration Monitoring and Analysis Even though the wise maintenance of industrial equip- ment may require the monitoring of additional parame- ters, such as temperature, pressure, flow, voltage, electric current, horsepower, torque, etc, vibration data usually contain more information about a machine’s health and operating characteristics than any other parameter – see Table 1. This informed the choice of vibration monitor- ing and analysis over other condition monitoring tech- niques in this research. Measurements of vibration parameters are important in many industrial applications. The parameters desired may be displacement, velocity, or acceleration; in time or frequency domain. These quantities are useful in pre- dicting the fatigue failure of a particular component of machine and play important role in analysis, which are used to reduce equipment vibration [8]. According to Ralph [10], when measurement of both amplitude and frequency are available, diagnostic methods can be used to determine the magnitude of a problem and its probable cause. Vibration severity is a function of displacement and frequency of rotation of the component. Measurements of vibration-velocity take into account both displacement and frequency: “vibration-velocity amplitude is a direct measure of vibration severity” [11]. Vibration-velocity gives an indication of vibration severity over a wide range of frequencies and hence is extensively applied in condition monitoring [9]. Each mechanical defect generates vibration in its own unique way [11]. This makes it possible to identify a mechanical problem by measuring and noting its vibra- tion signature. When vibration measurements and analy- sis are performed systematically and intelligently, they ill not only allow determination of machine health but w also permit the prediction of the mechanical fault and when such condition most likely will have reached un- acceptable levels [12]. Vibrations occurring in the 600 to 60,000 cpm fre- quency range are generally described and measured by their vibration-velocity amplitudes [11]. In practice, the following relationships apply: Displacement of vibrating component (x) = a / (2πƒ)2 (1) Velocity of vibrating component (v) = a /2πƒ (2) Acceleration of vibrating component (a) = 2πƒv (3) 3. Research Methodology The identification of incipient faults in a machine, in order to diagnose an impending problem and locate the fault while the machine is still running, through an inter- pretation of its unique vibration characteristic (i.e. sig- nature) is the main aim of PdM [13]. A good vibration survey program sets different limits for different ma- chines, as well as different limits for different regions of the frequency domain spectra for the same machine. The delineation of severity limits for good and bad bearing conditions are best determined by “comparison” or “trending” methods [11]. In establishing a program for checking the spike energy conditions of rolling element bearings; a “comparison method is used. The spike en- ergy levels of similar machines are measured and any level which significantly departs from the average are singled out for further analysis of potential bearing prob- lems. This method has led to the establishment of criteria levels which distinguished good and bad bearings. Table 1. Parameters indicating the occurrence of faulty conditions in a rotating machine. PARAMETER MEASURED DETECTED CONDITION TEMPERTURE OF MACHINE PRESSURE OF PROCESS FLUID FLOW OF FLUID OIL ANALY- SIS SPIKE EN- ERGY OF BEARING VIBRATION OF MACHINE OUT- OF - BALANCE X MISALIGNMENT X X BENT SHAFT X X BALL-BEARING DAMAGE X X X X JOURNAL-BEARING DAMAGE X X X X X GEAR DAMAGE X X MECHANICAL LOOSENESS X MECHANICAL RUBBING X X NOISE X CRACKING X C opyright © 2009 SciRes. ENGINEERING  C. I. UGECHI ET AL. 180 Various ranges of vibration velocity amplitude and spike energy were represented with colour codes for corresponding level of vibration severity: green for good/normal condition, blue for acceptable condition, yellow for fair condition/ improvement required, and red for unacceptable condition. The use of a real-time recur- rent simulation was therefore adopted in this investiga- tion in order to develop an artificial neural-network (ANN) for the analysis of the vibration data [4]. 3.1. Artificial Neural-Networks (Anns) Ogbonnaya [8] showed that ANN is a promising tool to articulate and analyze the numerous data associated with catastrophic failures in rotating machinery. According to Agbese and Mohammed [14], since ANN, a branch of Artificial Intelligence (AI), are modelled after the bio- logical neurons of the human brain, they hold consider- able promise as building blocks in actualising the ulti- mate aim of AI systems. Out of the various architecture with which ANN is conveyed; the back propagation al- gorithm has proved most promising and accurate for analyzing machine vibration data [8]. Also of important is training the neuron of the network on the basis of pat- tern recognition; especially when there are large amount of data to handle. Simulated neural networks are software models de- signed through suitable interpretation of the structure and basic function of the biological neuron of the human brain. Therefore the more physiology of the brain is un- derstood the better the ability to design ANNs that will handle more complex problems. According to Carlton et al [15]; Agbese and Mohammed [14], the artificial neu- ron is called the processing elements or nodes, which are capable of handling information in response to external input. It has many input parts and combines the input Legend: ∆P – change in active power of driver; ∆F – change in equip- ment’s frequency; ∆V – change in equipment’s vibration-amplitude; ∆SE – change in spike energy of bearing Figure 3. Triple hidden-layer network. values it receives usually by summation. The combined input is then modified by a transfer function, which can be chosen to suit a particular application. This new value becomes the output and can be connected to the inputs of other processing elements through weighting functions, which correspond to the synaptic strength of biological neural connection [15,16]. As in the biological brain, the neural network learns by altering the value of its weights. In a simulated neural network, the weights are altered as to reduce the error between the outputs the network produces in relation to a particular input pattern and the actual required outputs [15]. This is an iterative process, carried out as the pat- terns to be learnt are presented; an algorithm calculates the error and changes the value of the weights accord- ingly. Typically, an engineering application of ANN tech- nology consists of a set of input nodes that forms the input layer and one or more hidden layers. This type of ANN is called a multilayer perceptron, and usually a popular back-propagation algorithm is used to train the network [17]. The triple-hidden layer ANN shown in Figure 3 was designed with 4 nodes in the input layer. Hidden layer 1 is to be used for processing of the measured values; the summation is then passed to hidden layer 2 for exact fault-classification, while hidden layer 3 is designed to issue task specifications for achieving possible solutions. The output layer is therefore able to determine and dis- play the nature of the exact fault and provide a solution for the fault to be overcome, thereby optimizing the use of energy and human resources. A vibration-severity chart for various classes of ma- chinery, as illustrated in Table 2, was used in the training of the network. Its inputs were vibration-velocity ampli- tude, motor power, equipment frequency and spike en- ergy of the equipment. A computer program in Visual Basic (VB) was developed from the flowchart shown in Appendix 1. Further details of it are available from the authors. The faults considered included misalignment, imbalance, bent shaft, mechanical looseness, and poor- bearing condition. The diagnostic model is programmed according to various colour codes for corresponding pump conditions, diagnosed faults and appropriate task instructions on how to avert catastrophic failure of the vibrating equipment (in the considered case, a pump). The software flagged up defined information once the vibration values were within a specified range. The solutions obtained from the diag- nostic model were used to determine how unwanted vi- bration problems could be eliminated or reduced to al- lowable limits. When analysing vibration severity of a machine to pinpoint particular problem, it is essential to know the C opyright © 2009 SciRes. ENGINEERING 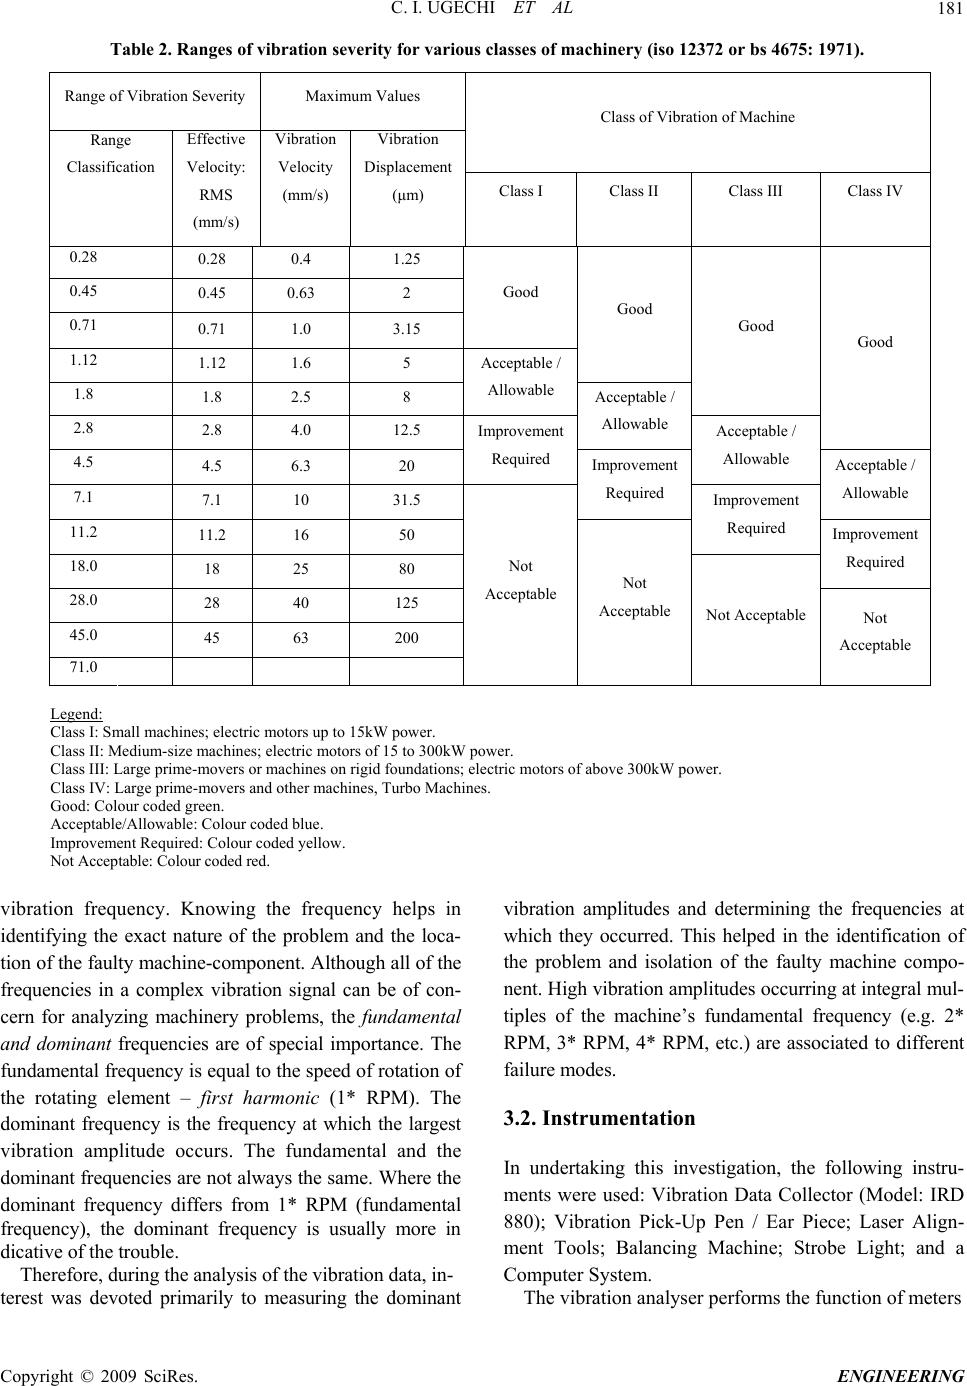 C. I. UGECHI ET AL 181 Table 2. Ranges of vibration severity for various classes of machinery (iso 12372 or bs 4675: 1971). Range of Vibration SeverityMaximum Values Class of Vibration of Machine Range Classification Effective Velocity: RMS (mm/s) Vibration Velocity (mm/s) Vibration Displacement (μm) Class I Class II Class III Class IV 0.28 0.28 0.4 1.25 0.45 0.45 0.63 2 0.71 0.71 1.0 3.15 Good 1.12 1.12 1.6 5 Good 1.8 1.8 2.5 8 Acceptable / Allowable Good 2.8 2.8 4.0 12.5 Acceptable / Allowable Good 4.5 4.5 6.3 20 Improvement Required Acceptable / Allowable 7.1 7.1 10 31.5 Improvement Required Acceptable / Allowable 11.2 11.2 16 50 Improvement Required 18.0 18 25 80 Improvement Required 28.0 28 40 125 45.0 45 63 200 71.0 Not Acceptable Not Acceptable Not Acceptable Not Acceptable Legend: Class I: Small machines; electric motors up to 15kW power. Class II: Medium-size machines; electric motors of 15 to 300kW power. Class III: Large prime-movers or machines on rigid foundations; electric motors of above 300kW power. Class IV: Large prime-movers and other machines, Turbo Machines. Good: Colour coded green. Acceptable/Allowable: Colour coded blue. Improvement Required: Colour coded yellow. Not Acceptable: Colour coded red. vibration frequency. Knowing the frequency helps in identifying the exact nature of the problem and the loca- tion of the faulty machine-component. Although all of the frequencies in a complex vibration signal can be of con- cern for analyzing machinery problems, the fundamental and dominant frequencies are of special importance. The fundamental frequency is equal to the speed of rotation of the rotating element – first harmonic (1* RPM). The dominant frequency is the frequency at which the largest vibration amplitude occurs. The fundamental and the dominant frequencies are not always the same. Where the dominant frequency differs from 1* RPM (fundamental frequency), the dominant frequency is usually more in dicative of the trouble. Therefore, during the analysis of the vibration data, in- terest was devoted primarily to measuring the dominant vibration amplitudes and determining the frequencies at which they occurred. This helped in the identification of the problem and isolation of the faulty machine compo- nent. High vibration amplitudes occurring at integral mul- tiples of the machine’s fundamental frequency (e.g. 2* RPM, 3* RPM, 4* RPM, etc.) are associated to different failure modes. 3.2. Instrumentation In undertaking this investigation, the following instru- ments were used: Vibration Data Collector (Model: IRD 880); Vibration Pick-Up Pen / Ear Piece; Laser Align- ment Tools; Balancing Machine; Strobe Light; and a Computer System. The vibration analyser performs the function of meters C opyright © 2009 SciRes. ENGINEERING 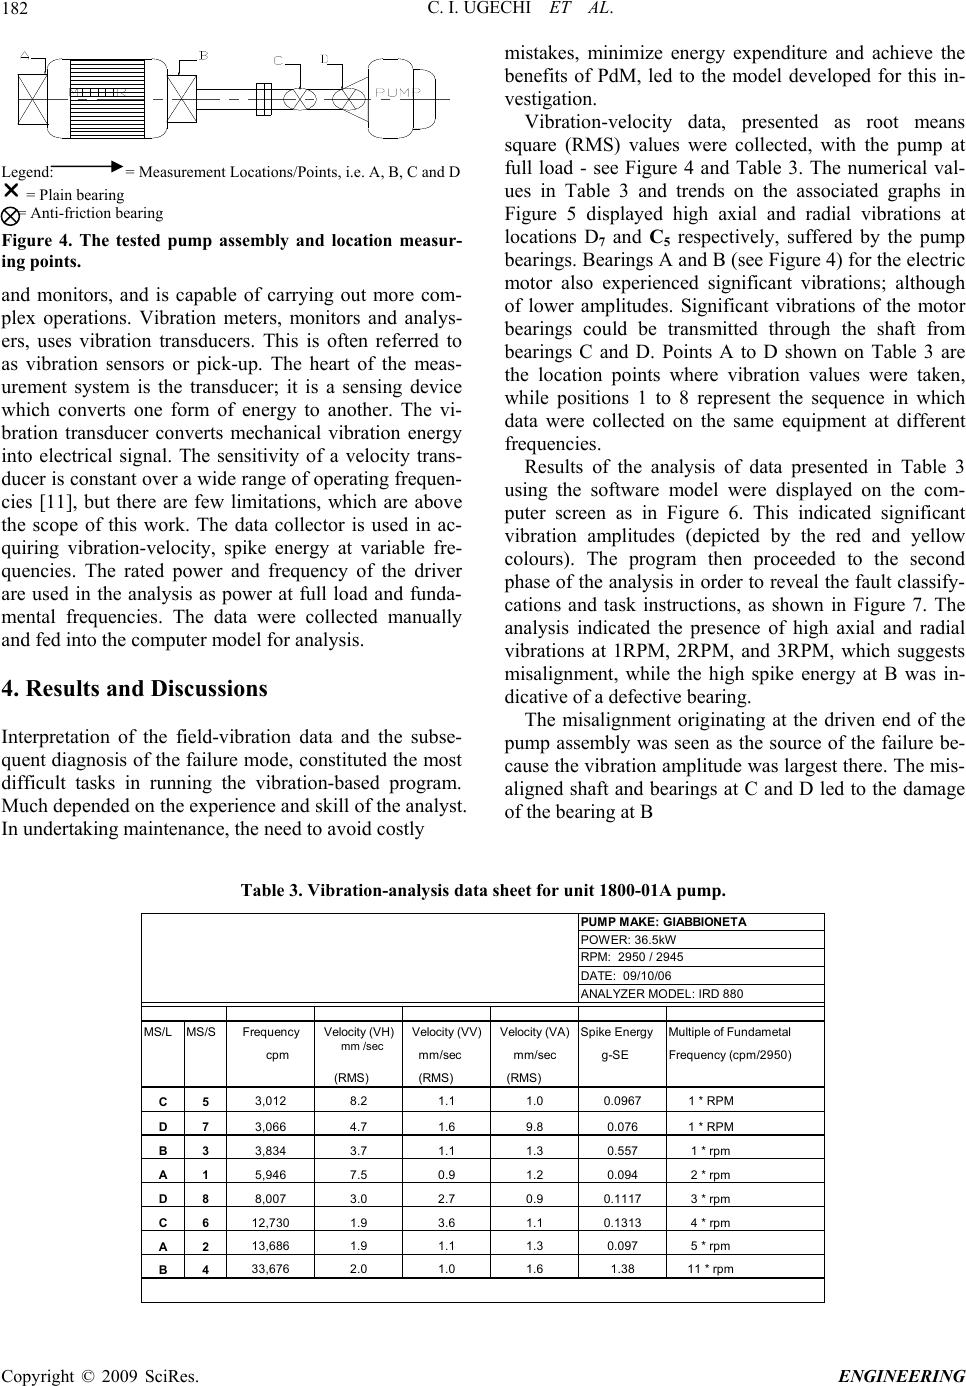 C. I. UGECHI ET AL. Copyright © 2009 SciRes. ENGINEERING 182 Legend: = Measurement Locations/Points, i.e. A, B, C and D = Plain bearing = Anti-friction bearing Figure 4. The tested pump assembly and location measur- ing points. and monitors, and is capable of carrying out more com- plex operations. Vibration meters, monitors and analys- ers, uses vibration transducers. This is often referred to as vibration sensors or pick-up. The heart of the meas- urement system is the transducer; it is a sensing device which converts one form of energy to another. The vi- bration transducer converts mechanical vibration energy into electrical signal. The sensitivity of a velocity trans- ducer is constant over a wide range of operating frequen- cies [11], but there are few limitations, which are above the scope of this work. The data collector is used in ac- quiring vibration-velocity, spike energy at variable fre- quencies. The rated power and frequency of the driver are used in the analysis as power at full load and funda- mental frequencies. The data were collected manually and fed into the computer model for analysis. 4. Results and Discussions Interpretation of the field-vibration data and the subse- quent diagnosis of the failure mode, constituted the most difficult tasks in running the vibration-based program. Much depended on the experience and skill of the analyst. In undertaking maintenance, the need to avoid costly mistakes, minimize energy expenditure and achieve the benefits of PdM, led to the model developed for this in- vestigation. Vibration-velocity data, presented as root means square (RMS) values were collected, with the pump at full load - see Figure 4 and Table 3. The numerical val- ues in Table 3 and trends on the associated graphs in Figure 5 displayed high axial and radial vibrations at locations D7 and C5 respectively, suffered by the pump bearings. Bearings A and B (see Figure 4) for the electric motor also experienced significant vibrations; although of lower amplitudes. Significant vibrations of the motor bearings could be transmitted through the shaft from bearings C and D. Points A to D shown on Table 3 are the location points where vibration values were taken, while positions 1 to 8 represent the sequence in which data were collected on the same equipment at different frequencies. Results of the analysis of data presented in Table 3 using the software model were displayed on the com- puter screen as in Figure 6. This indicated significant vibration amplitudes (depicted by the red and yellow colours). The program then proceeded to the second phase of the analysis in order to reveal the fault classify- cations and task instructions, as shown in Figure 7. The analysis indicated the presence of high axial and radial vibrations at 1RPM, 2RPM, and 3RPM, which suggests misalignment, while the high spike energy at B was in- dicative of a defective bearing. The misalignment originating at the driven end of the pump assembly was seen as the source of the failure be- cause the vibration amplitude was largest there. The mis- aligned shaft and bearings at C and D led to the damage of the bearing at B Table 3. Vibration-analysis data sheet for unit 1800-01A pump. PUMP MAKE: GIABBIONETA POWER: 36.5kW RPM: 2950 / 2945 DATE: 09/10/06 ANALYZER MODEL: IRD 880 MS/LMS/SFrequencyVelocity (VH)Velocity (VV)Velocity (VA)Spike EnergyMultiple of Fundametal cpm mm /sec mm/sec mm/sec g-SEFrequency (cpm/2950) (RMS) (RMS) (RMS) C5 3,0128.21.11.00.09671 * RPM D7 3,0664.71.69.80.0761 * RPM B3 3,8343.71.11.30.5571 * rpm A1 5,9467.50.91.20.0942 * rpm D8 8,0073.02.70.90.11173 * rpm C6 12,7301.93.61.10.13134 * rpm A2 13,6861.91.11.30.0975 * rpm B4 33,6762.01.01.61.3811 * rpm 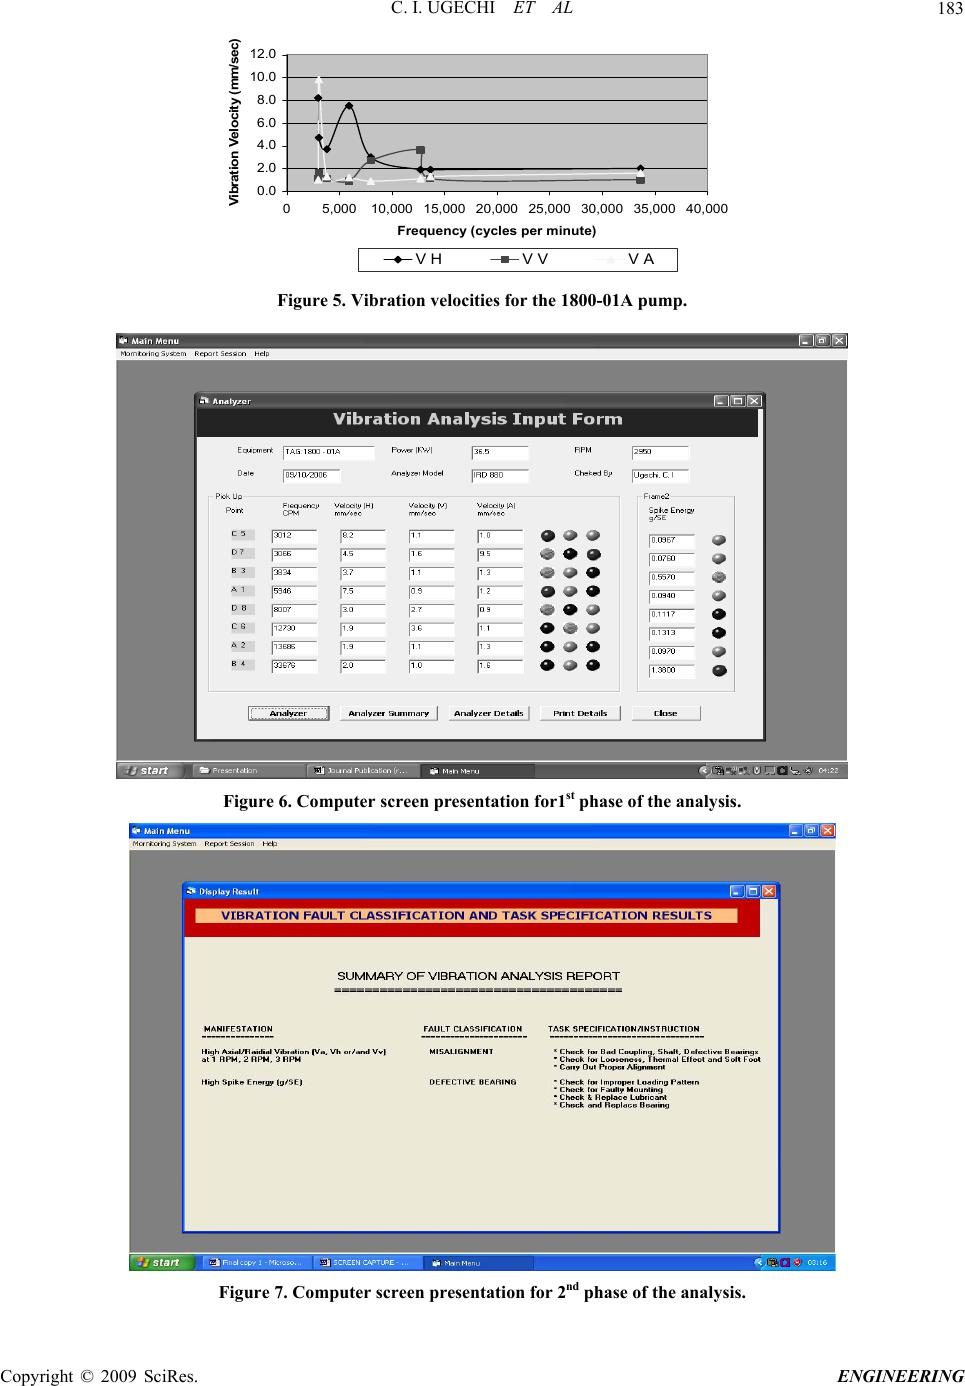 C. I. UGECHI ET AL 183 0.0 2.0 4.0 6.0 8.0 10.0 12.0 05,00010,000 15,000 20,000 25,000 30,000 35,000 40,000 Frequency (cycles per minute) Vibration Velocity (mm /sec) V HV VV A Figure 5. Vibration velocities for the 1800-01A pump. Figure 6. Computer screen presentation for1st phase of the analysis. Figure 7. Computer screen presentation for 2nd phase of the analysis. C opyright © 2009 SciRes. ENGINEERING 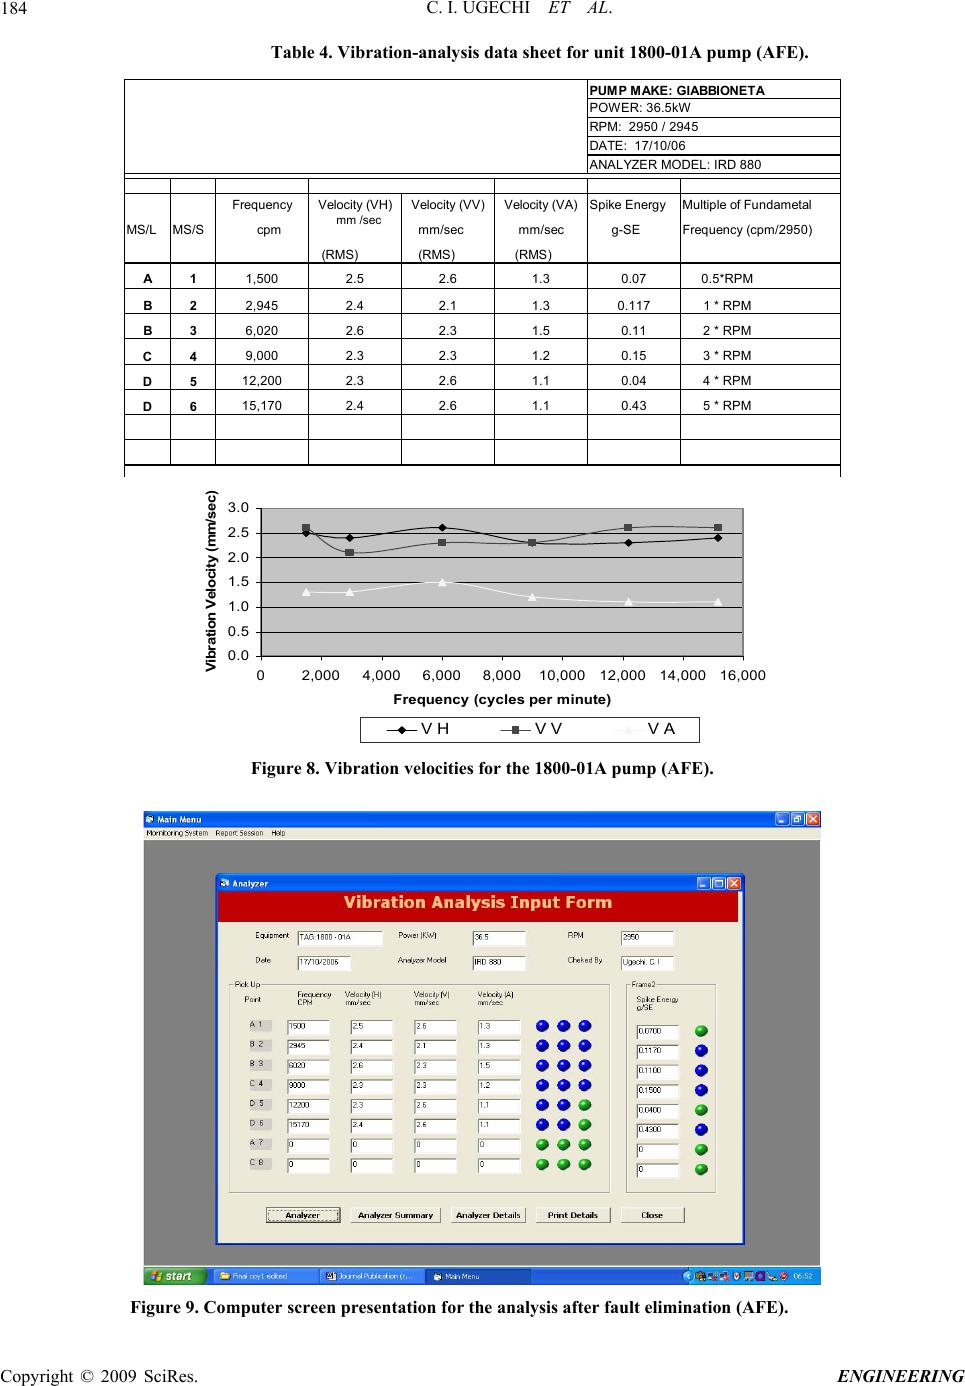 C. I. UGECHI ET AL. Copyright © 2009 SciRes. ENGINEERING 184 Table 4. Vibration-analysis data sheet for unit 1800-01A pump (AFE). PUMP MAKE: GIAB BION ETA POWER: 36.5kW RPM: 2950 / 2945 DATE: 17/10/06 ANALYZER MODEL: IRD 880 Frequen c yVelocity (VH)Velocity (VV)Velocity (VA)Spike En ergyMultiple of Fundametal MS/LMS/ S cpm mm /sec mm/sec mm/sec g-SEFrequency (cpm/2950) (RMS) (RMS) (RMS) A1 1,5002.5 2.6 1.30.070.5*RPM B2 2,9452.42.11.30.1171 * RPM B3 6,0202.62 .31.50.112 * RPM C4 9,0002.32 .31.20.153 * RPM D5 12,2002.32.61.10.044 * RPM D6 15,1702.42.61.10.435 * RPM 0.0 0.5 1.0 1.5 2.0 2.5 3.0 02,0004,0006,0008,00010,00012,000 14,000 16,000 Frequency (cycles per minute) Vibration V elocity (mm/sec) V HV VV A Figure 8. Vibration velocities for the 1800-01A pump (AFE). Figure 9. Computer screen presentation for the analysis after fault elimination (AFE). 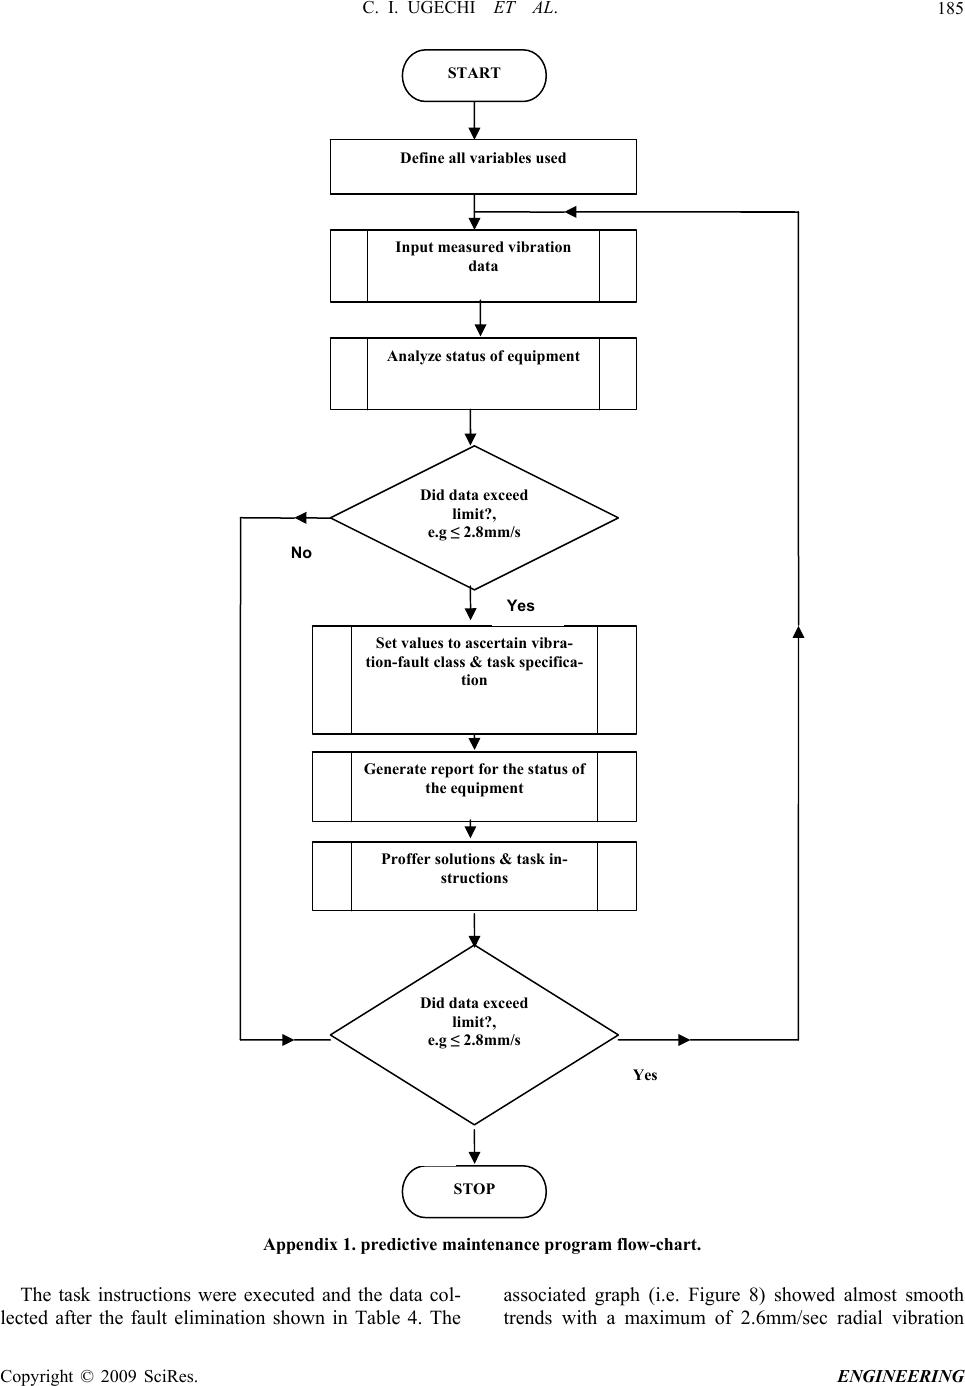 C. I. UGECHI ET AL. Copyright © 2009 SciRes. ENGINEERING 185 Appendix 1. predictive maintenance program flow-chart. The task instructions were executed and the data col- lected after the fault elimination shown in Table 4. The associated graph (i.e. Figure 8) showed almost smooth trends with a maximum of 2.6mm/sec radial vibration Did data exceed limit?, e.g ≤ 2.8mm/s Input measured vibration data START Define all variables used Analyze status of equipment Did data exceed limit?, e.g ≤ 2.8mm/s Set values to ascertain vibra- tion-fault class & task specifica- tion Generate report for the status of the equipment Proffer solutions & task in- structions No Yes Yes STOP 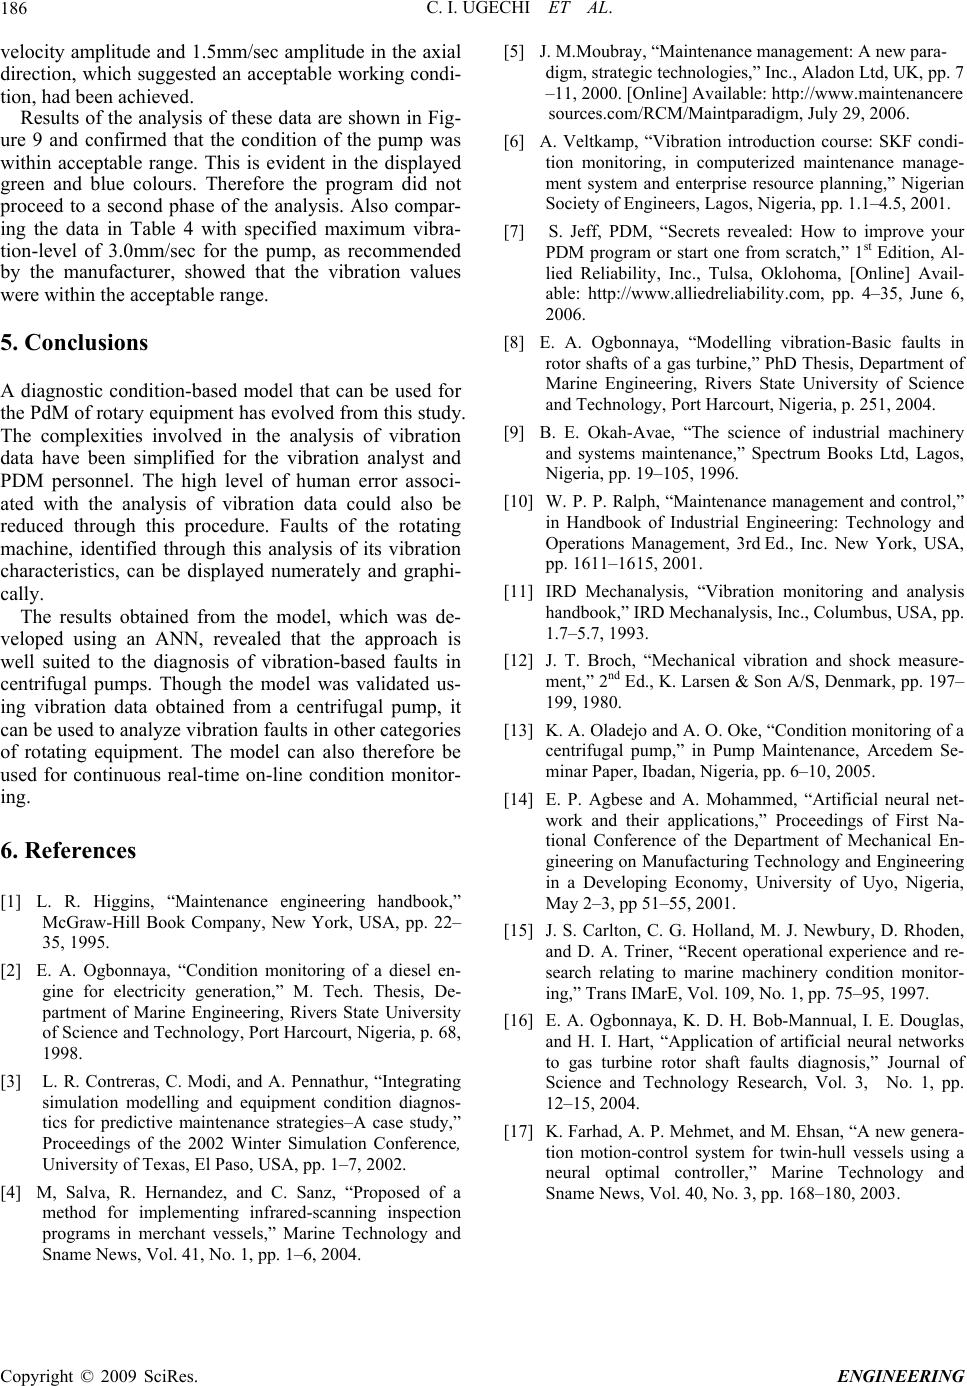 C. I. UGECHI ET AL. Copyright © 2009 SciRes. ENGINEERING 186 velocity amplitude and 1.5mm/sec amplitude in the axial direction, which suggested an acceptable working condi- tion, had been achieved. Results of the analysis of these data are shown in Fig- ure 9 and confirmed that the condition of the pump was within acceptable range. This is evident in the displayed green and blue colours. Therefore the program did not proceed to a second phase of the analysis. Also compar- ing the data in Table 4 with specified maximum vibra- tion-level of 3.0mm/sec for the pump, as recommended by the manufacturer, showed that the vibration values were within the acceptable range. 5. Conclusions A diagnostic condition-based model that can be used for the PdM of rotary equipment has evolved from this study. The complexities involved in the analysis of vibration data have been simplified for the vibration analyst and PDM personnel. The high level of human error associ- ated with the analysis of vibration data could also be reduced through this procedure. Faults of the rotating machine, identified through this analysis of its vibration characteristics, can be displayed numerately and graphi- cally. The results obtained from the model, which was de- veloped using an ANN, revealed that the approach is well suited to the diagnosis of vibration-based faults in centrifugal pumps. Though the model was validated us- ing vibration data obtained from a centrifugal pump, it can be used to analyze vibration faults in other categories of rotating equipment. The model can also therefore be used for continuous real-time on-line condition monitor- ing. 6. References [1] L. R. Higgins, “Maintenance engineering handbook,” McGraw-Hill Book Company, New York, USA, pp. 22– 35, 1995. [2] E. A. Ogbonnaya, “Condition monitoring of a diesel en- gine for electricity generation,” M. Tech. Thesis, De- partment of Marine Engineering, Rivers State University of Science and Technology, Port Harcourt, Nigeria, p. 68, 1998. [3] L. R. Contreras, C. Modi, and A. Pennathur, “Integrating simulation modelling and equipment condition diagnos- tics for predictive maintenance strategies–A case study,” Proceedings of the 2002 Winter Simulation Conference, University of Texas, El Paso, USA, pp. 1–7, 2002. [4] M, Salva, R. Hernandez, and C. Sanz, “Proposed of a method for implementing infrared-scanning inspection programs in merchant vessels,” Marine Technology and Sname News, Vol. 41, No. 1, pp. 1–6, 2004. [5] J. M.Moubray, “Maintenance management: A new para- digm, strategic technologies,” Inc., Aladon Ltd, UK, pp. 7 –11, 2000. [Online] Available: http://www.maintenancere sources.com/RCM/Maintparadigm, July 29, 2006. [6] A. Veltkamp, “Vibration introduction course: SKF condi- tion monitoring, in computerized maintenance manage- ment system and enterprise resource planning,” Nigerian Society of Engineers, Lagos, Nigeria, pp. 1.1–4.5, 2001. [7] S. Jeff, PDM, “Secrets revealed: How to improve your PDM program or start one from scratch,” 1st Edition, Al- lied Reliability, Inc., Tulsa, Oklohoma, [Online] Avail- able: http://www.alliedreliability.com, pp. 4–35, June 6, 2006. [8] E. A. Ogbonnaya, “Modelling vibration-Basic faults in rotor shafts of a gas turbine,” PhD Thesis, Department of Marine Engineering, Rivers State University of Science and Technology, Port Harcourt, Nigeria, p. 251, 2004. [9] B. E. Okah-Avae, “The science of industrial machinery and systems maintenance,” Spectrum Books Ltd, Lagos, Nigeria, pp. 19–105, 1996. [10] W. P. P. Ralph, “Maintenance management and control,” in Handbook of Industrial Engineering: Technology and Operations Management, 3rd Ed., Inc. New York, USA, pp. 1611–1615, 2001. [11] IRD Mechanalysis, “Vibration monitoring and analysis handbook,” IRD Mechanalysis, Inc., Columbus, USA, pp. 1.7–5.7, 1993. [12] J. T. Broch, “Mechanical vibration and shock measure- ment,” 2nd Ed., K. Larsen & Son A/S, Denmark, pp. 197– 199, 1980. [13] K. A. Oladejo and A. O. Oke, “Condition monitoring of a centrifugal pump,” in Pump Maintenance, Arcedem Se- minar Paper, Ibadan, Nigeria, pp. 6–10, 2005. [14] E. P. Agbese and A. Mohammed, “Artificial neural net- work and their applications,” Proceedings of First Na- tional Conference of the Department of Mechanical En- gineering on Manufacturing Technology and Engineering in a Developing Economy, University of Uyo, Nigeria, May 2–3, pp 51–55, 2001. [15] J. S. Carlton, C. G. Holland, M. J. Newbury, D. Rhoden, and D. A. Triner, “Recent operational experience and re- search relating to marine machinery condition monitor- ing,” Trans IMarE, Vol. 109, No. 1, pp. 75–95, 1997. [16] E. A. Ogbonnaya, K. D. H. Bob-Mannual, I. E. Douglas, and H. I. Hart, “Application of artificial neural networks to gas turbine rotor shaft faults diagnosis,” Journal of Science and Technology Research, Vol. 3, No. 1, pp. 12–15, 2004. [17] K. Farhad, A. P. Mehmet, and M. Ehsan, “A new genera- tion motion-control system for twin-hull vessels using a neural optimal controller,” Marine Technology and Sname News, Vol. 40, No. 3, pp. 168–180, 2003.  C. I. UGECHI ET AL. Copyright © 2009 SciRes. ENGINEERING 187 Appendix Abbreviations and Nomenclature AFE After fault elimination AI Artificial Intelligence ANN Artificial neural-network a vibration acceleration BS British Standard CM Condition monitoring cpm Cycles per minute ƒ vibration frequency G Large machines having electric motors of above 300kW power g-SE Unit of spike energy ISO International Standards Organization K Small machines having electric motors of up to 15kW power M Medium machines having electric motors of be- tween 15 and 300kW power MS/L Measurement location MS/S Measurement sequence N Number of hidden layers PdM Predictive maintenance PM Preventive maintenance RMS Root mean square RPM Revolutions per minute T Turbo machines VA Vibration velocity in axial direction (mm/sec) VB Visual Basic VH Vibration velocity in horizontal direction (mm/sec) VV Vibration velocity in vertical direction (mm/sec) v vibration velocity (mm/sec) x vibration displacement (mm) Z Number of output layers ΔF Change in vibration frequency ΔP Change in active power ΔSE Change in equipment spike energy ΔV Change in vibration velocity amplitude µm Micrometre Glossary: Dominant frequency: Frequency at which the largest vibra- tion-amplitude occurs. Field vibration-data: Measured vibration data collected from running machines. Fundamental frequency: Basic repetition of the rotating equip- ment; i. e. the first harmonic. |