

Paper Menu >>
Journal Menu >>
 Modern Economy, 2011, 2, 735-742 doi:10.4236/me.2011.25082 Published Online November 2011 (http://www.SciRP.org/journal/me) Copyright © 2011 SciRes. ME 735 Speed of Adjustment and Infraday/Intraday Volatility in the Italian Stock and Futures Markets Pietro Gottardo Dipartimento di Ricerche Aziendali, Facoltà di Economia, Pavia, Italy E-mail: [email protected] Received July 15, 201 1; revised August 19, 2011; accepted September 1, 201 1 Abstract We estimate the speed of adjustment of prices to value changes in the Italian stock and futures markets using variances in different return intervals. The paper presents evidence that an assumption of linearity for the relationship volatility-time is untenable when intraday and infraday data are used jointly. Prices adjust to new information within three days, but the process is complex with evidence of overshooting and divergent movements in the smaller return intervals. Firms behave differently according to their inclusion or exclusion from the MIB30 index. The speed of adjustment is strongly related to firm-specific characteristics and the log of capitalization explains some of the cross-sectional variability in the adjustment coefficients for most of the return intervals. Keywords: Speed of Adjustment, Overshooting, Intraday returns, Stock Index Future 1. Introduction The growing body of evidence on stock returns predict- ability and overreaction challenges the traditional effi- ciency view that stock prices reflect fully and quickly all the relevant information. Event-based return predictabil- ity, long term reversals and short term momentum, ex- cessive stock prices volatility relative to fundamentals are some of the findings of a large number of empirical works in different areas, countries and time periods. Daniel-Hirshleifer and Subrahmanyam [1] cite a large sample of the relevant literature on these topics. There is disagreement over the interpretation of this evidence. The anomalies may be considered normal chance deviations from the fundamental efficiency law as suggested by Fama [2], but the regularity and dimen- sion of these phenomena cast some doubt on the appro- priateness of this hypothesis. An alternative explanation is that many empirical regularities represent variations in rational risk premia, even if this requires an asset pricing model with extreme variability in marginal utility across states and has other undesirable implications. Daniel-Hirshleifer and Subrahmanyam [1] suggest a psychological model based on imperfect rationality, in particular they construct their model on two well-known psychological biases: investor overconfidence about the precision of his private information, and biased self-at- tribution which causes individuals to strongly attribute events that confirm the validity of their actions to high ability and events that disconfirm the action to external noise or sabotage. Another stream of literature suggests instead a lagged adjustment of security prices to new information. Patell- Wolfson [3] and Hasbrouck-Ho [4] are just two exam- ples of empirical studies showing that prices tak e time to adjust to news. Patell-Wolfson [3] examine intraday price changes associated with earnings announcements. From a theoretical perspective the derivation of a partial price adjustment model in security markets, showing that this is the result of optimizing behavior by market mak- ers is due to Garbade-Silber [5,6]. Goldman-Beja [7], Amihud-Mendelson [8], and Damodaran [9] describe a return process that can be applied to portfolios and ind ex futures as well as single stocks which permits the deriva- tion of a measure for the price adjustment coefficient. The model derived in Amihud-Mendelson [8] and in Damodaran [9] distinguishes between observed prices and intrinsic value of a stock, measuring a finite speed of adjustment of prices to value changes using the informa- tion in various return intervals. The screening among all these models is just an em- pirical matter, only the real behavior of prices in security markets can shed some light on the subject. In what fol- lows we use Damodaran adjustment model in the correct  P. GOTTARDO 736 form derived by Brisley-Theobald [10], with a signifi- cant difference in h is assumption with resp ect to the rela- tionship between time and v olatility, to analyze the price adjustment in the Italian futures and stock markets. The primary contribution of this paper is a refinement of the model in Damodaran [9] to account for the estimation of adjustment coefficients using together intraday and in- fradaily data and its application to a new data-set to dis- entangle the relative merits of the above models. We calculate returns and variances over non-overlapping periods and estimate the price adjustment coefficients at intraday intervals of five, fifteen, thirty, sixty minutes, two, four, and eight hours and at infraday frequencies from one to ten days. The relationship between time and volatility is a key empirical problem, usually solved as- suming the linearity of this relationship. Using on ly daily returns a linear approximation could be reasonable but not with the inclusion of in traday returns. As we show in section 3 the inclusion of both infraday and intraday measurement intervals has a severe impact on the linear- ity of the relationship, so that the usual assumption is untenable using datasets and models that take into ac- count jointly information on the volatility within a trad- ing day (intraday intervals) and across trading days (in- fraday interv als). Section 2 presents the price adjustment model used. We analyze in section 3 the return behavior of the Italian stock index and stock index futures together with a selection of single stocks. The choice is useful to screen possible differential adjustment processes for the index, futures and the single securities as half of this sample is given by stocks not included in the index over which the futures contract is designed. Section 4 con- cludes with a discussion of our results and some policy implications about the efficiency and liquidity improve- ment of the assets negotiated in these markets. 2. Price-Adjustment Model The price adjustment model of Amihud and Mendelson [8] distinguishes between the intrinsic value of a stock, futures or portfolio, Vt, and the observed price, Pt. A generalization of their interpretation of this model allows for market-related, specific information and noise to be reflected in the return process, resulting in an im- perfect (partial or lagged) price adjustments to value changes, but also for overshooting phenomena (a more- than-perfect adjustment) or divergence from value. The basic model is ,,1,,1 , it itit itit P PgVP u (1) where g represents the speed of price adjustment: g = 1 implies a full and almost immediate (as the one period lag can be small as you like) adjustment of prices to every change in value, g > 1 represents a tendency for the asset to overreact to news affecting its value, whereas 0 < g < 1 includes all cases of partial and lagged adjust- ment. Last but not least for importance is the case when g < 0 that implies price divergence from the intrinsic value. The possibilities of overreaction or divergence from value have been totally neglected in the theoretical de- velopments of this model by Amihud-Mendelson [8] and Damodaran [9] but given the results in DeBondt-Thaler [11] and the implications of behavioral or psychological models for the price generation process we believe that a careful investigation is called for. The noise term, ui,t in Equation (1) is determined by information and markets structure related factors such as liquidity trading, noise, bid-ask spread. It is assumed to be a sequence of i.i.d. random variables with zero mean and finite variance, σ2i and independent across stocks. To derive a measure of g, Damodaran [9] uses the variances in different return intervals that can be written as ,2 ,,, 2 Var 22 ij ijt ij ij g Rjv gg 2 (2) where Var(Ri,jt) is the variance for the observed returns assuming j as measurement interval, while gj is the ad- justment coefficient measured for the same j-interval returns, and v2 is the variance of the intrinsic value proc- ess. A restrictive by-product of the original assumptions of this model is that v2 is linear in j, as {Vt} is an i.i.d. ran- dom variable and the intrinsic variance and noise proc- esses are assumed to be independent. This assumption is apparently innocuous given that a linear relationship between volatility and calendar time is almost standard in many areas of research in finance. Unfortunately even with daily data it is a well known and established result that a linear relation between volatility and time is at best a first approximation as weekends and other non-work- ing holidays have a less than proportional effect on stock volatility. The problem is of great concern here because our intention is to measure the price adjustment coeffi- cients using together intraday and infradaily data, see for instance Amihud-Mendelson [12], Amihud-Mendelson and Murgia [13], and Gottardo [14]. To the degree that this hypothesis is violated, the model estimates of gj will be grossly flawed. We suggest to replace Equation (2) with the following more general formulation: ,2 ,,, 2 Var() 22 ij ijt ij ij g Rfjv gg 2 (2’) analyzing three different forms for the relationship be- Copyright © 2011 SciRes. ME  P. GOTTARDO Copyright © 2011 SciRes. ME 737 tween intrinsic volatility and return measurement inter-val: 1 () 1 and 1 for 1 1 for empirical average relation between t ime and volatility jjk fj jdj kdjldlj k The first one is the usual assumption of linearity in variance while the second form give us some freedom particularly u seful if we choose the poin t of discontinu ity l of this relationship to represent the passage from intra- day to infraday return intervals. With the third formulation we relay on the data to de- termine without theoretical constraints what is the em- pirical law characterizing the volatility evolution through measurement intervals. We can now use a sequence of n observed unit-inter- val returns to estimate the variances for different return intervals (j = 1, 2,…, k) and assume that this sequence is of sufficient length to allow gk = 1. Given Equation (2’) we can then derive the price adjustment coefficients gj if we impose some structure for the noise and intrinsic variance components. The assumption in Damodaran [9] was that the two components could be written as functions of the covari- ance and variance in k-interval returns. But this is just a matter of convenience, the model offers no theoretical support for this choice. We retain only partially this hy- pothesis assuming the intrinsic variance to be function of the k-interval variance while the noise component de- pends from all the auto-covariances in the infraday return intervals. The reason is that while the choice of the k- interval variance is innocuous and easily in terchangeable given a clear association between volatility and time, this is untrue for the covariances that change in a manner unpredictable through time with large swings even from positive to negative values and vice-versa. Using the average auto-covariance over all infraday intervals we minimize the effect on the results obtaining more stable gj’s estimates. Writing the noise and intrinsic variance components as 2,,1 Cov , iijtijt ljkRR (3) ,, 2Var() 2Cov, ikti jti jt RRR vk ,1 (4) On the base of Equation (2’) we can calculate for each in- terval j, the difference between the variance in j-interval returns and the equivalent variance in k-interval returns. Substituting for v2 and σ2 and solving through for gj, we get Equation (5). In theory (5) could be used to estimate the speed of adjustment for return intervals until j = k – 1, with only the information available in the time series of unit-in- terval returns data. In practice given that unit-interval returns of intraday frequency do not contain information with respect to the overnight returns we need an addi- tional data source that could be represented by the daily stock returns. 3. Estimation and Results 3.1. Data Sample and Methodological Choices To estimate the speed of price adjustment, we use 5 min- utes as unit-interval from July 4, 1995 to May 30, 1997. The sample includes the index of the 30 most important Italian stocks (MIB30), the futures contract on this index (FIB30), all the firms included in the MIB30 (for the whole sample period or partially) as well as the biggest firms not included in this index. The final sample is composed of 58 stocks listed on the Italian Stock Ex- change. The primary reason for the sample size and the crite- rion for inclusion was the availability of data combined with enough liquidity for each stock. We use all returns from opening to close (10 a.m. to 17 p.m. for the stock market and 9.30 a.m. 17.30 p.m. for the futures market) and the daily returns to estimate for each stock, the index and the futures, the variances with return frequencies ranging from five minutes to ten days. We calculate returns and variances over non-overlap- ping periods and estimate the price adjustment coeffi- cients at intervals of five, fifteen, thirty, sixty minutes, two, four, and eight hours and at daily frequencies from one to ten days. The first empirical problem to solve is related to the relationship between time and volatility. Using only daily returns a linear approximation could be reasonable but not with the inclusion of intraday returns. The plot in the Figure 1 below shows the average stock volatility for the intraday return intervals. As can be seen a linear relationship is acceptable as a first ap- proximation only for the intervals between two and eight ,,,1 , ,,,, 2Var() Cov,() Var()( )Var()2Cov, ijtijtijt ij ijtiktijtijt RfjRR fj g RfjRkRR k 1 (5) 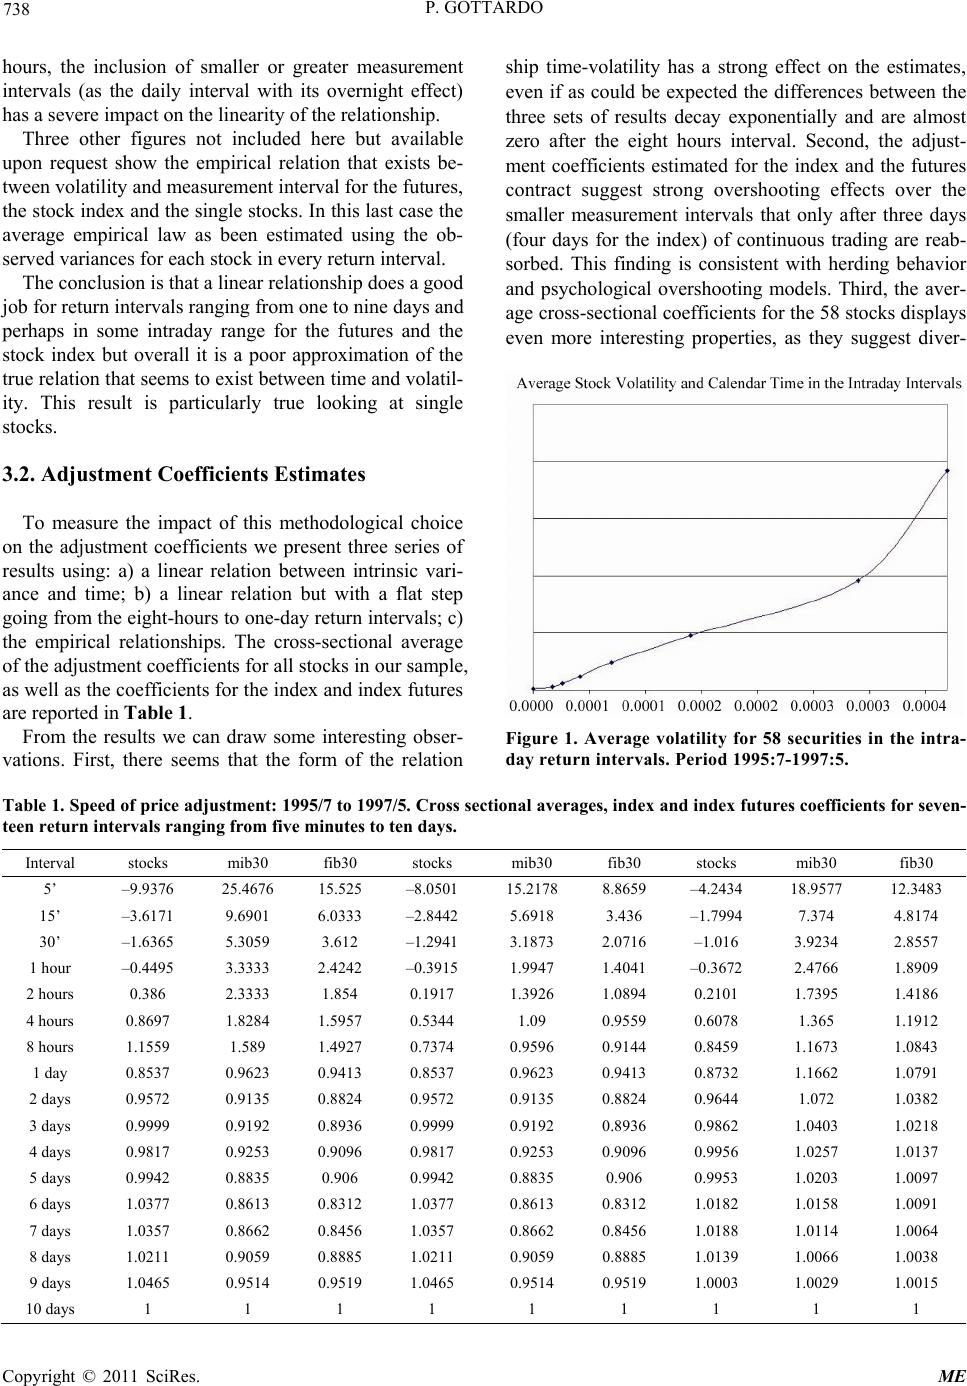 P. GOTTARDO 738 hours, the inclusion of smaller or greater measurement intervals (as the daily interval with its overnight effect) has a severe impact on the linearity of the relationship. Three other figures not included here but available upon request show the empirical relation that exists be- tween volatility and measurement interval for the futures, the stock index and the single stocks. In this last case the average empirical law as been estimated using the ob- served variances for each stock in every return interval. The conclusion is that a linear relationship does a good job for return intervals ranging from one to nine days and perhaps in some intraday range for the futures and the stock index but overall it is a poor approximation of the true relation that seems to exist between time and volatil- ity. This result is particularly true looking at single stocks. 3.2. Adjustment Coefficients Estimates To measure the impact of this methodological choice on the adjustment coefficients we present three series of results using: a) a linear relation between intrinsic vari- ance and time; b) a linear relation but with a flat step going from the eight-hours to one-day return intervals; c) the empirical relationships. The cross-sectional average of the adjustment coefficients for all stocks in our sample, as well as the coefficients for the index and index futures are reported in Table 1. From the results we can draw some interesting obser- vations. First, there seems that the form of the relation ship time-volatility has a strong effect on the estimates, even if as could be expected the differences between the three sets of results decay exponentially and are almost zero after the eight hours interval. Second, the adjust- ment coefficients estimated for the index and the futures contract suggest strong overshooting effects over the smaller measurement intervals that only after three days (four days for the index) of continuous trading are reab- sorbed. This finding is consistent with herding behavior and psychological overshooting models. Third, the aver- age cross-sectional coefficients for the 58 stocks displays even more interesting properties, as they suggest diver- Figure 1. Average volatility for 58 securities in the intra- day return intervals. Period 1995:7-1997:5. Table 1. Speed of price adjustment: 1995/7 to 1997/5. Cross sectional averages, index and index futures coefficients for seven- teen return intervals ranging from five minutes to ten days. Interval stocks mib30 fib30 stocks mib30 fib30 stocks mib30 fib30 5’ –9.9376 25.4676 15.525 –8.0501 15.2178 8.8659 –4.2434 18.9577 12.3483 15’ –3.6171 9.6901 6.0333 –2.8442 5.6918 3.436 –1.7994 7.374 4.8174 30’ –1.6365 5.3059 3.612 –1.2941 3.1873 2.0716 –1.016 3.9234 2.8557 1 hour –0.4495 3.3333 2.4242 –0.3915 1.9947 1.4041 –0.3672 2.4766 1.8909 2 hours 0.386 2.3333 1.854 0.1917 1.3926 1.0894 0.2101 1.7395 1.4186 4 hours 0.8697 1.8284 1.5957 0.5344 1.09 0.9559 0.6078 1.365 1.1912 8 hours 1.1559 1.589 1.4927 0.7374 0.9596 0.9144 0.8459 1.1673 1.0843 1 day 0.8537 0.9623 0.9413 0.8537 0.9623 0.9413 0.8732 1.1662 1.0791 2 days 0.9572 0.9135 0.8824 0.9572 0.9135 0.8824 0.9644 1.072 1.0382 3 days 0.9999 0.9192 0.8936 0.9999 0.9192 0.8936 0.9862 1.0403 1.0218 4 days 0.9817 0.9253 0.9096 0.9817 0.9253 0.9096 0.9956 1.0257 1.0137 5 days 0.9942 0.8835 0.906 0.9942 0.8835 0.906 0.9953 1.0203 1.0097 6 days 1.0377 0.8613 0.8312 1.0377 0.8613 0.8312 1.0182 1.0158 1.0091 7 days 1.0357 0.8662 0.8456 1.0357 0.8662 0.8456 1.0188 1.0114 1.0064 8 days 1.0211 0.9059 0.8885 1.0211 0.9059 0.8885 1.0139 1.0066 1.0038 9 days 1.0465 0.9514 0.9519 1.0465 0.9514 0.9519 1.0003 1.0029 1.0015 10 days 1 1 1 1 1 1 1 1 1 Copyright © 2011 SciRes. ME 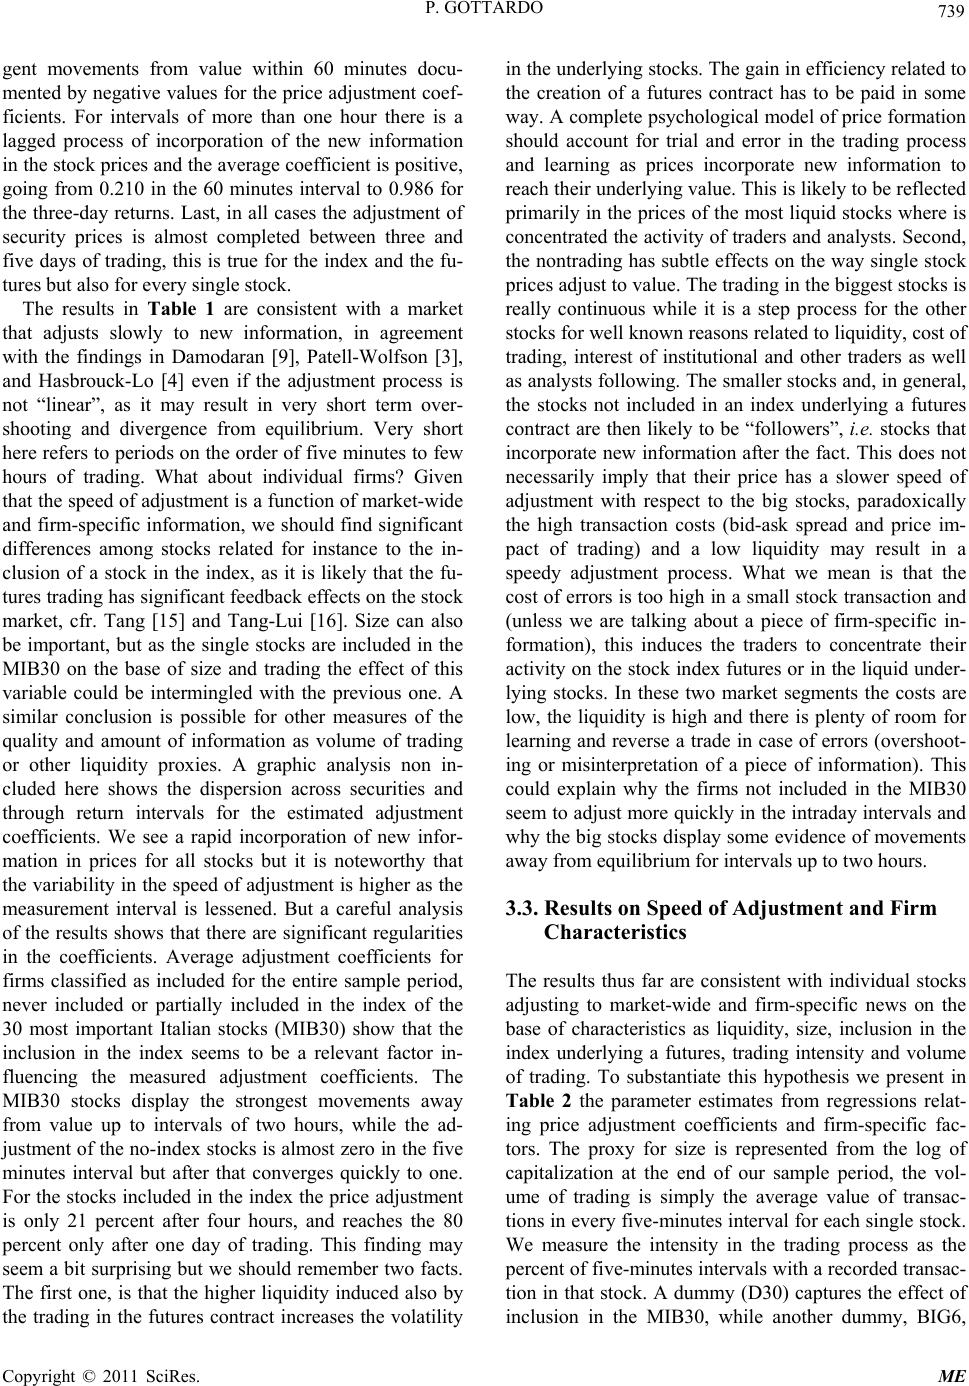 P. GOTTARDO 739 gent movements from value within 60 minutes docu- mented by negative values for the price adjustment coef- ficients. For intervals of more than one hour there is a lagged process of incorporation of the new information in the stock prices and the average coefficient is positive, going from 0.210 in the 60 minutes interval to 0.986 for the three-day returns. Last, in all cases the adjustment of security prices is almost completed between three and five days of trading, this is true for the index and the fu- tures but also for every single stock. The results in Table 1 are consistent with a market that adjusts slowly to new information, in agreement with the findings in Damodaran [9], Patell-Wolfson [3], and Hasbrouck-Lo [4] even if the adjustment process is not “linear”, as it may result in very short term over- shooting and divergence from equilibrium. Very short here refers to periods on the order of five minutes to few hours of trading. What about individual firms? Given that the speed of adjustment is a function of market-wide and firm-specific information, we should find significant differences among stocks related for instance to the in- clusion of a stock in the index, as it is likely that the fu- tures trading has significant feedback effects on the stock market, cfr. Tang [15] and Tang-Lui [16]. Size can also be important, but as the single stocks are included in the MIB30 on the base of size and trading the effect of this variable could be intermingled with the previous one. A similar conclusion is possible for other measures of the quality and amount of information as volume of trading or other liquidity proxies. A graphic analysis non in- cluded here shows the dispersion across securities and through return intervals for the estimated adjustment coefficients. We see a rapid incorporation of new infor- mation in prices for all stocks but it is noteworthy that the variability in the speed of adjustment is higher as the measurement interval is lessened. But a careful analysis of the results shows that there are significant regularities in the coefficients. Average adjustment coefficients for firms classified as included for the entire sample period, never included or partially included in the index of the 30 most important Italian stocks (MIB30) show that the inclusion in the index seems to be a relevant factor in- fluencing the measured adjustment coefficients. The MIB30 stocks display the strongest movements away from value up to intervals of two hours, while the ad- justment of the no-index stocks is almost zero in the five minutes interval but after that converges quickly to one. For the stocks included in the index the price adjustment is only 21 percent after four hours, and reaches the 80 percent only after one day of trading. This finding may seem a bit surprising but we should remember two facts. The first one, is that the higher liquidity induced also by the trading in the futures contract increases the volatility in the underlying stocks. The gain in efficiency related to the creation of a futures contract has to be paid in some way. A complete psychological model of price formation should account for trial and error in the trading process and learning as prices incorporate new information to reach their underlying value. This is likely to be reflected primarily in the prices of the most liquid stocks where is concentrated the activity of traders and analysts. Second, the nontrading has subtle effects on the way single stock prices adjust to value. The trading in the biggest stocks is really continuous while it is a step process for the other stocks for well known reasons re lated to liquidity, cost of trading, interest of institutional and other traders as well as analysts following. The smaller stocks and, in general, the stocks not included in an index underlying a futures contract are then likely to be “followers”, i.e. stocks that incorporate new information after the fact. This does not necessarily imply that their price has a slower speed of adjustment with respect to the big stocks, paradoxically the high transaction costs (bid-ask spread and price im- pact of trading) and a low liquidity may result in a speedy adjustment process. What we mean is that the cost of errors is too high in a small stock transaction and (unless we are talking about a piece of firm-specific in- formation), this induces the traders to concentrate their activity on the stock index futures or in the liquid under- lying stocks. In these two market segments the costs are low, the liquidity is high and there is plenty of room for learning and reverse a trade in case of errors (overshoot- ing or misinterpretation of a piece of information). This could explain why the firms not included in the MIB30 seem to adjust more quickly in the intraday intervals and why the big stocks display some evidence of movements away from equilibrium for intervals up to two hours. 3.3. Results on Speed of Adjustment and Firm Characteristics The results thus far are consistent with individual stocks adjusting to market-wide and firm-specific news on the base of characteristics as liquidity, size, inclusion in the index underlying a futures, trading intensity and volume of trading. To substantiate this hypothesis we present in Table 2 the parameter estimates from regressions relat- ing price adjustment coefficients and firm-specific fac- tors. The proxy for size is represented from the log of capitalization at the end of our sample period, the vol- ume of trading is simply the average value of transac- tions in every five-minutes interval for each single stock. We measure the intensity in the trading process as the percent of five-minutes intervals with a recorded transac- tion in that stock. A dummy (D30) captures the effect of inclusion in the MIB30, while another dummy, BIG6, Copyright © 2011 SciRes. ME 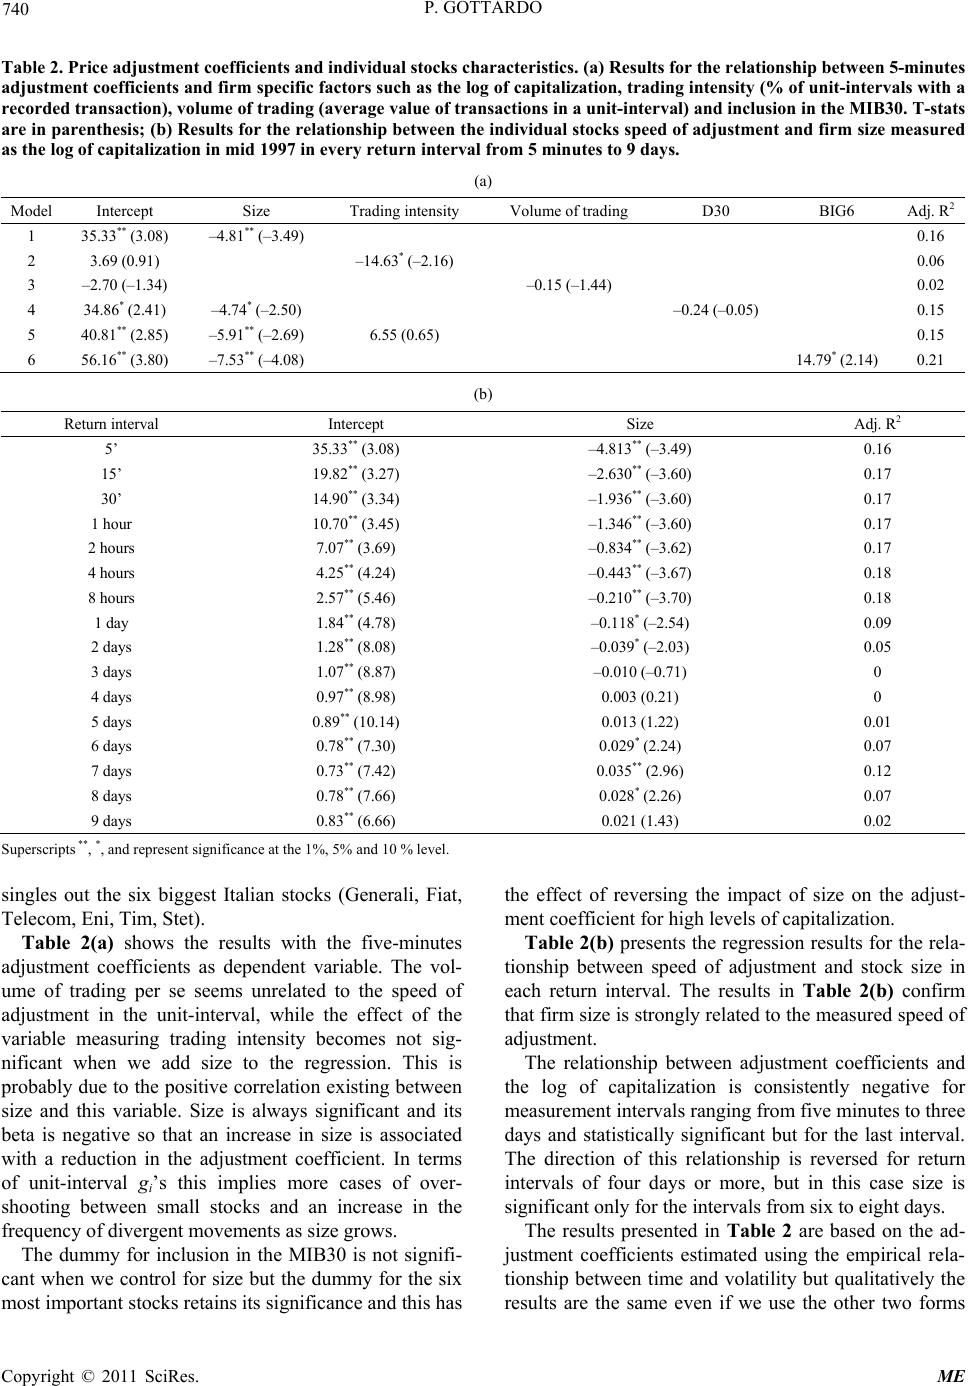 P. GOTTARDO 740 Table 2. Price adjustment coe ffic ients and individual stocks characteristics. (a) Results for the relationship between 5-minute s adjustment coefficients and firm specific factors such as the log of capitalization, trading intensity (% of unit-intervals with a recorded transaction), volume of trading (average value of transactions in a unit-interval) and inclusion in the MIB30. T-stats are in parenthesis; (b) Results for the relationship between the individual stocks speed of adjustment and firm size measured as the log of capitalization in mid 1997 in every return interval from 5 minutes to 9 days. (a) Model Intercept Size Trading intensity Volume of trading D30 BIG6 Adj. R2 1 35.33** (3.08) –4.81** (–3.49) 0.16 2 3.69 (0.91) –14.63* (–2.16) 0.06 3 –2.70 (–1.34) –0. 15 ( –1. 44) 0.02 4 34.86* (2.41) –4.74* (–2.50) –0.24 (–0.05) 0.15 5 40.81** (2.85) –5.91** (–2.69) 6.55 (0.65) 0.15 6 56.16** (3.80) –7.53** (–4.08) 14.79* ( 2.14) 0.21 (b) Return interval Intercept Size Adj. R2 5’ 35.33** (3.08) –4.813** (–3.49) 0.16 15’ 19.82** (3.27) –2.630** (–3.60) 0.17 30’ 14.90** (3.34) –1.936** (–3.60) 0.17 1 hour 10.70** (3.45) –1.346** (–3.60) 0.17 2 hours 7.07** (3.69) –0.834** (–3.62) 0.17 4 hours 4.25** (4.24) –0.443** (–3.67) 0.18 8 hours 2.57** (5.46) –0.210** (–3.70) 0.18 1 day 1.84** (4.78) –0.118* (–2.54) 0.09 2 days 1.28** (8.08) –0.039* (–2.03) 0.05 3 days 1.07** (8.87) –0.010 (–0.71) 0 4 days 0.97** (8.98) 0.003 (0.21) 0 5 days 0.89** (10.14) 0.013 (1.22) 0.01 6 days 0.78** (7.30) 0.029* (2.24) 0.07 7 days 0.73** (7.42) 0.035** (2.96) 0.12 8 days 0.78** (7.66) 0.028* (2.26) 0.07 9 days 0.83** (6.66) 0.021 (1.43) 0.02 Superscripts **, *, and represent significance at the 1%, 5% and 10 % level. singles out the six biggest Italian stocks (Generali, Fiat, Telecom, Eni, Tim, Stet). Table 2(a) shows the results with the five-minutes adjustment coefficients as dependent variable. The vol- ume of trading per se seems unrelated to the speed of adjustment in the unit-interval, while the effect of the variable measuring trading intensity becomes not sig- nificant when we add size to the regression. This is probably due to the positive correlation existing between size and this variable. Size is always significant and its beta is negative so that an increase in size is associated with a reduction in the adjustment coefficient. In terms of unit-interval gi’s this implies more cases of over- shooting between small stocks and an increase in the frequency of divergent movements as size grows. The dummy for inclusion in the MIB30 is not signifi- cant when we control for size but the dummy for the six most important stocks retains its significance and this has the effect of reversing the impact of size on the adjust- ment coefficient for high levels of capitalization. Table 2(b) presents the regression results for the rela- tionship between speed of adjustment and stock size in each return interval. The results in Table 2(b) confirm that firm size is strongly related to the measured speed of adjustment. The relationship between adjustment coefficients and the log of capitalization is consistently negative for measurement intervals ranging from five minutes to three days and statistically significant but for the last interval. The direction of this relationship is reversed for return intervals of four days or more, but in this case size is significant only for the intervals from six to eight days. The results presented in Table 2 are based on the ad- justment coefficients estimated using the empirical rela- tionship between time and volatility but qualitatively the results are the same even if we use the other two forms Copyright © 2011 SciRes. ME  P. GOTTARDO 741 of the relationship. Overall our results support the proposition that stock prices adjust slowly to new information but in a different manner for small and big firms and this is reflected in a highly significant relation between adjustment coeffi- cients and stock size. The inclusion in the MIB30 index does not seem to be a relevant factor but this is the result of two facts. First, only the biggest stocks are included in the index, adding size as explanatory variable is likely to dim any effect related to a dummy controlling for the participation in the index. Second, among the big firms the trading is highly concentrated in few stocks and is not by chance that in Table 2(a) a dummy like BIG6 is significant even when the MIB30 dummy is added to model 6 (not shown). These six stocks are the core of every portfolio whose aim is to replicate the index and are necessary to implement any strategy requiring trading in the futures and the unde rl ying m a rk et . 4. Conclusions The degree of efficiency in the stock and futures markets can be measured by the speed with which prices adjust to incorporate new information. This process may be slow with prices that take time to reflect value changes or very speedy. It is also possible that in very short intervals or in the long period prices display patterns that lead away from equilibrium (at least temporarily) or give rise to under and ov erreaction phenomen a. This paper adapts the model developed in Amihud- Mendelson [8] and Damodaran [9] to consider jointly intraday and infraday data. The speed of adjustment is estimated as function of the variances in different return intervals from five minutes to ten days, as well as the covariances in the infraday intervals. The approach is then applied to the Italian index (MIB30) and index fu- tures (FIB30), and to a sample of the most important stocks listed in this market. We show that the assumptions about the form of the relationship between return volatility and time are critical for the measured adjustment coefficients, the hypothesis of linearity cannot be accepted using jointly intraday and infraday returns as the resulting estimates are grossly inflated for the smaller measurement intervals. We find evidence that prices adjust slowly to new information, three to five days of trading are necessary to complete the adjustment and this is true for the index futures but also on average for each individual stock. We also find evidence that there is no simple intraday adjustment process, the futures seems to overreact for small return intervals, while on average the individual stocks diverge from value for intervals up to two hours and then show a pattern of lagged adjustment. There are peculiar regularities in the price adjustment of single stocks and the firms included in the index un- derlying the futures behave differently from the others. The analysis of the relationship between adjustment co- efficients and firm characteristics confirms that size is strongly related to the measured speed of adjustment for most of the measurement intervals 5. References [1] K. Daniel, D. Hirshleifer and A. Subrahmanyam, “Inves- tor Psychology and Security Market Under- and Overre- actions,” Journal of Finance, Vol. 53, No. 6, 1998, pp. 1839-1885. doi:10.1111/0022-1082.00077 [2] E. F. Fama, “Market Efficiency, Long Term Returns and Behavioral Finance,” Journal of Financial Economics, Vol. 49, No. 3, 1998, pp. 283-306. doi:10.1016/S0304-405X(98)00026-9 [3] J. M. Patell and M. A. Wolfson, “The Intraday Speed of Price Adjustment of Stock Prices to Earnings and Divi- dend Announcements,” Journal of Financial Economics, Vol. 13, No. 2, 1984, pp. 223-252. doi:10.1016/0304-405X(84)90024-2 [4] J. Hasbrouck and T. Ho, “Order Arrival, Quote Behavior and the Return-Generating Process,” Journal of Finance, Vol. 42, No. 4, 1987, pp. 1035-1049. doi:10.2307/2328305 [5] K. Garbade and W. Silber, “Structural Organization of Secondary Markets: Clearing Frequency, Dealer Activity and Liquidity Risk,” Journal of Finance, Vol. 34, No. 3, 1979, pp. 577-593. doi:10.2307/2327427 [6] K. Garbade and W. Silber, “Price Movement and Price Discovery in Futures and Cash Markets,” Review of Economics and Statistics, Vol. 65, No. 2, 1983, pp. 289- 297. doi:10.2307/1924495 [7] B. Goldman and A. Beja, “Market Prices vs. Equilibrium Pri ces: Return’s Variance, Serial Correlation, and the Role of the Specialist,” Journal of Finance, Vol. 34, No. 3, 1979, pp. 595-607. doi:10.2307/2327428 [8] Y. Amihud, and H. Mendelson, “Index and Index-Futures Returns,” Journal of Accounting, Auditing & Finance, Vol. 4, No. 2, 1989, pp. 415-431. [9] A. Damodaran, “A Simple Measure of Price Adjustment Coefficients,” Journal of Finance, Vol. 48, No. 1, 1993, pp. 387-400. doi:10.2307/2328896 [10] N. Brisley and M. Theobald, “A Simple Measure of Price Adjustment Coefficients: A Correction,” Journal of Fi- nance, Vol. 51, No. 1, 1996, pp. 381-382. doi:10.2307/2329314 [11] W. F. M. DeBondt and R. H. Thaler, “Does the Stock Market Overreact?” Journal of Finance, Vol. 40, No. 3, 1985, pp. 793-808. doi:10.2307/2327804 [12] Y. Amihud and H. Mendelson, “Trading Mechanisms and Stock Returns: An Empirical Investigation,” Journal of Finance, Vol. 42, No. 3, 1987, pp. 533-553. doi:10.2307/2328369 Copyright © 2011 SciRes. ME  P. GOTTARDO Copyright © 2011 SciRes. ME 742 [13] Y. Amihud, H. Mendelson and M. Murgia, “Stock Mar- ket Microstructure and Return Volatility: Evidence from Italy,” Journal of Banking and Finance, Vol. 14, No. 2-3, 1990, pp. 423-440. doi:10.1016/0378-4266(90)90057-9 [14] P. Gottardo, “Dinamica dei Rendimenti e relazioni lead- lag fra il FIB30 e l’indice MIB30,” Studi e Note di Eco- nomia, Vol. 3, No. 3, 1998, pp. 69-103. [15] G. Y. N. Tang, “Return Volatilities of Stock Index Fu- tures in Hong Kong: Trading vs Non-Trading Periods,” Journal of Derivatives, Vol. 4, No. 1, 1996, pp. 55-62. doi:10.3905/jod.1996.407961 [16] G. Y. N. Tang and D. T. W. Lui, “Intraday and Intraweek Volatility Patterns of Hang Seng Index and Index Futures, and a Test of the Wait-To-Trade Hypothesis,” Pacific- Basin Finance Journal, Vol. 10, No. 4, 2002, pp. 475-495. doi:10.1016/S0927-538X(02)00069-0 |