

Paper Menu >>
Journal Menu >>
 Modern Economy, 2011, 2, 717-728 doi:10.4236/me.2011.25080 Published Online November 2011 (http://www.SciRP.org/journal/me) Copyright © 2011 SciRes. ME 717 The Determinants of Turkish Outward Foreign Direct Investment İbrahim Anıl1, Ismail Armutlulu1, Cem Canel2, Rebecca Porterfield2 1Faculty of Business Administration and Economics, Department of Busi ness Ad mi nist ration, Marmara University, Istanbul, Turkey 2Cameron School of B usiness, University of North Carolina Wilmington, Wilmington, USA E-mail: [email protected] Received July 12, 2011; revised August 20, 2011; accepted September 29, 2011 Abstract The general theory of Foreign Direct Investment (FDI) has been built on the experience of developed coun- tries’ investors. Therefore, there is an extensive amount of literature about firm behaviors in developed countries. Some researchers have started investigating why, how and when developing countries’ firms en- gage in outward FDI. All of these studies have shown that the FDI determinants of firms in newly industrial- ized economies (NIEs) are different from the FDI determinants of firms in developed economies. This study investigates the entry mode and location choice determinants of Turkish firms’ outward direct investments, which are operating in Central Asia, Russia and Balkan Countries, over the period of 1989 to 2005. We find that these investments are associated with high levels of economic and political risks, cultural proximity and lack of ownership advantages. The main purpose of this study is to provide new evidence for these NIE’s outward determinants. Keywords: International Business, Manufacturing, Foreign Direct Investment 1. Introduction Many individual Turkish entrepreneurs made invest- ments during the period of 1989-2005 in the Turkic Re- publics where new market economies emerged following the dissolution of the Soviet Union. These activities were regarded as investment opportunities. Although there have been some studies related specifically to FDI in some Turkic countries [1] there have been few studies about the Turkish FDI’s, analyzing why and how those companies chose outward countries for FDI, their com- petitors, and their performances in those countries. The direct foreign capital investments of Turkish firms most of which emerged as international firms in this re- gion, reached 4644 billion YTL by 2007. Few interna- tional competitors entered these markets, due to percep- tions of the high levels of risk and uncertainties involved. Turkish firms, however, have maintained their activities with considerably high performance. This phenomenon cannot be explained through existing international direct investment theories or by current studies on global emerging firms. The involvement of emerging country firms in direct foreign investment is a wholly original phenomenon in terms of theories of direct investment. Therefore, in this study, data from 107 firms and 169 facilities that directly invested in four Turkic Republics, Bulgaria, Romania and Russia were collected through surveys and in-depth interviews in order to discover the determinants of the investment and location decision making of these firms and the fundamental dynamics of the global emerging firms. In order to ensure an accurate comparison with devel- oped countries’ determinants, the factors affecting the decision making processes of the survey group were ob- tained using the same determinants used to identify the factors within developed countries. Most of the Turkish firms that went to the Turkic Republics for direct in- vestment decided to find new markets and to use the competitive advantage of being the first to enter into the market. Those firms, which found cheap goods, labor, and quality resources decided to invest in these markets only to find appropriate resources whilst totally ignoring the domestic market. Ironically, some of them wanted to export those products. This study explains the research findings and relates them to existing theories. The next section provides the theoretical framework for this study,  İ. ANIL ET AL. 718 section three presents the research findings and section four provides conclusions. 2. Theoretical Framework The majority of the information regarding international business administration is based upon analysis of the behavior of firms in developed countries. All the existing theories of direct investment have been shaped and de- veloped in order to explain the behaviors of the firms in developed countries. Bucklet et al., [2] noted that in- vestment by developing countries in developed or de- veloping markets has emerged as a recent focus of re- search, generally applying existing theories. With the exception of analysis of motivation for FDI in Bulgaria [1], many of the FDI strategies have focused on industry specific motivations [3-5]. The direct capital investments of Turkish firms and of international entrepreneurs display characteristics which differ from the behavior of companies from other devel- oping countries. Hymer [6] used the industrial organiza- tion approach to explain the direct foreign capital in- vestments to developed, and developing countries. Sev- eral researchers [7-9] attempted a similar analysis util- izing the internalization approach which focuses on the motivation of coordinating interconnected functions for purposes of cost reduction and knowledge sharing. Dun- ning [10-12] maintained that the internationalization of production is such a complex process that it cannot be explained by a single theory or approach, and as a re- sponse developed the more comprehensive eclectical approach created from a synthesis of these two ap- proaches. Other theories developed during the same pe- riod include the competitive international industry ap- proach by Vernon [13,14] studies by Kojima [15] to ex- plain Japan’s direct investments, and lastly, foreign capi- tal theories based on firm growth theories by Penrose [16] and Screiber [17]. Dunning’s eclectical approach, also referred to as the Ownership, Location and Internaliza- tion (OLI) approach, maintains a strong position in re- cent studies [18] According to the OLI approach direct capital investments have the advantages of ownership, benefiting from economies of scale, the skills of tech- nology, patent advantage, brand development and unique management skills allowing for duplication in other geo- graphic locations. The advantages of location are the natural resources of the country, the size of the domestic market, the low input costs such as energy and labor, and taxes and subventions. In the internalization set, the ob- jective is usually to make use of the existing deficient competitor conditions in these countries. In this frame- work, two of the three basic motives in Dunning’s ap- proach were taken as the basis of the analysis of deter- minants of direct investments. Thus, those investing in order to seek market or to seek cheap resources (Effi- ciency Seeking) have been grouped separately and the differences between them have been explained [10,19]. Global borning firms are the new phenomena in inter- national business literature. Having been established without passing through the Uppsala model which re- sembles Penrose’s company growth theories [20] and through the phases conceptualized in innovation models [21] these companies [22] have been internationalized by reaching the level at which they can sell at least one quarter of their goods abroad within the first three years of their existence. The studies that have been conducted to explain the behavior of the companies in this area [23- 26] aim to specify the dynamics of global born firms. International born Turkish firms, apart from those, which are global borning firms, are those whose first foundation took place abroad without any ownership advantage. Following the dissolution of the Soviet Union, Turkish companies were established in the newly-independent countries as international firms in order to take advan- tage of the developed countries’ avoidance of these “risky” emerging economies and thus operate in markets free of competition. They were established without con- cern for the level of technological development so as to benefit from the opportunities presented by the market. Based on the assumption that they would not face com- petition for a long period, firms even accepted the risks of high costs of implementing the contracts. Some of the Turkish companies operating in developing markets such as Romania, Turkmenistan, Kazakhstan and Bulgaria play important roles in those domestic competitive mar- kets, with billion dollar annual revenues, the developed technology, the distribution channels and the managerial skills they possess. Findings about the international borning Turkish firms are not familiar to scholars study- ing international investment theories. The emergence into the global economy of Turkish firms has not been the focus of attention amongst theorists and thus, cannot be explained within the framework of generally accepted theories of direct foreign capital investment. 3. Methodology and Research Findings 3.1 Method This study focused on identifying the determinants of Turkish FDI’s in seven countries based on an eques- tionnaire survey format developed by Tatoglu and Glais- ter [27]. The questionnaire was given to 107 firms with wholly owned subsidiaries and 169 facilities in Bulgaria, Romania, Uzbekistan, Kazakhstan, Turkmenistan, Kyr- gyzstan and Russia. We personally went to the countries Copyright © 2011 SciRes. ME 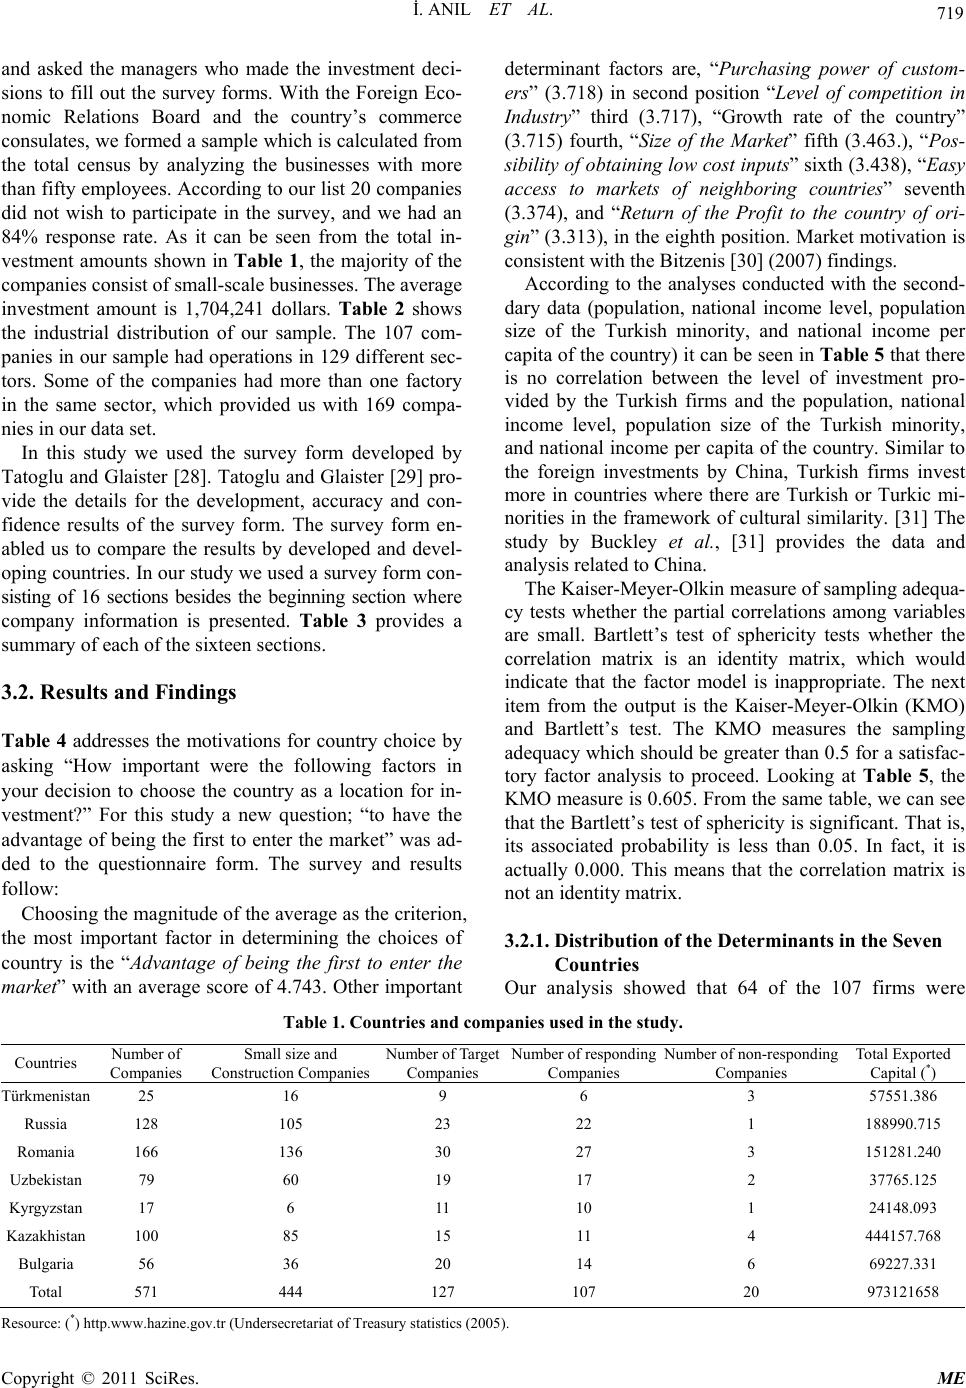 İ. ANIL ET AL. Copyright © 2011 SciRes. ME 719 and asked the managers who made the investment deci- sions to fill out the survey forms. With the Foreign Eco- nomic Relations Board and the country’s commerce consulates, we formed a sample which is calculated from the total census by analyzing the businesses with more than fifty employees. According to our list 20 companies did not wish to participate in the survey, and we had an 84% response rate. As it can be seen from the total in- vestment amounts shown in Table 1, the majority of the companies consist of small-scale businesses. The average investment amount is 1,704,241 dollars. Table 2 shows the industrial distribution of our sample. The 107 com- panies in our sample had operations in 129 different sec- tors. Some of the companies had more than one factory in the same sector, which provided us with 169 compa- nies in our data set. In this study we used the survey form developed by Tatoglu and Glaister [28]. Tatoglu and Glaister [29] pro- vide the details for the development, accuracy and con- fidence results of the survey form. The survey form en- abled us to compare the results by developed and devel- oping countries. In our study we used a survey form con- sisting of 16 sections besides the beginning section where company information is presented. Table 3 provides a summary of each of the sixteen sections. 3.2. Results and Findings Table 4 addresses the motivations for country choice by asking “How important were the following factors in your decision to choose the country as a location for in- vestment?” For this study a new question; “to have the advantage of being the first to enter the market” was ad- ded to the questionnaire form. The survey and results follow: Choosing the magnitude of the average as the criterion, the most important factor in determining the choices of country is the “Advantage of being the first to enter the market” with an average score of 4.743. Other important determinant factors are, “Purchasing power of custom- ers” (3.718) in second position “Level of competition in Industry” third (3.717), “Growth rate of the country” (3.715) fourth, “Size of the Market” fifth (3.463.), “Pos- sibility of obta ining low cost inpu ts” sixth (3.438), “Easy access to markets of neighboring countries” seventh (3.374), and “Return of the Profit to the country of ori- gin” (3.313), in the eighth position. Market motivation is consistent with the Bitzenis [30] (2007) findings. According to the analyses conducted with the second- dary data (population, national income level, population size of the Turkish minority, and national income per capita of the country) it can be seen in Table 5 that there is no correlation between the level of investment pro- vided by the Turkish firms and the population, national income level, population size of the Turkish minority, and national income per capita of the country. Similar to the foreign investments by China, Turkish firms invest more in countries where there are Turkish or Turkic mi- norities in the framework of cultural similarity. [31] The study by Buckley et al., [31] provides the data and analysis related to China. The Kaiser-Meyer-Olkin measure of sampling adequa- cy tests whether the partial correlations among variables are small. Bartlett’s test of sphericity tests whether the correlation matrix is an identity matrix, which would indicate that the factor model is inappropriate. The next item from the output is the Kaiser-Meyer-Olkin (KMO) and Bartlett’s test. The KMO measures the sampling adequacy which should be greater than 0.5 for a satisfac- tory factor analysis to proceed. Looking at Table 5, the KMO measure is 0.605. From the same table, we can see that the Bartlett’s test of sphericity is significant. That is, its associated probability is less than 0.05. In fact, it is actually 0.000. This means that the correlation matrix is not an identity matrix. 3.2.1. Distribution of the Determinants in the Seven Countries Our analysis showed that 64 of the 107 firms were Table 1. Countries and companies used in the study. Countries Number of Companies Small size and Construction Companies Number of Target Companies Number of responding Companies Number of non-responding Companies Total Exported Capital (*) Türkmenistan 25 16 9 6 3 57551.386 Russia 128 105 23 22 1 188990.715 Romania 166 136 30 27 3 151281.240 Uzbekistan 79 60 19 17 2 37765.125 Kyrgyzstan 17 6 11 10 1 24148.093 Kazakhistan 100 85 15 11 4 444157.768 Bulgaria 56 36 20 14 6 69227.331 Total 571 444 127 107 20 973121658 Resource: (*) http.www.hazine.gov.tr (Undersecretariat of Treasury statistics (2005). 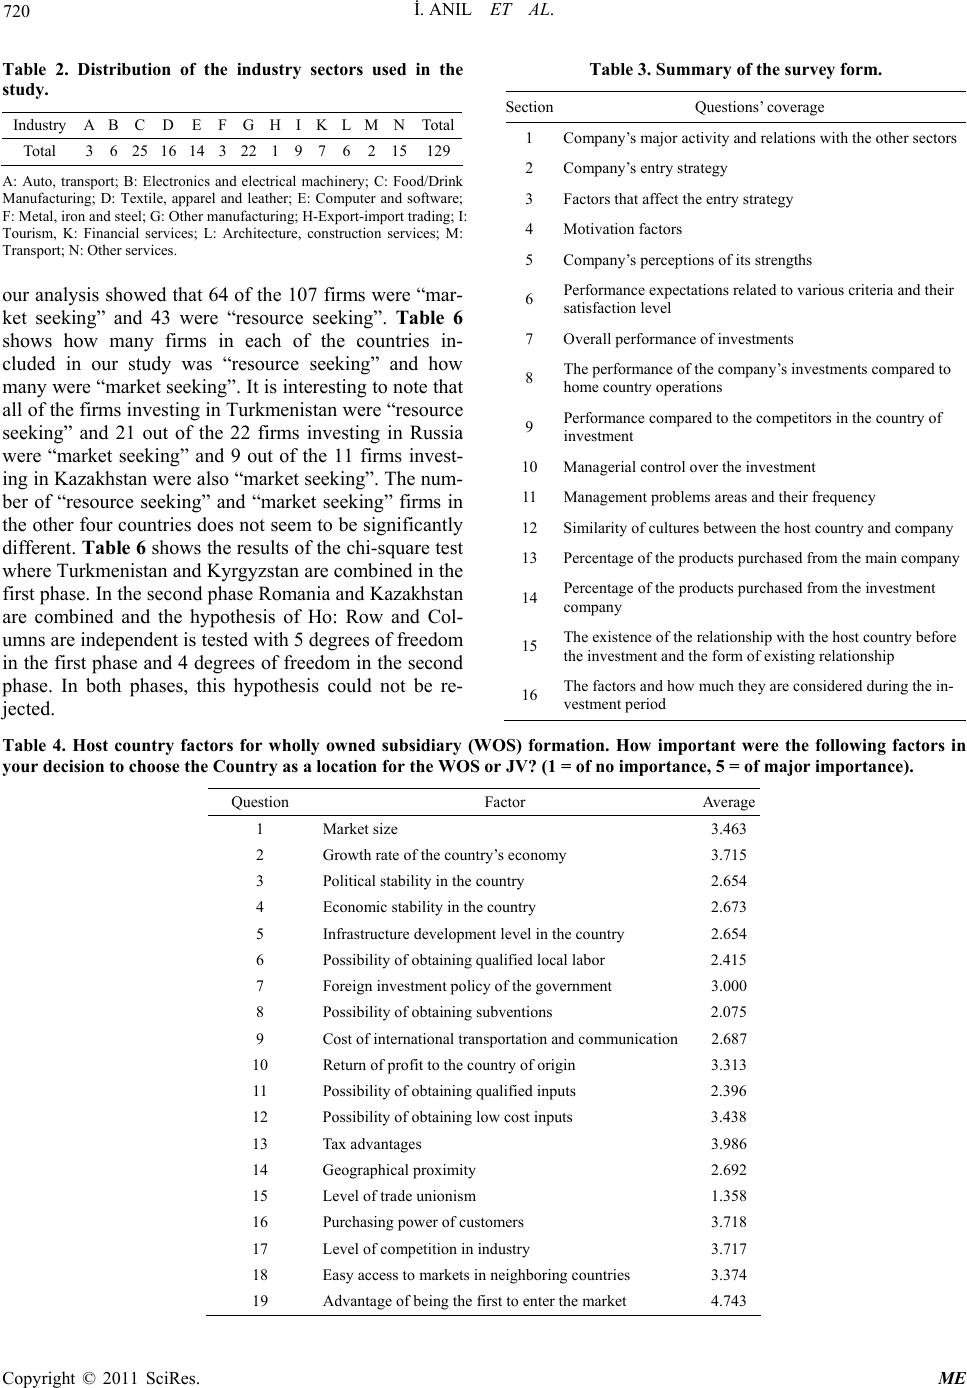 İ. ANIL ET AL. 720 Table 2. Distribution of the industry sectors used in the study. Industry A B C D E F GH I K L M N Total Total 3 6 25 16 14 3 221 9 7 6 2 15129 A: Auto, transport; B: Electronics and electrical machinery; C: Food/Drink Manufacturing; D: Textile, apparel and leather; E: Computer and software; F: Metal, iron and steel; G: Other manufacturing; H-Export-import trading; I: Tourism, K: Financial services; L: Architecture, construction services; M: Transport; N: Other services. our analysis showed that 64 of the 107 firms were “mar- ket seeking” and 43 were “resource seeking”. Table 6 shows how many firms in each of the countries in- cluded in our study was “resource seeking” and how many were “market seeking”. It is interesting to note that all of the firms investing in Turkmenistan were “resource seeking” and 21 out of the 22 firms investing in Russia were “market seeking” and 9 out of the 11 firms invest- ing in Kazakhstan were also “market seeking”. The num- ber of “resource seeking” and “market seeking” firms in the other four countries does not seem to be significantly different. Table 6 shows the results of the chi-square test where Turkmenistan and Kyrgyzstan are combined in the first phase. In the second phase Romania and Kazakhstan are combined and the hypothesis of Ho: Row and Col- umns are independent is tested with 5 degrees of freedom in the first phase and 4 degrees of freedom in the second phase. In both phases, this hypothesis could not be re- jected. Table 3. Summary of the survey form. SectionQuestions’ coverage 1 Company’s major activity and relations with the other sectors 2 Company’s entry strategy 3 Factors that affect the entry strategy 4 Motivation factors 5 Company’s perceptions of its strengths 6 Performance expectations related to various criteria and their satisfaction level 7 Overall performance of investments 8 The performance of the company’s investments compared to home country operations 9 Performance compared to the competitors in the country of investment 10 Managerial control over the investment 11 Management problems areas and their frequency 12 Similarity of cultures between the host country and company 13 Percentage of the products purchased from the main company 14 Percentage of the products purchased from the investment company 15 The existence of the relationship with the host country before the investment and the form of existing relationship 16 The factors and how much they are considered during the in- vestment period Table 4. Host country factors for wholly owned subsidiary (WOS) formation. How important were the following factors in your decision to choose the Country as a location for the WOS or JV? (1 = of no importance, 5 = of major importance). Question Factor Average 1 Market size 3.463 2 Growth rate of the country’s economy 3.715 3 Political stability in the country 2.654 4 Economic stability in the country 2.673 5 Infrastructure development level in the country 2.654 6 Possibility of obtaining qualified local labor 2.415 7 Foreign investment policy of the government 3.000 8 Possibility of obtaining subventions 2.075 9 Cost of international transportation and communication 2.687 10 Return of profit to the country of origin 3.313 11 Possibility of obtaining qualified inputs 2.396 12 Possibility of obtaining low cost inputs 3.438 13 Tax advantages 3.986 14 Geographical proximity 2.692 15 Level of trade unionism 1.358 16 Purchasing power of customers 3.718 17 Level of competition in industry 3.717 18 Easy access to markets in neighboring countries 3.374 19 Advantage of being the first to enter the market 4.743 Copyright © 2011 SciRes. ME 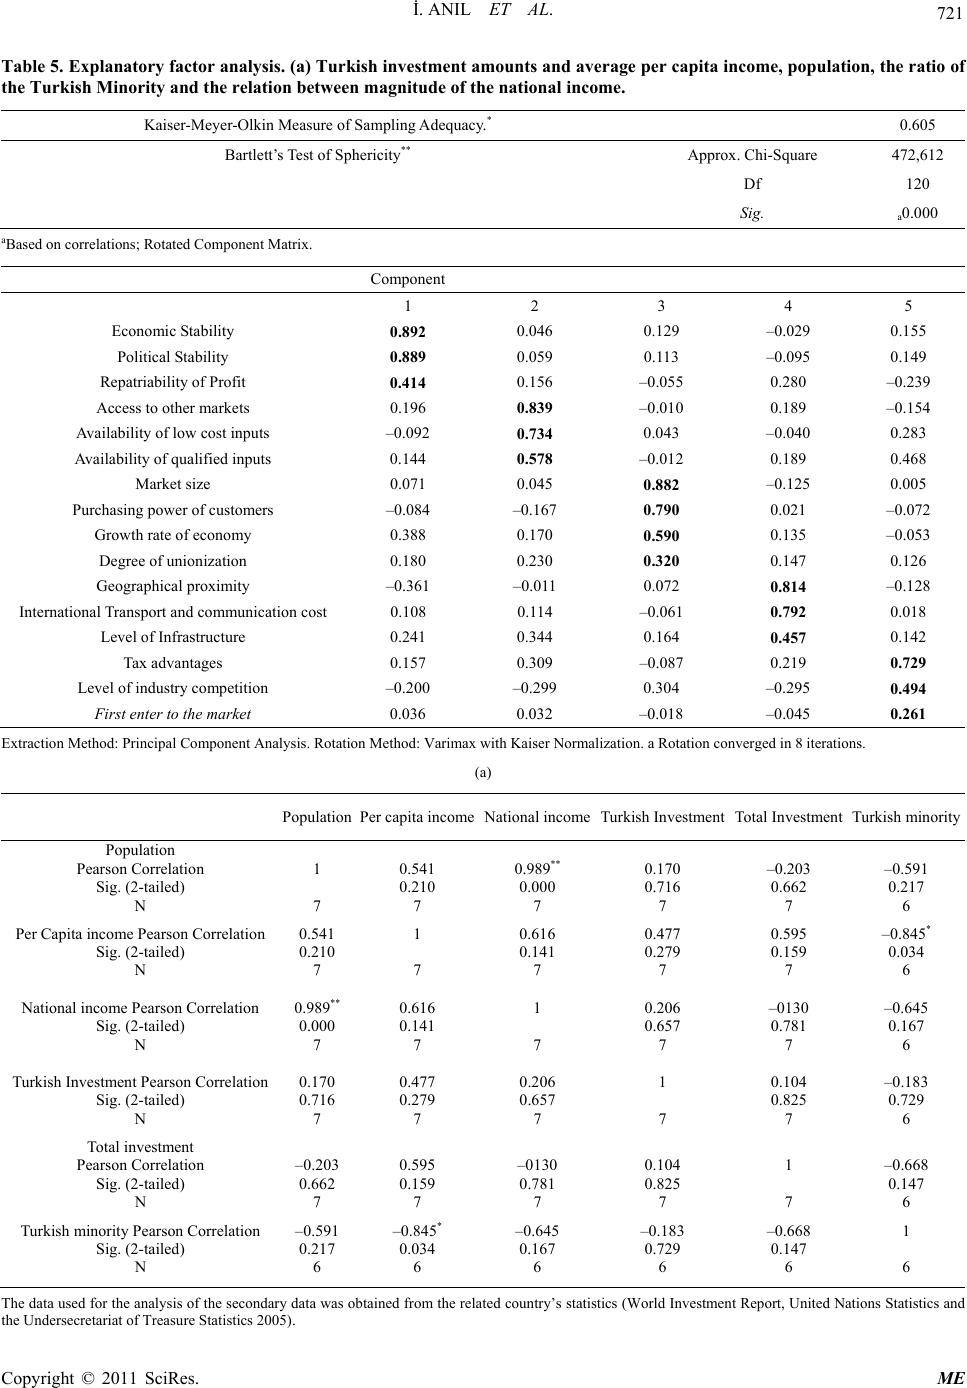 721 İ. ANIL ET AL. Table 5. Explanatory factor analysis. (a) Turkish investment amounts and average per capita income, population, the ratio of the Turkish Minority and the relation between magnitude of the national income. Kaiser-Meyer-Olkin Measure of Sampling Adequacy.* 0.605 Bartlett’s Test of Sphericity** Approx. Chi-Square 472,612 Df 120 Sig. a0.000 aBased on correlations; Rotated Component Matrix. Component 1 2 3 4 5 Economic Stability 0.892 0.046 0.129 –0.029 0.155 Political Stability 0.889 0.059 0.113 –0.095 0.149 Repatriability of Profit 0.414 0.156 –0.055 0.280 –0.239 Access to other markets 0.196 0.839 –0.010 0.189 –0.154 Availability of low cost inputs –0.092 0.734 0.043 –0.040 0.283 Availability of qualified inputs 0.144 0.578 –0.012 0.189 0.468 Market size 0.071 0.045 0.882 –0.125 0.005 Purchasing power of customers –0.084 –0.167 0.790 0.021 –0.072 Growth rate of economy 0.388 0.170 0.590 0.135 –0.053 Degree of unionization 0.180 0.230 0.320 0.147 0.126 Geographical proximity –0.361 –0.011 0.072 0.814 –0.128 International Transport and communication cost 0.108 0.114 –0.061 0.792 0.018 Level of Infrastructure 0.241 0.344 0.164 0.457 0.142 Tax advantages 0.157 0.309 –0.087 0.219 0.729 Level of industry competition –0.200 –0.299 0.304 –0.295 0.494 First enter to the market 0.036 0.032 –0.018 –0.045 0.261 Extraction Method: Principal Component Analysis. Rotation Method: Varimax with Kaiser Normalization. a Rotation converged in 8 iterations. (a) Population Per capita incomeNational incomeTurkish InvestmentTotal Investment Turkish minority Population Pearson Correlation Sig. (2-tailed) N 1 7 0.541 0.210 7 0.989** 0.000 7 0.170 0.716 7 –0.203 0.662 7 –0.591 0.217 6 Per Capita income Pearson Correlation Sig. (2-tailed) N 0.541 0.210 7 1 7 0.616 0.141 7 0.477 0.279 7 0.595 0.159 7 –0.845* 0.034 6 National income Pearson Correlation Sig. (2-tailed) N 0.989** 0.000 7 0.616 0.141 7 1 7 0.206 0.657 7 –0130 0.781 7 –0.645 0.167 6 Turkish Investment Pearson Correlation Sig. (2-tailed) N 0.170 0.716 7 0.477 0.279 7 0.206 0.657 7 1 7 0.104 0.825 7 –0.183 0.729 6 Total investment Pearson Correlation Sig. (2-tailed) N –0.203 0.662 7 0.595 0.159 7 –0130 0.781 7 0.104 0.825 7 1 7 –0.668 0.147 6 Turkish minority Pearson Correlation Sig. (2-tailed) N –0.591 0.217 6 –0.845* 0.034 6 –0.645 0.167 6 –0.183 0.729 6 –0.668 0.147 6 1 6 The data used for the analysis of the secondary data was obtained from the related country’s statistics (World Investment Report, United Nations Statistics and the Undersecretariat of Treasure Statistics 2005). Copyright © 2011 SciRes. ME 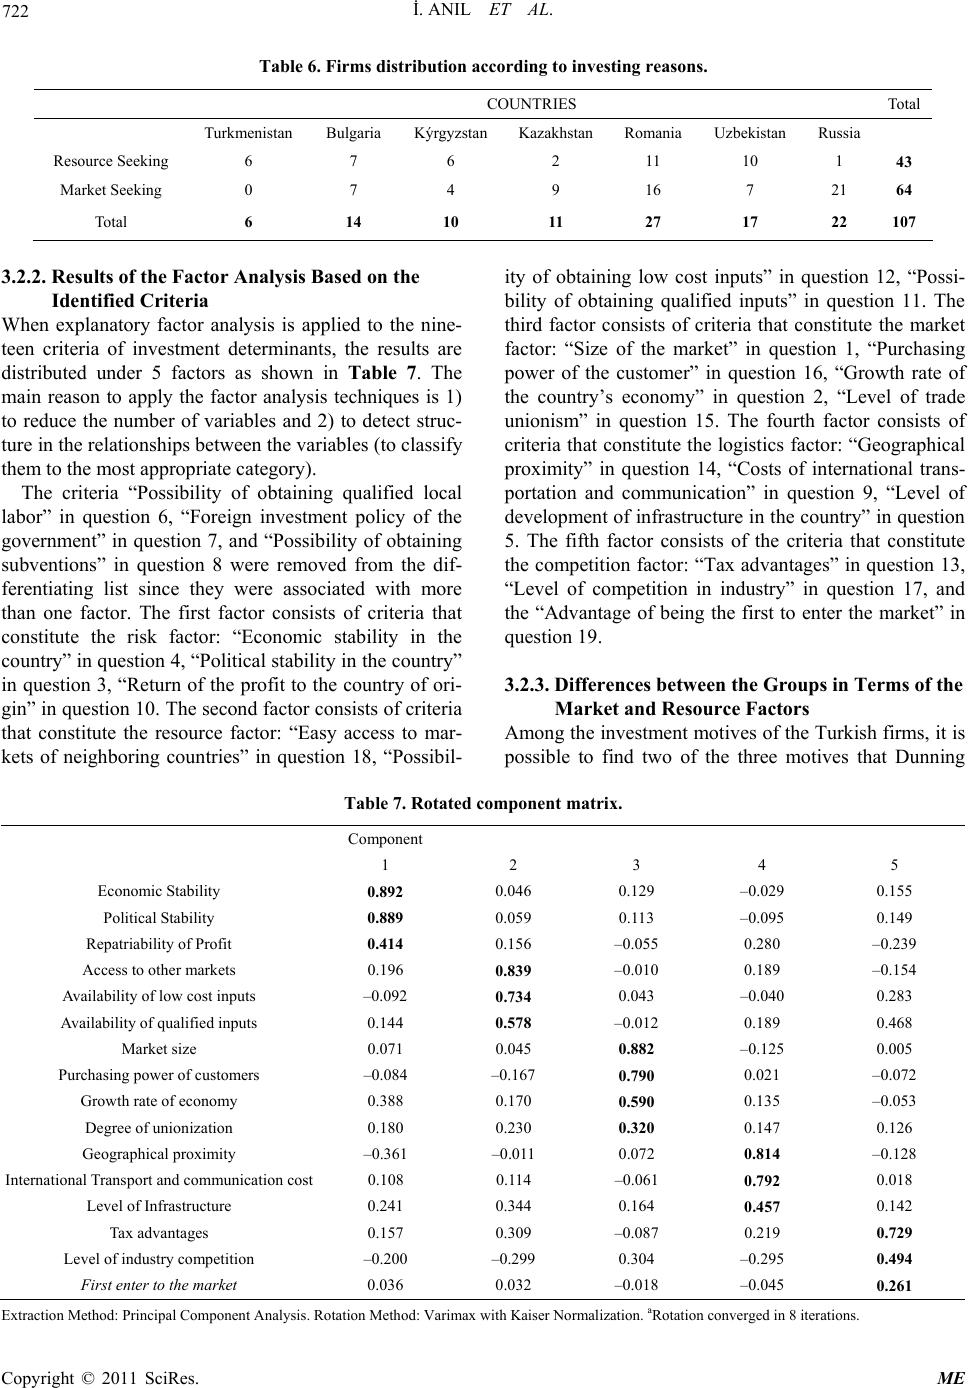 İ. ANIL ET AL. Copyright © 2011 SciRes. ME 722 Table 6. Firms distribution according to investing reasons. COUNTRIES Total Turkmenistan Bulgaria Kýrgyzstan Kazakhstan Romania Uzbekistan Russia Resource Seeking 6 7 6 2 11 10 1 43 Market Seeking 0 7 4 9 16 7 21 64 Total 6 14 10 11 27 17 22 107 3.2.2. Results of the Factor Analysis Based on the Identified Criteria When explanatory factor analysis is applied to the nine- teen criteria of investment determinants, the results are distributed under 5 factors as shown in Table 7. The main reason to apply the factor analysis techniques is 1) to reduce the number of variables and 2) to detect struc- ture in the relationships between the variables (to classify them to the most appropriate category). The criteria “Possibility of obtaining qualified local labor” in question 6, “Foreign investment policy of the government” in question 7, and “Possibility of obtaining subventions” in question 8 were removed from the dif- ferentiating list since they were associated with more than one factor. The first factor consists of criteria that constitute the risk factor: “Economic stability in the country” in question 4, “Political stability in the country” in question 3, “Return of the profit to the country of ori- gin” in question 10. The second factor consists of criteria that constitute the resource factor: “Easy access to mar- kets of neighboring countries” in question 18, “Possibil- ity of obtaining low cost inputs” in question 12, “Possi- bility of obtaining qualified inputs” in question 11. The third factor consists of criteria that constitute the market factor: “Size of the market” in question 1, “Purchasing power of the customer” in question 16, “Growth rate of the country’s economy” in question 2, “Level of trade unionism” in question 15. The fourth factor consists of criteria that constitute the logistics factor: “Geographical proximity” in question 14, “Costs of international trans- portation and communication” in question 9, “Level of development of infrastructure in the country” in question 5. The fifth factor consists of the criteria that constitute the competition factor: “Tax advantages” in question 13, “Level of competition in industry” in question 17, and the “Advantage of being the first to enter the market” in question 19. 3.2.3. Differences between the Groups in Terms of the Market and Resource Factors Among the investment motives of the Turkish firms, it is possible to find two of the three motives that Dunning Table 7. Rotated component matrix. Component 1 2 3 4 5 Economic Stability 0.892 0.046 0.129 –0.029 0.155 Political Stability 0.889 0.059 0.113 –0.095 0.149 Repatriability of Profit 0.414 0.156 –0.055 0.280 –0.239 Access to other markets 0.196 0.839 –0.010 0.189 –0.154 Availability of low cost inputs –0.092 0.734 0.043 –0.040 0.283 Availability of qualified inputs 0.144 0.578 –0.012 0.189 0.468 Market size 0.071 0.045 0.882 –0.125 0.005 Purchasing power of customers –0.084 –0.167 0.790 0.021 –0.072 Growth rate of economy 0.388 0.170 0.590 0.135 –0.053 Degree of unionization 0.180 0.230 0.320 0.147 0.126 Geographical proximity –0.361 –0.011 0.072 0.814 –0.128 International Transport and communication cost 0.108 0.114 –0.061 0.792 0.018 Level of Infrastructure 0.241 0.344 0.164 0.457 0.142 Tax advantages 0.157 0.309 –0.087 0.219 0.729 Level of industry competition –0.200 –0.299 0.304 –0.295 0.494 First enter to the market 0.036 0.032 –0.018 –0.045 0.261 E xtraction Method: Principal Component Analysis. Rotation Method: Varimax with Kaiser Normalization. aRotation converged in 8 iterations. 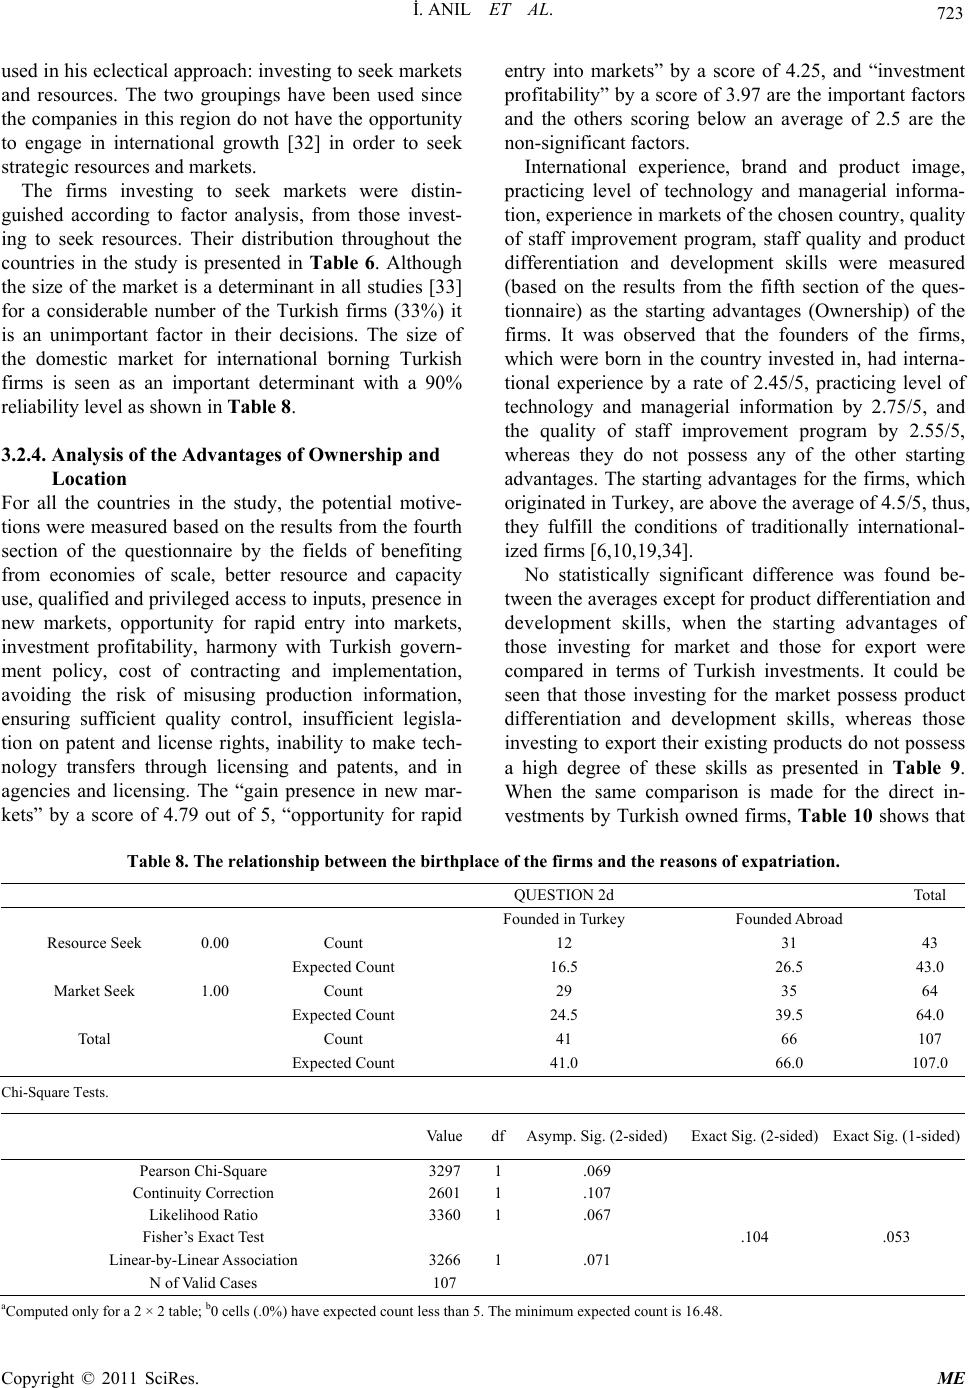 723 İ. ANIL ET AL. used in his eclectical approach: investing to seek markets and resources. The two groupings have been used since the companies in this region do not have the opportunity to engage in international growth [32] in order to seek strategic resources and markets. The firms investing to seek markets were distin- guished according to factor analysis, from those invest- ing to seek resources. Their distribution throughout the countries in the study is presented in Table 6. Although the size of the market is a determinant in all studies [33] for a considerable number of the Turkish firms (33%) it is an unimportant factor in their decisions. The size of the domestic market for international borning Turkish firms is seen as an important determinant with a 90% reliability level as shown in Table 8. 3.2.4. Analysis of the Advantages of Ownership and Location For all the countries in the study, the potential motive- tions were measured based on the results from the fourth section of the questionnaire by the fields of benefiting from economies of scale, better resource and capacity use, qualified and privileged access to inputs, presence in new markets, opportunity for rapid entry into markets, investment profitability, harmony with Turkish govern- ment policy, cost of contracting and implementation, avoiding the risk of misusing production information, ensuring sufficient quality control, insufficient legisla- tion on patent and license rights, inability to make tech- nology transfers through licensing and patents, and in agencies and licensing. The “gain presence in new mar- kets” by a score of 4.79 out of 5, “opportunity for rapid entry into markets” by a score of 4.25, and “investment profitability” by a score of 3.97 are the important factors and the others scoring below an average of 2.5 are the non-significant factors. International experience, brand and product image, practicing level of technology and managerial informa- tion, experience in markets of the chosen country, quality of staff improvement program, staff quality and product differentiation and development skills were measured (based on the results from the fifth section of the ques- tionnaire) as the starting advantages (Ownership) of the firms. It was observed that the founders of the firms, which were born in the country invested in, had interna- tional experience by a rate of 2.45/5, practicing level of technology and managerial information by 2.75/5, and the quality of staff improvement program by 2.55/5, whereas they do not possess any of the other starting advantages. The starting advantages for the firms, which originated in Turkey, are above the average of 4.5/5, thus, they fulfill the conditions of traditionally international- ized firms [6,10,19,34]. No statistically significant difference was found be- tween the averages except for product differentiation and development skills, when the starting advantages of those investing for market and those for export were compared in terms of Turkish investments. It could be seen that those investing for the market possess product differentiation and development skills, whereas those investing to export their existing products do not possess a high degree of these skills as presented in Table 9. When the same comparison is made for the direct in- vestments by Turkish owned firms, Table 10 shows that Table 8. The relationship between the birthplace of the firms and the reasons of expatriation. QUESTION 2d Total Founded in Turkey Founded Abroad Resource Seek 0.00 Count 12 31 43 Expected Count 16.5 26.5 43.0 Market Seek 1.00 Count 29 35 64 Expected Count 24.5 39.5 64.0 Total Count 41 66 107 Expected Count 41.0 66.0 107.0 Chi-Square Tests. Value dfAsymp. Sig. (2-sided)Exact Sig. (2-sided) Exact Sig. (1-sided) Pearson Chi-Square 3297 1.069 Continuity Correction 2601 1.107 Likelihood Ratio 3360 1.067 Fisher’s Exact Test .104 .053 Linear-by-Linear Association 3266 1.071 N of Valid Cases 107 aComputed only for a 2 × 2 table; b0 cells (.0%) have expected count less than 5. The minimum expected count is 16.48. Copyright © 2011 SciRes. ME 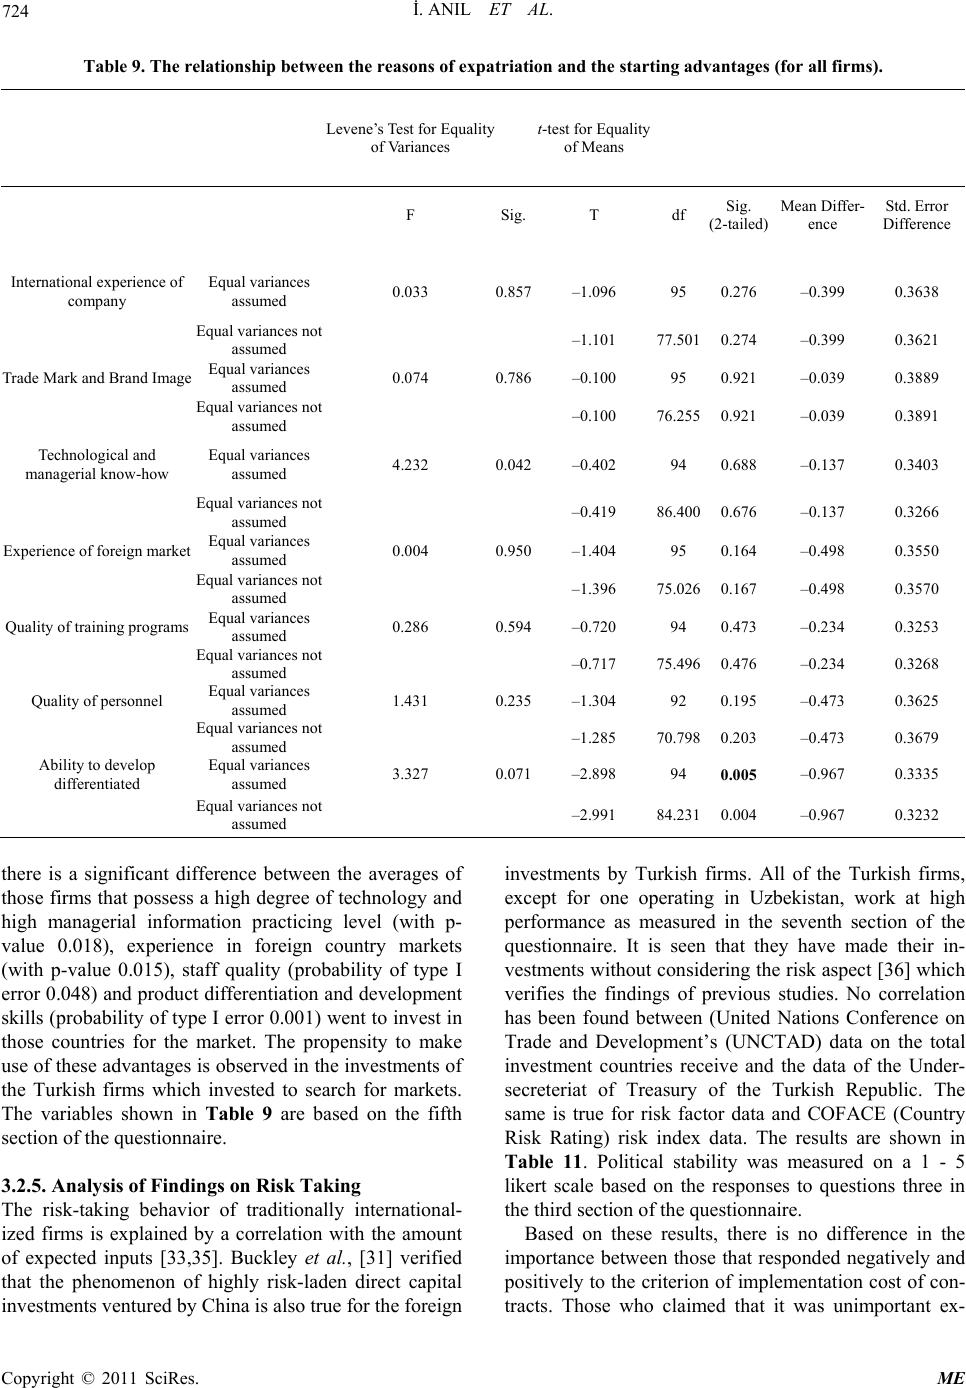 İ. ANIL ET AL. 724 Table 9. The relationship between the reasons of expatriation and the starting advantages (for all firms). Levene’s Test for Equality of Variances t-test for Equality of Means F Sig.T dfSig. (2-tailed) Mean Differ- ence Std. Error Difference International experience of company Equal variances assumed 0.033 0.857–1.096 950.276 –0.399 0.3638 Equal variances not assumed –1.101 77.5010.274 –0.399 0.3621 Trade Mark and Brand Image Equal variances assumed 0.074 0.786–0.100 950.921 –0.039 0.3889 Equal variances not assumed –0.100 76.2550.921 –0.039 0.3891 Technological and managerial know-how Equal variances assumed 4.232 0.042–0.402 940.688 –0.137 0.3403 Equal variances not assumed –0.419 86.4000.676 –0.137 0.3266 Experience of foreign market Equal variances assumed 0.004 0.950–1.404 950.164 –0.498 0.3550 Equal variances not assumed –1.396 75.0260.167 –0.498 0.3570 Quality of training programs Equal variances assumed 0.286 0.594–0.720 940.473 –0.234 0.3253 Equal variances not assumed –0.717 75.4960.476 –0.234 0.3268 Quality of personnel Equal variances assumed 1.431 0.235–1.304 920.195 –0.473 0.3625 Equal variances not assumed –1.285 70.7980.203 –0.473 0.3679 Ability to develop differentiated Equal variances assumed 3.327 0.071–2.898 940.005 –0.967 0.3335 Equal variances not assumed –2.991 84.2310.004 –0.967 0.3232 there is a significant difference between the averages of those firms that possess a high degree of technology and high managerial information practicing level (with p- value 0.018), experience in foreign country markets (with p-value 0.015), staff quality (probability of type I error 0.048) and product differentiation and development skills (probability of type I error 0.001) went to invest in those countries for the market. The propensity to make use of these advantages is observed in the investments of the Turkish firms which invested to search for markets. The variables shown in Table 9 are based on the fifth section of the questionnaire. 3.2.5. Analysis of Findings on Risk Taking The risk-taking behavior of traditionally international- ized firms is explained by a correlation with the amount of expected inputs [33,35]. Buckley et al., [31] verified that the phenomenon of highly risk-laden direct capital investments ventured by China is also true for the foreign investments by Turkish firms. All of the Turkish firms, except for one operating in Uzbekistan, work at high performance as measured in the seventh section of the questionnaire. It is seen that they have made their in- vestments without considering the risk aspect [36] which verifies the findings of previous studies. No correlation has been found between (United Nations Conference on Trade and Development’s (UNCTAD) data on the total investment countries receive and the data of the Under- secreteriat of Treasury of the Turkish Republic. The same is true for risk factor data and COFACE (Country Risk Rating) risk index data. The results are shown in Table 11. Political stability was measured on a 1 - 5 likert scale based on the responses to questions three in the third section of the questionnaire. Based on these results, there is no difference in the importance between those that responded negatively and positively to the criterion of implementation cost of con- racts. Those who claimed that it was unimportant ex- t Copyright © 2011 SciRes. ME 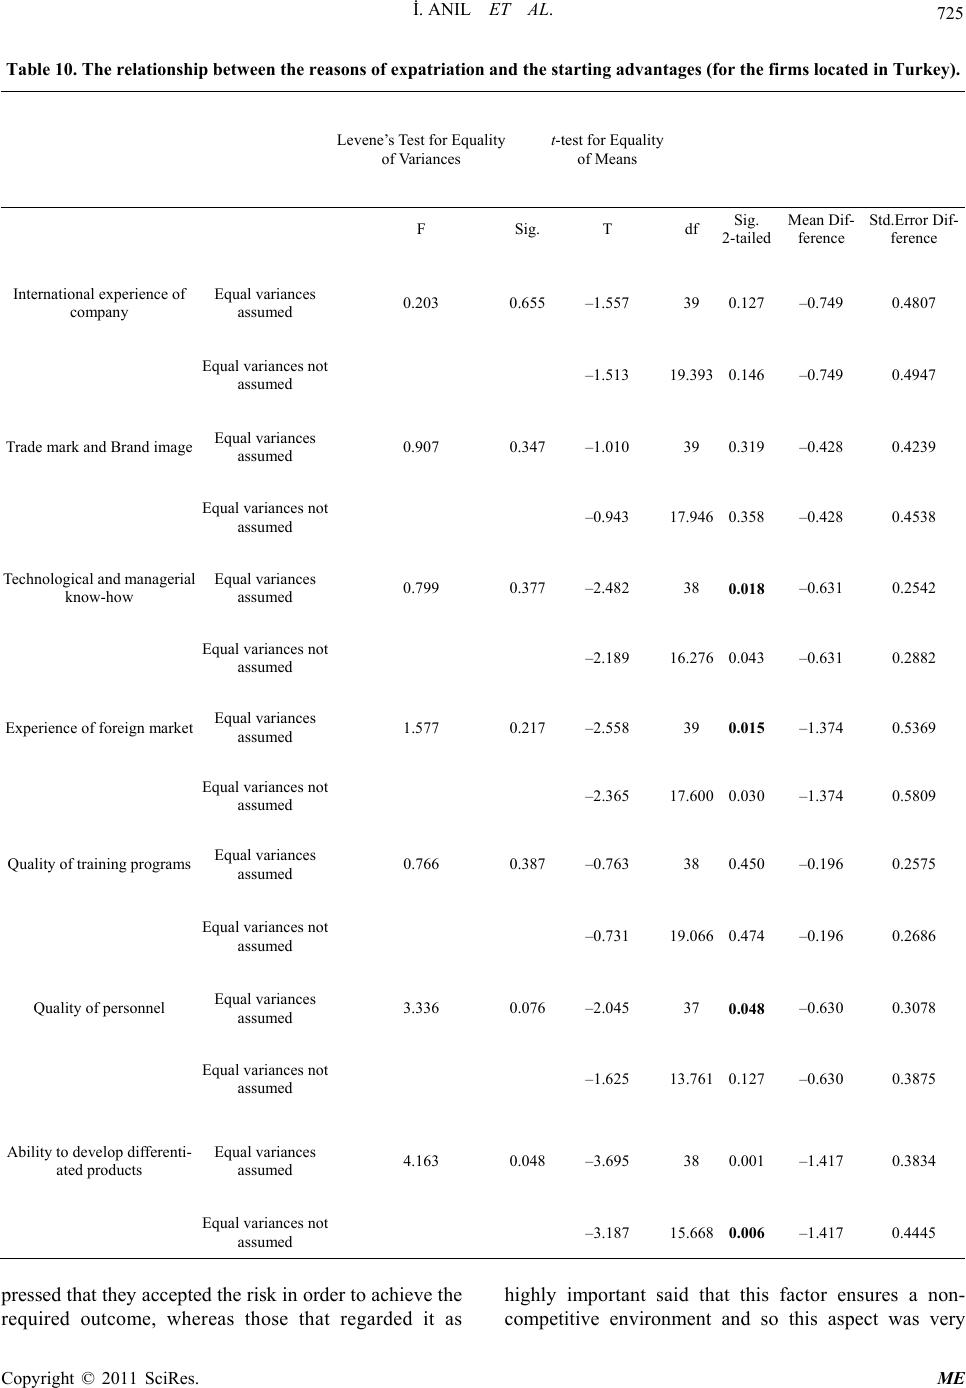 725 İ. ANIL ET AL. Table 10. The relationship between the reasons of expatriation and the starting advantages (for the firms located in Turkey). Levene’s Test for Equality of Variances t-test for Equality of Means F Sig.T dfSig. 2-tailed Mean Dif- ference Std.Error Dif- ference International experience of company Equal variances assumed 0.203 0.655–1.557 390.127 –0.749 0.4807 Equal variances not assumed –1.513 19.3930.146 –0.749 0.4947 Trade mark and Brand image Equal variances assumed 0.907 0.347–1.010 390.319 –0.428 0.4239 Equal variances not assumed –0.943 17.9460.358 –0.428 0.4538 Technological and managerial know-how Equal variances assumed 0.799 0.377–2.482 380.018 –0.631 0.2542 Equal variances not assumed –2.189 16.2760.043 –0.631 0.2882 Experience of foreign market Equal variances assumed 1.577 0.217–2.558 390.015 –1.374 0.5369 Equal variances not assumed –2.365 17.6000.030 –1.374 0.5809 Quality of training programs Equal variances assumed 0.766 0.387–0.763 380.450 –0.196 0.2575 Equal variances not assumed –0.731 19.0660.474 –0.196 0.2686 Quality of personnel Equal variances assumed 3.336 0.076–2.045 370.048 –0.630 0.3078 Equal variances not assumed –1.625 13.7610.127 –0.630 0.3875 Ability to develop differenti- ated products Equal variances assumed 4.163 0.048–3.695 380.001 –1.417 0.3834 Equal variances not assumed –3.187 15.6680.006 –1.417 0.4445 pressed that they accepted the risk in order to achieve the required outcome, whereas those that regarded it as highly important said that this factor ensures a non- ompetitive environment and so this aspect was very c Copyright © 2011 SciRes. ME 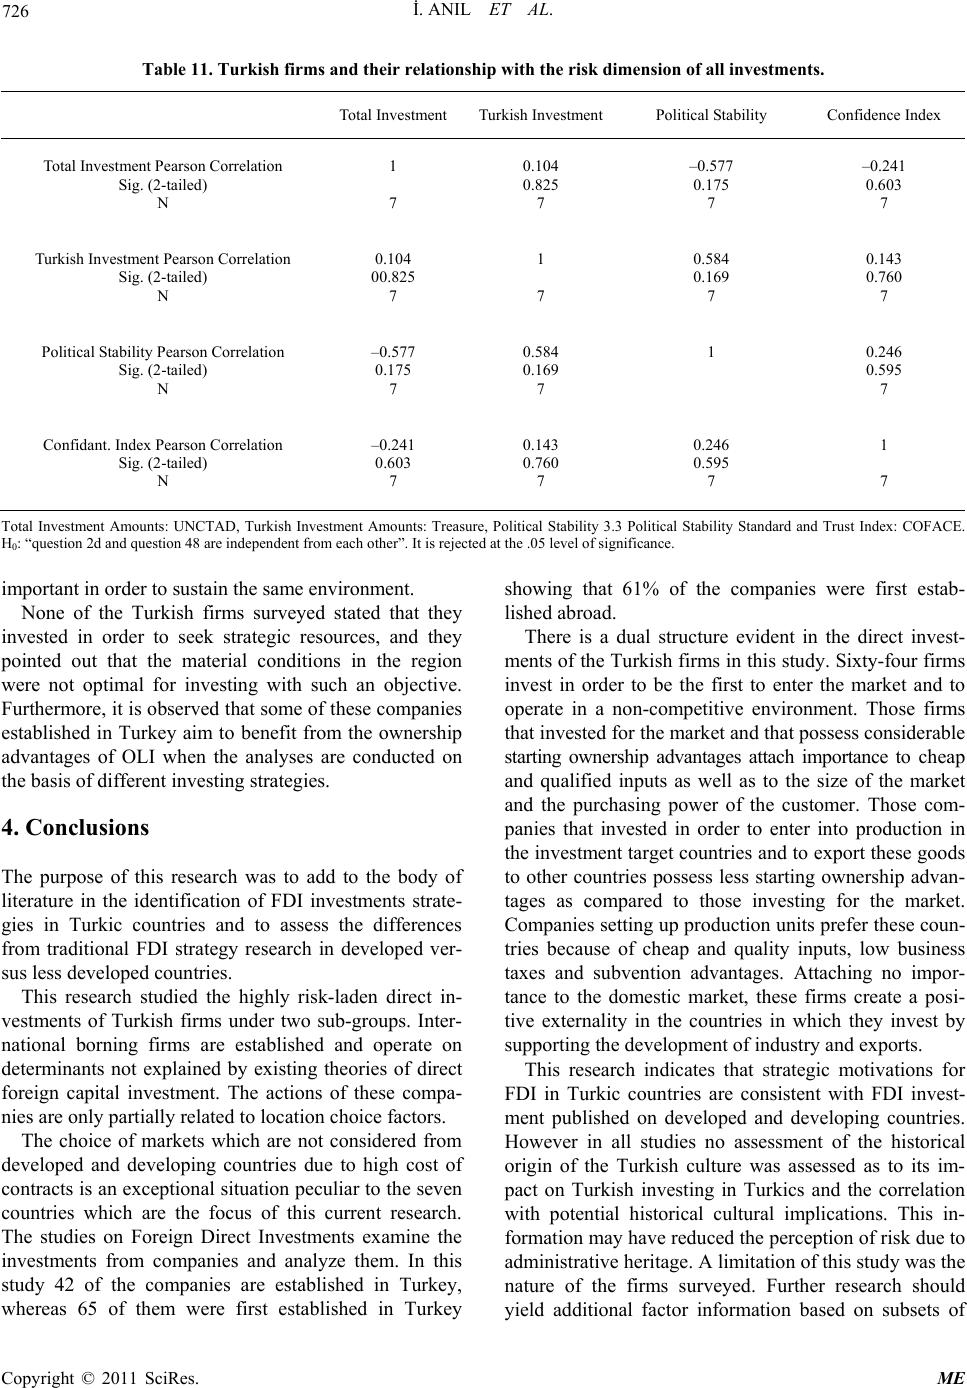 İ. ANIL ET AL. 726 Table 11. Turkish firms and their relationship with the risk dimension of all investments. Total InvestmentTurkish Investment Political Stability Confidence Index Total Investment Pearson Correlation Sig. (2-tailed) N 1 7 0.104 0.825 7 –0.577 0.175 7 –0.241 0.603 7 Turkish Investment Pearson Correlation Sig. (2-tailed) N 0.104 00.825 7 1 7 0.584 0.169 7 0.143 0.760 7 Political Stability Pearson Correlation Sig. (2-tailed) N –0.577 0.175 7 0.584 0.169 7 1 0.246 0.595 7 Confidant. Index Pearson Correlation Sig. (2-tailed) N –0.241 0.603 7 0.143 0.760 7 0.246 0.595 7 1 7 Total Investment Amounts: UNCTAD, Turkish Investment Amounts: Treasure, Political Stability 3.3 Political Stability Standard and Trust Index: COFACE. H0: “question 2d and question 48 are independent from each other”. It is rejected at the .05 level of significance. important in order to sustain the same environment. None of the Turkish firms surveyed stated that they invested in order to seek strategic resources, and they pointed out that the material conditions in the region were not optimal for investing with such an objective. Furthermore, it is observed that some of these companies established in Turkey aim to benefit from the ownership advantages of OLI when the analyses are conducted on the basis of different investing strategies. 4. Conclusions The purpose of this research was to add to the body of literature in the identification of FDI investments strate- gies in Turkic countries and to assess the differences from traditional FDI strategy research in developed ver- sus less developed countries. This research studied the highly risk-laden direct in- vestments of Turkish firms under two sub-groups. Inter- national borning firms are established and operate on determinants not explained by existing theories of direct foreign capital investment. The actions of these compa- nies are only partially related to location choice factors. The choice of markets which are not considered from developed and developing countries due to high cost of contracts is an exceptional situation peculiar to the seven countries which are the focus of this current research. The studies on Foreign Direct Investments examine the investments from companies and analyze them. In this study 42 of the companies are established in Turkey, whereas 65 of them were first established in Turkey showing that 61% of the companies were first estab- lished abroad. There is a dual structure evident in the direct invest- ments of the Turkish firms in this study. Sixty-four firms invest in order to be the first to enter the market and to operate in a non-competitive environment. Those firms that invested for the market and that possess considerable starting ownership advantages attach importance to cheap and qualified inputs as well as to the size of the market and the purchasing power of the customer. Those com- panies that invested in order to enter into production in the investment target countries and to export these goods to other countries possess less starting ownership advan- tages as compared to those investing for the market. Companies setting up production units prefer these coun- tries because of cheap and quality inputs, low business taxes and subvention advantages. Attaching no impor- tance to the domestic market, these firms create a posi- tive externality in the countries in which they invest by supporting the development of industry and exports. This research indicates that strategic motivations for FDI in Turkic countries are consistent with FDI invest- ment published on developed and developing countries. However in all studies no assessment of the historical origin of the Turkish culture was assessed as to its im- pact on Turkish investing in Turkics and the correlation with potential historical cultural implications. This in- formation may have reduced the perception of risk due to administrative heritage. A limitation of this study was the nature of the firms surveyed. Further research should yield additional factor information based on subsets of Copyright © 2011 SciRes. ME 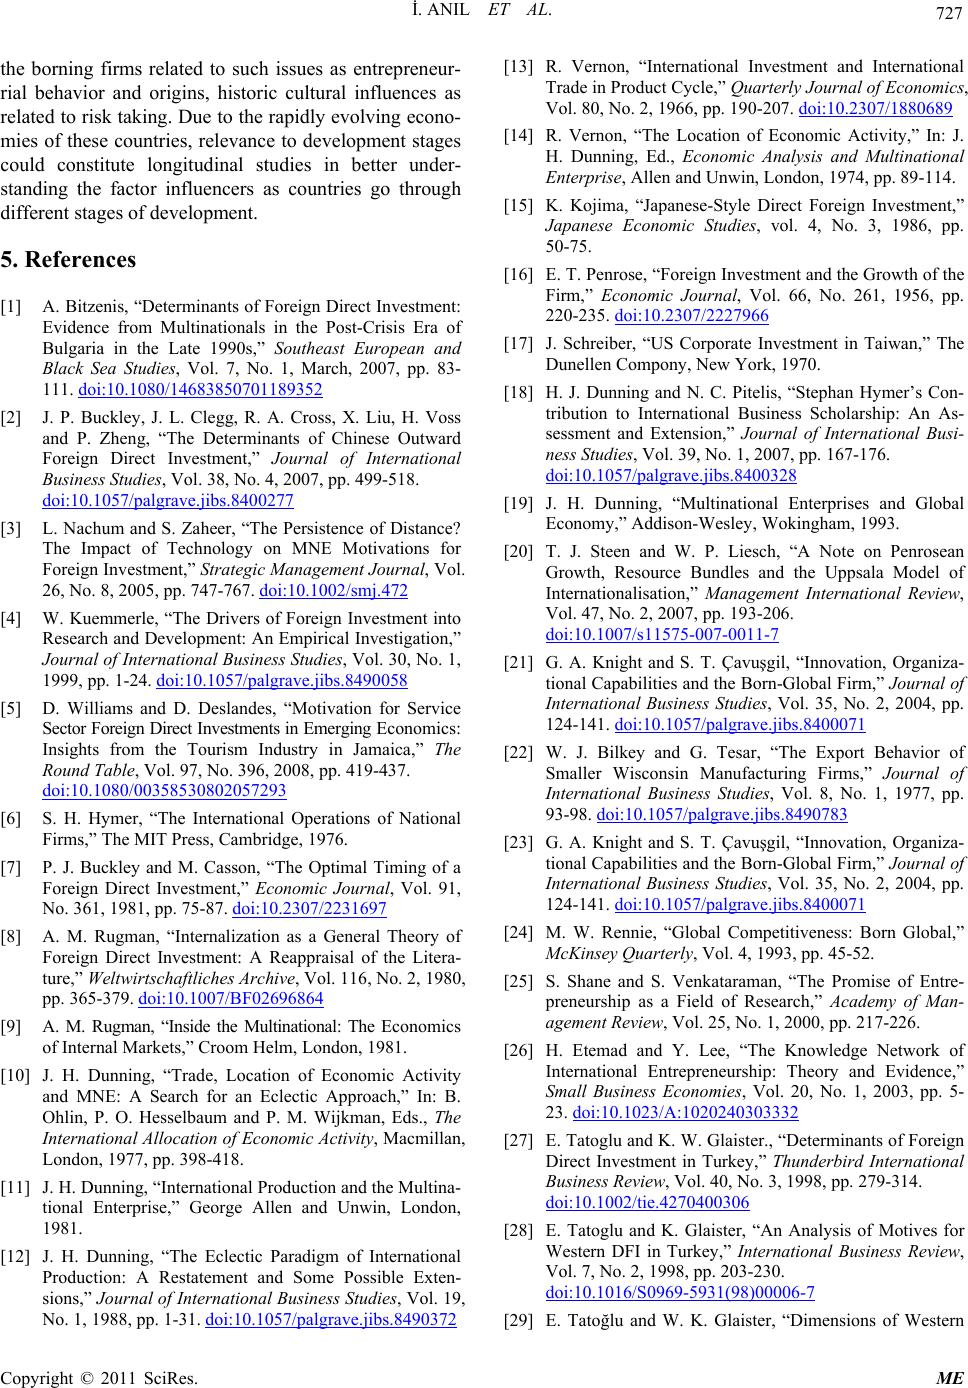 727 İ. ANIL ET AL. the borning firms related to such issues as entrepreneur- rial behavior and origins, historic cultural influences as related to risk taking. Due to the rapidly evolving econo- mies of these countries, relevance to development stages could constitute longitudinal studies in better under- standing the factor influencers as countries go through different stages of development. 5. References [1] A. Bitzenis, “Determinants of Foreign Direct Investment: Evidence from Multinationals in the Post-Crisis Era of Bulgaria in the Late 1990s,” Southeast European and Black Sea Studies, Vol. 7, No. 1, March, 2007, pp. 83- 111. doi:10.1080/14683850701189352 [2] J. P. Buckley, J. L. Clegg, R. A. Cross, X. Liu, H. Voss and P. Zheng, “The Determinants of Chinese Outward Foreign Direct Investment,” Journal of International Business Studies, Vol. 38, No. 4, 2007, pp. 499-518. doi:10.1057/palgrave.jibs.8400277 [3] L. Nachum and S. Zaheer, “The Persistence of Distance? The Impact of Technology on MNE Motivations for Foreign Investment,” Strategic Management Journal, Vol. 26, No. 8, 2005, pp. 747-767. doi:10.1002/smj.472 [4] W. Kuemmerle, “The Drivers of Foreign Investment into Research and Development: An Empirical Investigation,” Journal of International Business Studies, Vol. 30, No. 1, 1999, pp. 1-24. doi:10.1057/palgrave.jibs.8490058 [5] D. Williams and D. Deslandes, “Motivation for Service Sector Foreign Direct Investments in Emerging Economics: Insights from the Tourism Industry in Jamaica,” The Round Table, Vol. 97, No. 396, 2008, pp. 419-437. doi:10.1080/00358530802057293 [6] S. H. Hymer, “The International Operations of National Firms,” The MIT Press, Cambridge, 1976. [7] P. J. Buckley and M. Casson, “The Optimal Timing of a Foreign Direct Investment,” Economic Journal, Vol. 91, No. 361, 1981, pp. 75-87. doi:10.2307/2231697 [8] A. M. Rugman, “Internalization as a General Theory of Foreign Direct Investment: A Reappraisal of the Litera- ture,” Weltwirtschaftliches Archive, Vol. 116, No. 2, 1980, pp. 365-379. doi:10.1007/BF02696864 [9] A. M. Rugman, “Inside the Multinational: The Economics of Internal Markets,” Croom Helm, London, 1981. [10] J. H. Dunning, “Trade, Location of Economic Activity and MNE: A Search for an Eclectic Approach,” In: B. Ohlin, P. O. Hesselbaum and P. M. Wijkman, Eds., The International Allocation of Economic Activity, Macmillan, London, 1977, pp. 398-418. [11] J. H. Dunning, “International Production and the Multina- tional Enterprise,” George Allen and Unwin, London, 1981. [12] J. H. Dunning, “The Eclectic Paradigm of International Production: A Restatement and Some Possible Exten- sions,” Journal of International Business Studies, Vol. 19, No. 1, 1988, pp. 1-31. doi:10.1057/palgrave.jibs.8490372 [13] R. Vernon, “International Investment and International Trade in Product Cycle,” Quarterly Journal of Economics, Vol. 80, No. 2, 1966, pp. 190-207. doi:10.2307/1880689 [14] R. Vernon, “The Location of Economic Activity,” In: J. H. Dunning, Ed., Economic Analysis and Multinational Enterprise, Allen and Unwin, London, 1974, pp. 89-114. [15] K. Kojima, “Japanese-Style Direct Foreign Investment,” Japanese Economic Studies, vol. 4, No. 3, 1986, pp. 50-75. [16] E. T. Penrose, “Foreign Investment and the Growth of the Firm,” Economic Journal, Vol. 66, No. 261, 1956, pp. 220-235. doi:10.2307/2227966 [17] J. Schreiber, “US Corporate Investment in Taiwan,” The Dunellen Compony, New York, 1970. [18] H. J. Dunning and N. C. Pitelis, “Stephan Hymer’s Con- tribution to International Business Scholarship: An As- sessment and Extension,” Journal of International Busi- ness Studies, Vol. 39, No. 1, 2007, pp. 167-176. doi:10.1057/palgrave.jibs.8400328 [19] J. H. Dunning, “Multinational Enterprises and Global Economy,” Addison-Wesley, Wokingham, 1993. [20] T. J. Steen and W. P. Liesch, “A Note on Penrosean Growth, Resource Bundles and the Uppsala Model of Internationalisation,” Management International Review, Vol. 47, No. 2, 2007, pp. 193-206. doi:10.1007/s11575-007-0011-7 [21] G. A. Knight and S. T. Çavuşgil, “Innovation, Organiza- tional Capabilities and the Born-Global Firm,” Journal of International Business Studies, Vol. 35, No. 2, 2004, pp. 124-141. doi:10.1057/palgrave.jibs.8400071 [22] W. J. Bilkey and G. Tesar, “The Export Behavior of Smaller Wisconsin Manufacturing Firms,” Journal of International Business Studies, Vol. 8, No. 1, 1977, pp. 93-98. doi:10.1057/palgrave.jibs.8490783 [23] G. A. Knight and S. T. Çavuşgil, “Innovation, Organiza- tional Capabilities and the Born-Global Firm,” Journal of International Business Studies, Vol. 35, No. 2, 2004, pp. 124-141. doi:10.1057/palgrave.jibs.8400071 [24] M. W. Rennie, “Global Competitiveness: Born Global,” McKinsey Quarterly, Vol. 4, 1993, pp. 45-52. [25] S. Shane and S. Venkataraman, “The Promise of Entre- preneurship as a Field of Research,” Academy of Man- agement Review, Vol. 25, No. 1, 2000, pp. 217-226. [26] H. Etemad and Y. Lee, “The Knowledge Network of International Entrepreneurship: Theory and Evidence,” Small Business Economies, Vol. 20, No. 1, 2003, pp. 5- 23. doi:10.1023/A:1020240303332 [27] E. Tatoglu and K. W. Glaister., “Determinants of Foreign Direct Investment in Turkey,” Thunderbird International Business Review, Vol. 40, No. 3, 1998, pp. 279-314. doi:10.1002/tie.4270400306 [28] E. Tatoglu and K. Glaister, “An Analysis of Motives for Western DFI in Turkey,” International Business Review, Vol. 7, No. 2, 1998, pp. 203-230. doi:10.1016/S0969-5931(98)00006-7 [29] E. Tatoğlu and W. K. Glaister, “Dimensions of Western Copyright © 2011 SciRes. ME  İ. ANIL ET AL. Copyright © 2011 SciRes. ME 728 Foreign Direct Investment in Turkey,” Quorum Books, Westport, Connecticut-London, 2000. [30] A. Bitzenis, “Determinants of Foreign Direct Investment: Evidence from Multinationals in the Post-Crisis Era of Bulgaria in the Late 1990s”, Southeast European and Black Sea Studies, Vol. 7, No. 1, 2007, pp. 83-111. doi:10.1080/14683850701189352 [31] J. P. Buckley, J. L. Clegg, R. A. Cross, X. Liu, H. Voss and P. Zheng, “The Determinants of Chinese Outward Foreign Direct Investment,” Journal of International Business Studies, Vol. 38, No. 4, 2007, pp. 499-518. doi:10.1057/palgrave.jibs.8400277 [32] S. Makino, C. M. Lau and R. S. Yeh, “Asset-Expolitation versus Asset-Seeking: İmplications for Location Choice of Foreign Direct Investment from Newly Industrialized Economies,” Journal of International Business Studies, Vol. 33, No. 3, 2002, pp. 403-421. doi:10.1057/palgrave.jibs.8491024 [33] A. Chakrabarti, “The Determinants of Foreign Direct Investment: Sensitivity Analyses of Cross-Country Re- gressions,” Keyklos, Vol. 54, No. 1, 2001, pp. 89-114. doi:10.1111/1467-6435.00142 [34] H. J. Dunning, “The Eclectic Paradigm as an Envelope for Economic and Business Theories of MNE Activity,” International Business Review, Vol. 9, No. 2, 2000, pp. 163-190. doi:10.1016/S0969-5931(99)00035-9 [35] P. J. Buckley and M. Casson, “The Optimal Timing of a Foreign Direct Investment,” Economic Journal, Vol. 91, No. 361, 1981, pp. 75-87. doi:10.2307/2231697 [36] M. Demirbağ, R. Güneş and H. Mirza, “Political Risk Management: A Case Study of Turkish Companies in Central Asia and Russia,” In: H. Mirza, Ed., Global Competitive Strategies in the New World Economy, Edward Ergar, London, 1998, pp. 283-309. |