

Paper Menu >>
Journal Menu >>
 Vol.3, No.11, 963-970 (2011) Natural Science http://dx.doi.org/10.4236/ns.2011.311123 Copyright © 2011 SciRes. OPEN ACCESS Gamma-ray compton spectrum analysis to enhance medical imaging using wavelet transformation Ali Pazirandeh*, Saman Ebrahimi Nuclear Engineering Department, Science and Research Branch, Islamic Azad University, Tehran, Iran; *Corresponding Author: [email protected], [email protected] Received 20 July 2011; revised 25 August 2011; accepted 7 September 2011. ABSTRACT Cs-137 radioactive source with 661.7 keV gamma- ray energy and Am-241 with 59.5 keV gamma-ray energy were used to study the body structure of materials by examining transmitted gamma-ray spectrum using a scintillation detector, NaI(Tl). Due to specific characteristic properties of the medium, the passing Compton broad scattering spectrum contains valuable information. It is possible to mark and to specify the Compton spectrum caused by atomic specifications of Al, Cu, bone, muscle, and lipid as interactive mate- rials. Wavelet transforms and other multi-scale analysis functions have been used for compact signal and image representations in de-noising, compression and feature detection processing problems for about twenty years. Comparing the transmitted spectra through muscle, bone and a tumor-like (fat) and analyzing each spectrum by wavelet analysis, the differences of the medium were shown. This study is devoted to use of wavelet transform for feature extraction associ- ated with gamma spectrum, which corresponds to image pixel, and their classification in com- parison with the Haar and Rbio3.1 transforms. Keywords: Wavelet; Haar; Rbio3.1; Compton Scattering; MATLAB; Al; Cu; Muscle; Bone; Lipid; Am-241; Cs-137 1. INTRODUCTION The aim of this study is to present an effective and re- liable technique to analyze the spectrum of the photo- peak region and the broad Compton scattering spectrum of Cs-137 and Am-241 passing gamma-rays, which were recorded by a 3"*3" NaI(Tl) scintillator crystal housed in an aluminum cylinder coupled with a photomultiplier tube (PMT). In order to extract more valuable data from transmitted gamma-ray, we propose a new wavelet- based approach for analysis and classification of spec- trum samples with small peaks of broad Compton scat- tering. The main idea of this method is to analyze the given spectrum with a continuous 1D wavelet transform (CWT) and to form an image approximation with higher contrast. This is regarded as a nondestructive testing (NDT) technique. With the help of multiple scatterings caused by different material atoms, voids, cracks and other de- formations in the energy spectrum are formed, which are capable of being analyzed to indicate discontinuities and defects [1]. The frequencies of each peak could be used to determine the size of the structure or the location of the boundaries [2]. The amount of spectrum variation, relative to when there is no barrier, is proportional to the atomic structure and electron density of materials such as bone and mus- cle. Wavelet analysis was applied to explain the atomic specifications of muscle, bone and metal sheets. In gen- eral, any structural disorder may be reflected in the scat- tered or transmitted gamma-ray spectra, which could be determined effectively by wavelet transformation. The Cs-137 661.7 keV gamma-ray spectrum passed through aluminum and copper sheets, having the same surface densities, and also Am-241 59.5 keV spectrum passed through animal bone and muscle showed differ- ent structure in their shapes. In such cases, wavelets are powerful tools for characterizing and extracting features because the differences among the spectra are displayed in a specific place and frequency variations. However these differences are seen by eyes in most cases but our purpose is to recognize these differences by the com- puter for comparison and further deduction. The analysis must be independent of amplitude, which means there is an independency between analysis and exposure dura- tion and counting. In fact this is a benefit of using wave- let analysis. 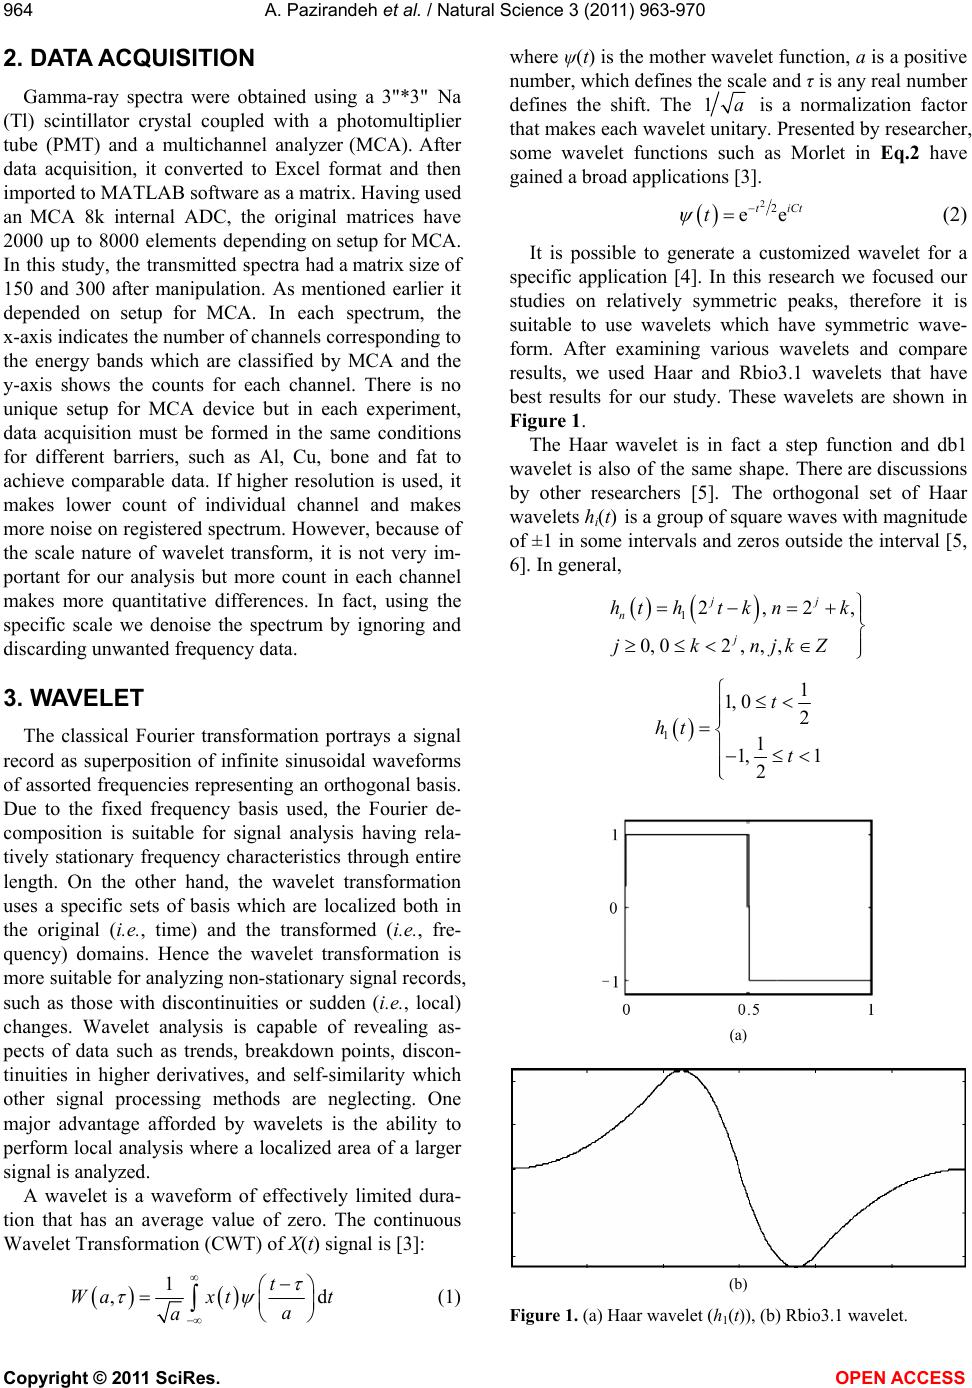 A. Pazirandeh et al. / Natural Science 3 (2011) 963-970 Copyright © 2011 SciRes. OPEN ACCESS 964 2. DATA ACQUISITION Gamma-ray spectra were obtained using a 3"*3" Na (Tl) scintillator crystal coupled with a photomultiplier tube (PMT) and a multichannel analyzer (MCA). After data acquisition, it converted to Excel format and then imported to MATLAB software as a matrix. Having used an MCA 8k internal ADC, the original matrices have 2000 up to 8000 elements depending on setup for MCA. In this study, the transmitted spectra had a matrix size of 150 and 300 after manipulation. As mentioned earlier it depended on setup for MCA. In each spectrum, the x-axis indicates the number of channels corresponding to the energy bands which are classified by MCA and the y-axis shows the counts for each channel. There is no unique setup for MCA device but in each experiment, data acquisition must be formed in the same conditions for different barriers, such as Al, Cu, bone and fat to achieve comparable data. If higher resolution is used, it makes lower count of individual channel and makes more noise on registered spectrum. However, because of the scale nature of wavelet transform, it is not very im- portant for our analysis but more count in each channel makes more quantitative differences. In fact, using the specific scale we denoise the spectrum by ignoring and discarding unwanted frequency data. 3. WAVELET The classical Fourier transformation portrays a signal record as superposition of infinite sinusoidal waveforms of assorted frequencies representing an orthogonal basis. Due to the fixed frequency basis used, the Fourier de- composition is suitable for signal analysis having rela- tively stationary frequency characteristics through entire length. On the other hand, the wavelet transformation uses a specific sets of basis which are localized both in the original (i. e. , time) and the transformed (i.e., fre- quency) domains. Hence the wavelet transformation is more suitable for analyzing non-stationary signal records, such as those with discontinuities or sudden (i.e., local) changes. Wavelet analysis is capable of revealing as- pects of data such as trends, breakdown points, discon- tinuities in higher derivatives, and self-similarity which other signal processing methods are neglecting. One major advantage afforded by wavelets is the ability to perform local analysis where a localized area of a larger signal is analyzed. A wavelet is a waveform of effectively limited dura- tion that has an average value of zero. The continuous Wavelet Transformation (CWT) of X(t) signal is [3]: 1 ,d t Wa xtt a a (1) where ψ(t) is the mother wavelet function, a is a positive number, which defines the scale and τ is any real number defines the shift. The 1a is a normalization factor that makes each wavelet unitary. Presented by researcher, some wavelet functions such as Morlet in Eq.2 have gained a broad applications [3]. 22 ee tiCt t (2) It is possible to generate a customized wavelet for a specific application [4]. In this research we focused our studies on relatively symmetric peaks, therefore it is suitable to use wavelets which have symmetric wave- form. After examining various wavelets and compare results, we used Haar and Rbio3.1 wavelets that have best results for our study. These wavelets are shown in Figure 1. The Haar wavelet is in fact a step function and db1 wavelet is also of the same shape. There are discussions by other researchers [5]. The orthogonal set of Haar wavelets hi(t) is a group of square waves with magnitude of ±1 in some intervals and zeros outside the interval [5, 6]. In general, 12,2, 0, 02,,, jj n j hthtk nk jknjkZ 1 1 1, 02 1 1, 1 2 t ht t (a) (b) Figure 1. (a) Haar wavelet (h1(t)), (b) Rbio3.1 wavelet. 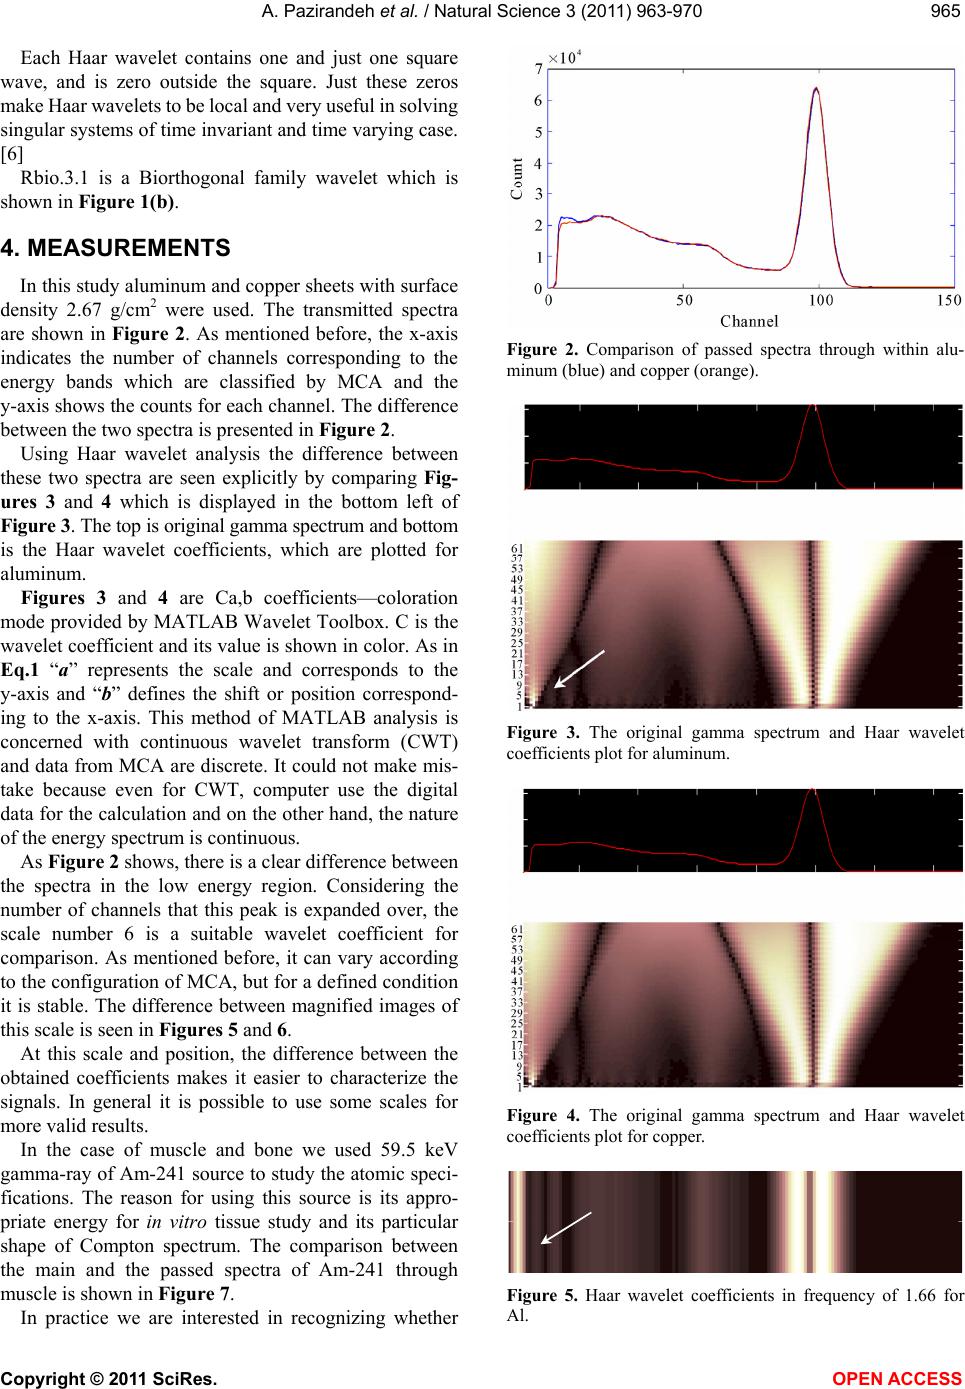 A. Pazirandeh et al. / Natural Science 3 (2011) 963-970 Copyright © 2011 SciRes. OPEN ACCESS 965965 Each Haar wavelet contains one and just one square wave, and is zero outside the square. Just these zeros make Haar wavelets to be local and very useful in solving singular systems of time invariant and time varying case. [6] Rbio.3.1 is a Biorthogonal family wavelet which is shown in Figure 1(b). 4. MEASUREMENTS In this study aluminum and copper sheets with surface density 2.67 g/cm2 were used. The transmitted spectra are shown in Figure 2. As mentioned before, the x-axis indicates the number of channels corresponding to the energy bands which are classified by MCA and the y-axis shows the counts for each channel. The difference between the two spectra is presented in Figure 2. Using Haar wavelet analysis the difference between these two spectra are seen explicitly by comparing Fig- ures 3 and 4 which is displayed in the bottom left of Figure 3. The top is original gamma spectrum and bottom is the Haar wavelet coefficients, which are plotted for aluminum. Figures 3 and 4 are Ca,b coefficients—coloration mode provided by MATLAB Wavelet Toolbox. C is the wavelet coefficient and its value is shown in color. As in Eq.1 “a” represents the scale and corresponds to the y-axis and “b” defines the shift or position correspond- ing to the x-axis. This method of MATLAB analysis is concerned with continuous wavelet transform (CWT) and data from MCA are discrete. It could not make mis- take because even for CWT, computer use the digital data for the calculation and on the other hand, the nature of the energy spectrum is continuous. As Figure 2 shows, there is a clear difference between the spectra in the low energy region. Considering the number of channels that this peak is expanded over, the scale number 6 is a suitable wavelet coefficient for comparison. As mentioned before, it can vary according to the configuration of MCA, but for a defined condition it is stable. The difference between magnified images of this scale is seen in Figures 5 and 6. At this scale and position, the difference between the obtained coefficients makes it easier to characterize the signals. In general it is possible to use some scales for more valid results. In the case of muscle and bone we used 59.5 keV gamma-ray of Am-241 source to study the atomic speci- fications. The reason for using this source is its appro- priate energy for in vitro tissue study and its particular shape of Compton spectrum. The comparison between the main and the passed spectra of Am-241 through muscle is shown in Figure 7. In practice we are interested in recognizing whether Figure 2. Comparison of passed spectra through within alu- minum (blue) and copper (orange). Figure 3. The original gamma spectrum and Haar wavelet coefficients plot for aluminum. Figure 4. The original gamma spectrum and Haar wavelet coefficients plot for copper. Figure 5. Haar wavelet coefficients in frequency of 1.66 for Al. 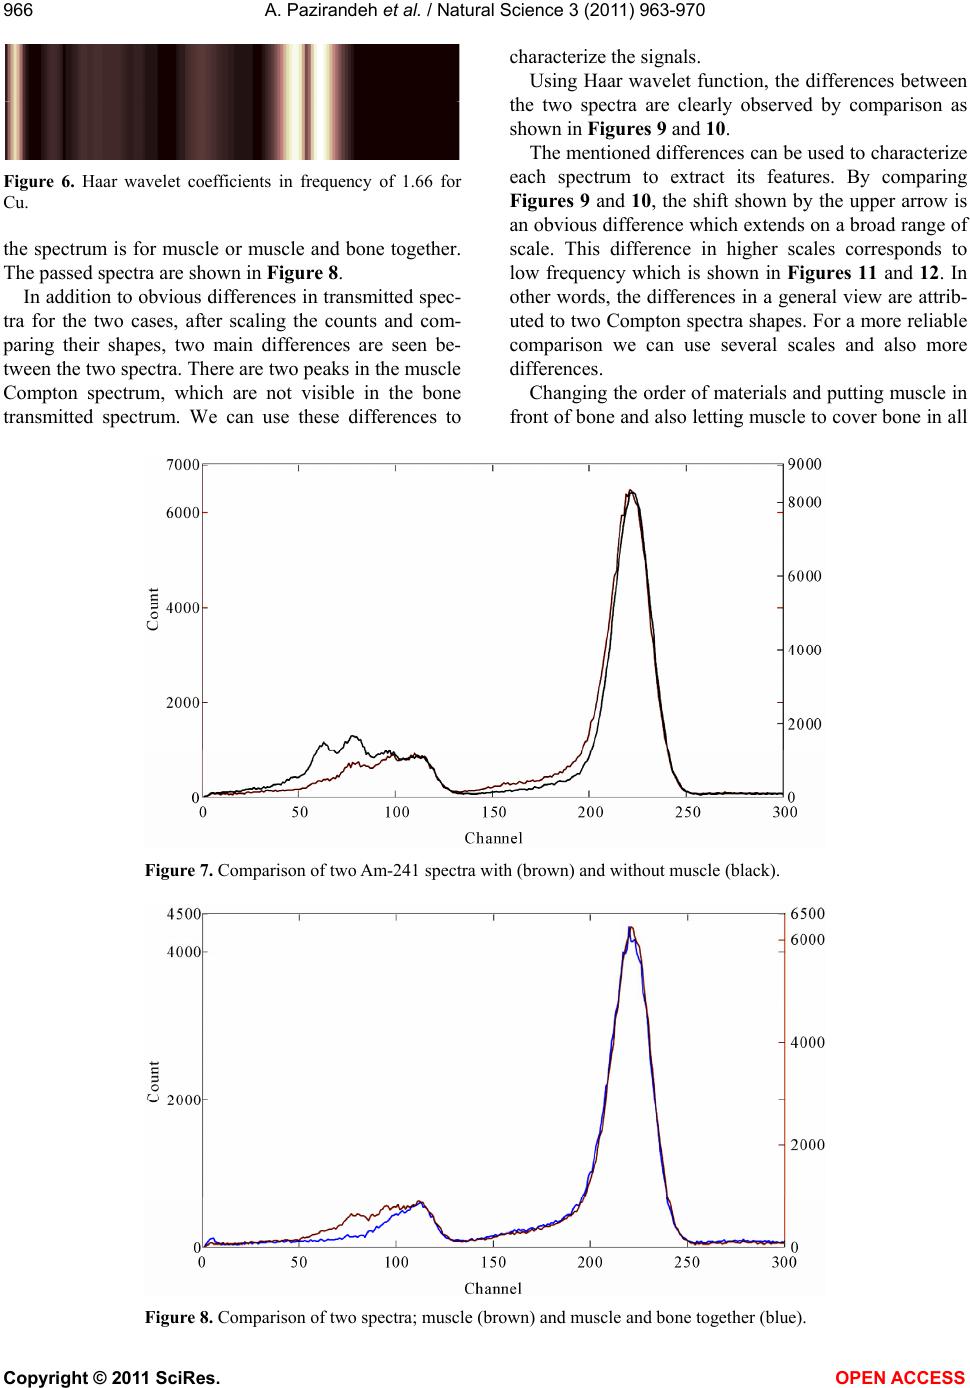 A. Pazirandeh et al. / Natural Science 3 (2011) 963-970 Copyright © 2011 SciRes. OPEN ACCESS 966 Figure 6. Haar wavelet coefficients in frequency of 1.66 for Cu. the spectrum is for muscle or muscle and bone together. The passed spectra are shown in Figure 8. In addition to obvious differences in transmitted spec- tra for the two cases, after scaling the counts and com- paring their shapes, two main differences are seen be- tween the two spectra. There are two peaks in the muscle Compton spectrum, which are not visible in the bone transmitted spectrum. We can use these differences to characterize the signals. Using Haar wavelet function, the differences between the two spectra are clearly observed by comparison as shown in Figures 9 and 10. The mentioned differences can be used to characterize each spectrum to extract its features. By comparing Figures 9 and 10, the shift shown by the upper arrow is an obvious difference which extends on a broad range of scale. This difference in higher scales corresponds to low frequency which is shown in Figures 11 and 12. In other words, the differences in a general view are attrib- uted to two Compton spectra shapes. For a more reliable comparison we can use several scales and also more differences. Changing the order of materials and putting muscle in front of bone and also letting muscle to cover bone in all Figure 7. Comparison of two Am-241 spectra with (brown) and without muscle (black). Figure 8. Comparison of two spectra; muscle (brown) and muscle and bone together (blue). 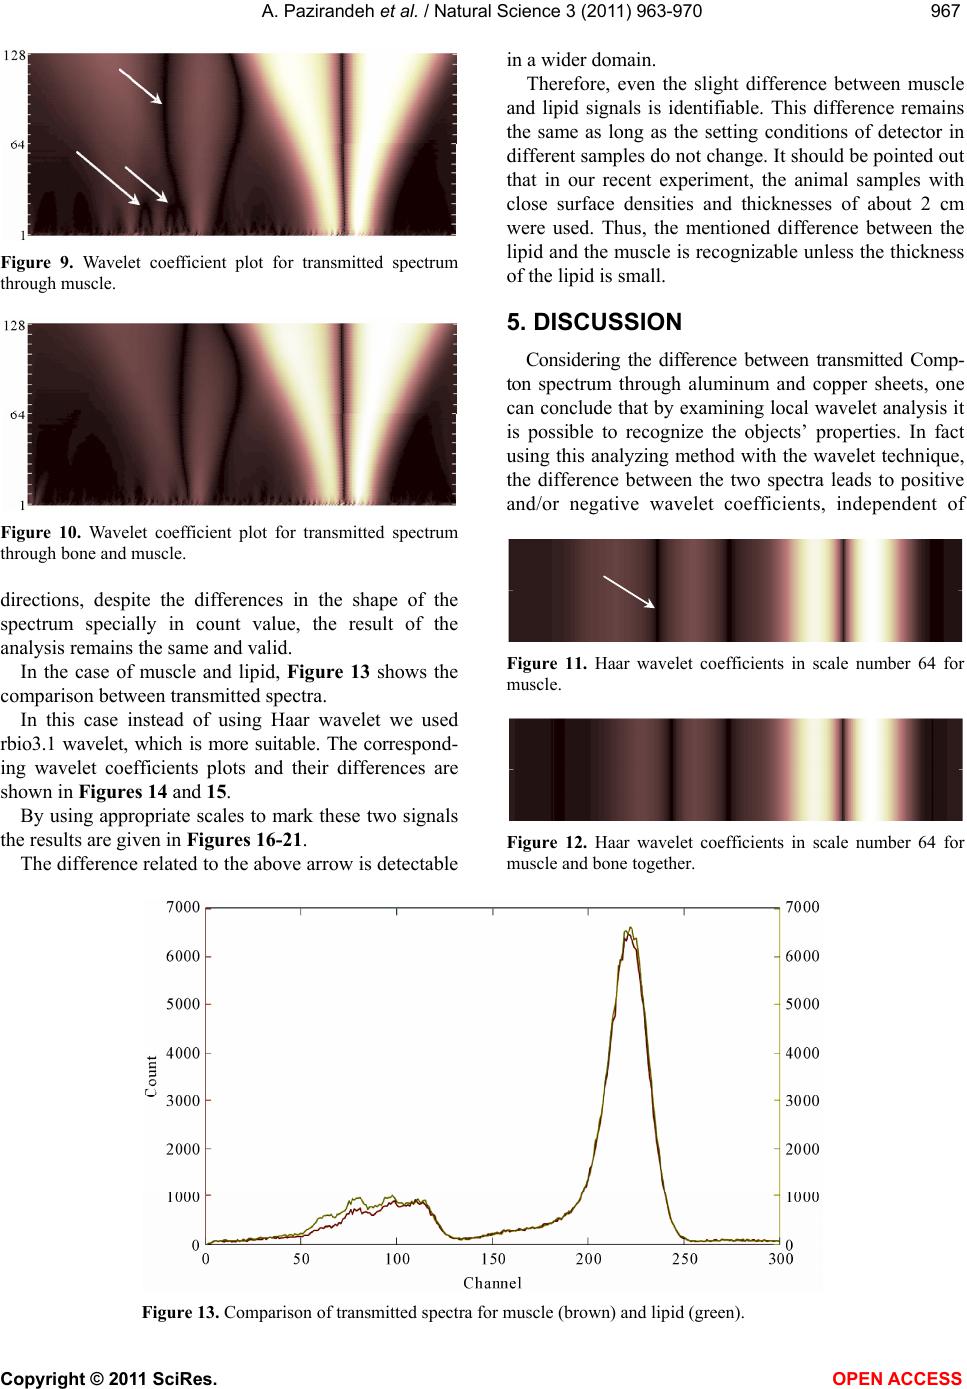 A. Pazirandeh et al. / Natural Science 3 (2011) 963-970 Copyright © 2011 SciRes. OPEN ACCESS 967967 Figure 9. Wavelet coefficient plot for transmitted spectrum through muscle. Figure 10. Wavelet coefficient plot for transmitted spectrum through bone and muscle. directions, despite the differences in the shape of the spectrum specially in count value, the result of the analysis remains the same and valid. In the case of muscle and lipid, Figure 13 shows the comparison between transmitted spectra. In this case instead of using Haar wavelet we used rbio3.1 wavelet, which is more suitable. The correspond- ing wavelet coefficients plots and their differences are shown in Figures 14 and 15. By using appropriate scales to mark these two signals the results are given in Figures 16-21. The difference related to the above arrow is detectable in a wider domain. Therefore, even the slight difference between muscle and lipid signals is identifiable. This difference remains the same as long as the setting conditions of detector in different samples do not change. It should be pointed out that in our recent experiment, the animal samples with close surface densities and thicknesses of about 2 cm were used. Thus, the mentioned difference between the lipid and the muscle is recognizable unless the thickness of the lipid is small. 5. DISCUSSION Considering the difference between transmitted Comp- ton spectrum through aluminum and copper sheets, one can conclude that by examining local wavelet analysis it is possible to recognize the objects’ properties. In fact using this analyzing method with the wavelet technique, the difference between the two spectra leads to positive and/or negative wavelet coefficients, independent of Figure 11. Haar wavelet coefficients in scale number 64 for muscle. Figure 12. Haar wavelet coefficients in scale number 64 for muscle and bone together. Figure 13. Comparison of transmitted spectra for muscle (brown) and lipid (green). 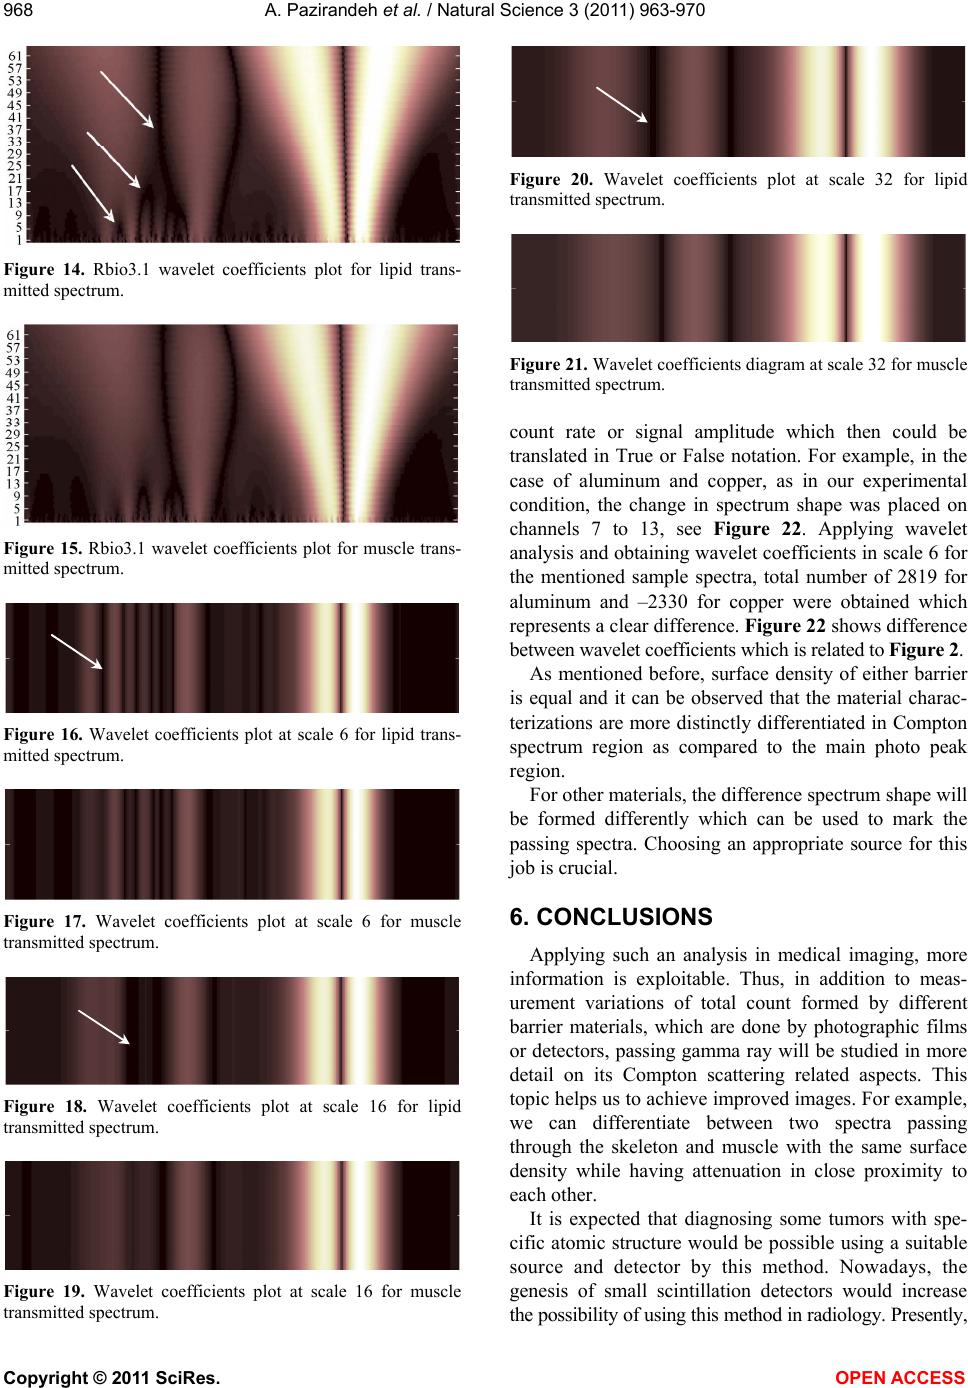 A. Pazirandeh et al. / Natural Science 3 (2011) 963-970 Copyright © 2011 SciRes. OPEN ACCESS 968 Figure 14. Rbio3.1 wavelet coefficients plot for lipid trans- mitted spectrum. Figure 15. Rbio3.1 wavelet coefficients plot for muscle trans- mitted spectrum. Figure 16. Wavelet coefficients plot at scale 6 for lipid trans- mitted spectrum. Figure 17. Wavelet coefficients plot at scale 6 for muscle transmitted spectrum. Figure 18. Wavelet coefficients plot at scale 16 for lipid transmitted spectrum. Figure 19. Wavelet coefficients plot at scale 16 for muscle transmitted spectrum. Figure 20. Wavelet coefficients plot at scale 32 for lipid transmitted spectrum. Figure 21. Wavelet coefficients diagram at scale 32 for muscle transmitted spectrum. count rate or signal amplitude which then could be translated in True or False notation. For example, in the case of aluminum and copper, as in our experimental condition, the change in spectrum shape was placed on channels 7 to 13, see Figure 22. Applying wavelet analysis and obtaining wavelet coefficients in scale 6 for the mentioned sample spectra, total number of 2819 for aluminum and –2330 for copper were obtained which represents a clear difference. Figure 22 shows difference between wavelet coefficients which is related to Figure 2. As mentioned before, surface density of either barrier is equal and it can be observed that the material charac- terizations are more distinctly differentiated in Compton spectrum region as compared to the main photo peak region. For other materials, the difference spectrum shape will be formed differently which can be used to mark the passing spectra. Choosing an appropriate source for this job is crucial. 6. CONCLUSIONS Applying such an analysis in medical imaging, more information is exploitable. Thus, in addition to meas- urement variations of total count formed by different barrier materials, which are done by photographic films or detectors, passing gamma ray will be studied in more detail on its Compton scattering related aspects. This topic helps us to achieve improved images. For example, we can differentiate between two spectra passing through the skeleton and muscle with the same surface density while having attenuation in close proximity to each other. It is expected that diagnosing some tumors with spe- cific atomic structure would be possible using a suitable source and detector by this method. Nowadays, the genesis of small scintillation detectors would increase the possibility of using this method in radiology. Presently, 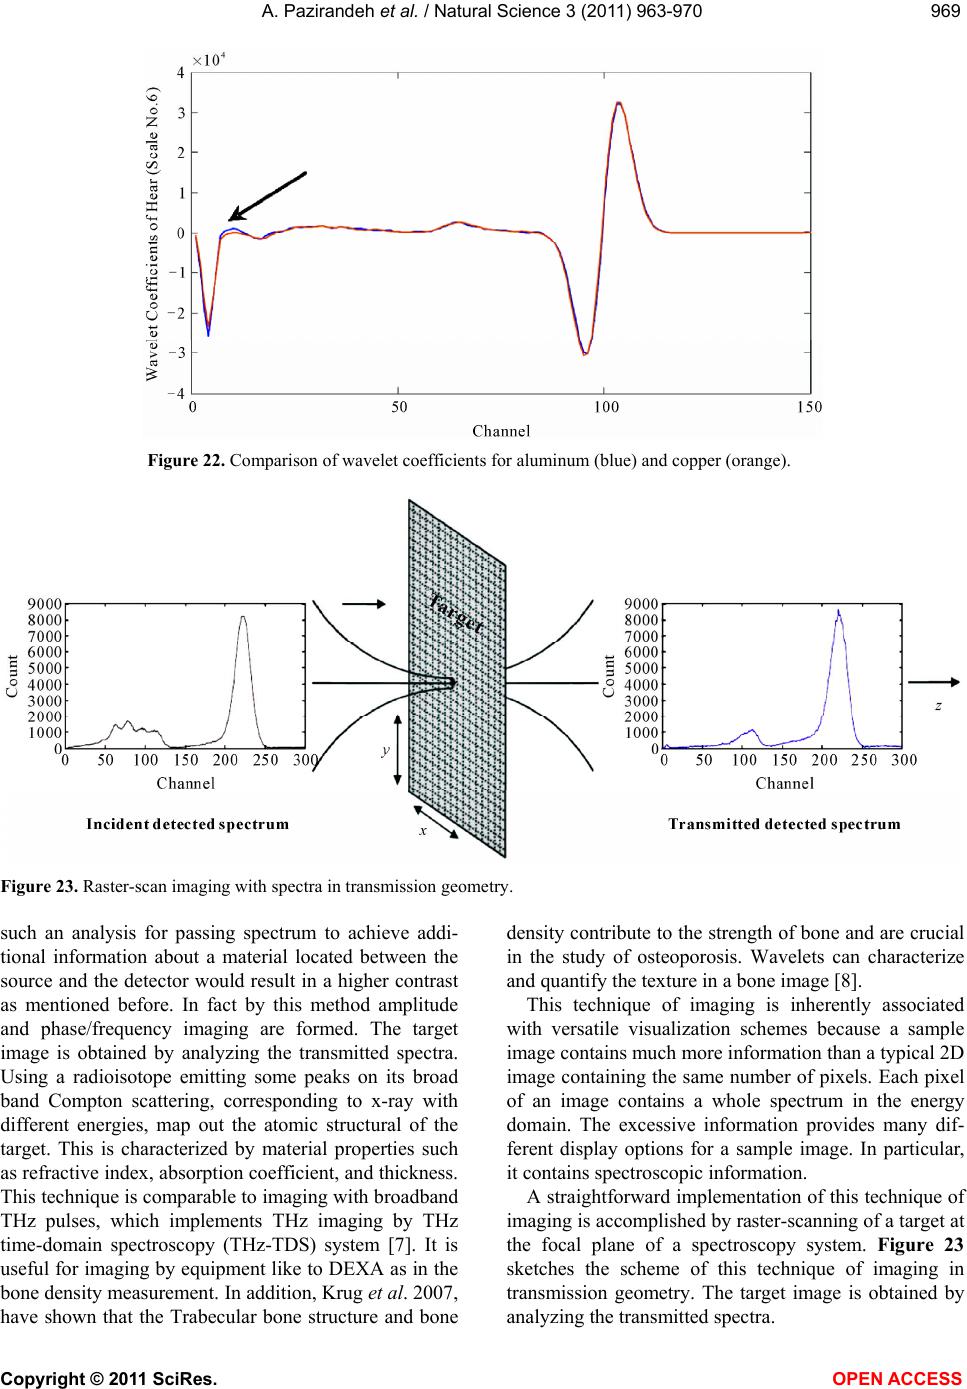 A. Pazirandeh et al. / Natural Science 3 (2011) 963-970 Copyright © 2011 SciRes. OPEN ACCESS 969969 Figure 22. Comparison of wavelet coefficients for aluminum (blue) and copper (orange). Figure 23. Raster-scan imaging with spectra in transmission geometry. such an analysis for passing spectrum to achieve addi- tional information about a material located between the source and the detector would result in a higher contrast as mentioned before. In fact by this method amplitude and phase/frequency imaging are formed. The target image is obtained by analyzing the transmitted spectra. Using a radioisotope emitting some peaks on its broad band Compton scattering, corresponding to x-ray with different energies, map out the atomic structural of the target. This is characterized by material properties such as refractive index, absorption coefficient, and thickness. This technique is comparable to imaging with broadband THz pulses, which implements THz imaging by THz time-domain spectroscopy (THz-TDS) system [7]. It is useful for imaging by equipment like to DEXA as in the bone density measurement. In addition, Krug et al. 2007, have shown that the Trabecular bone structure and bone density contribute to the strength of bone and are crucial in the study of osteoporosis. Wavelets can characterize and quantify the texture in a bone image [8]. This technique of imaging is inherently associated with versatile visualization schemes because a sample image contains much more information than a typical 2D image containing the same number of pixels. Each pixel of an image contains a whole spectrum in the energy domain. The excessive information provides many dif- ferent display options for a sample image. In particular, it contains spectroscopic information. A straightforward implementation of this technique of imaging is accomplished by raster-scanning of a target at the focal plane of a spectroscopy system. Figure 23 sketches the scheme of this technique of imaging in transmission geometry. The target image is obtained by analyzing the transmitted spectra. 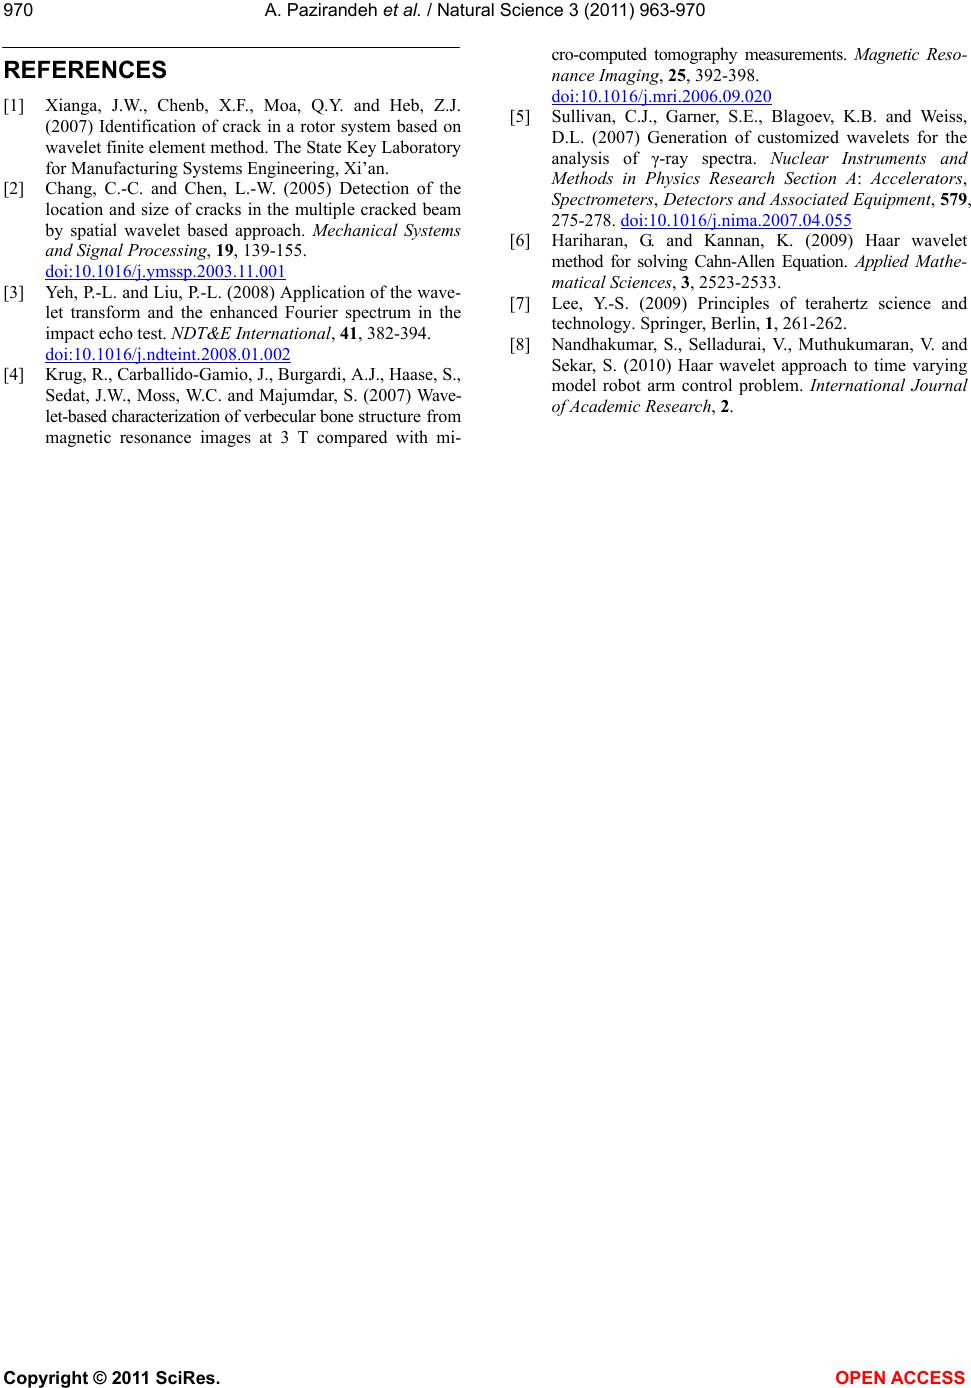 A. Pazirandeh et al. / Natural Science 3 (2011) 963-970 Copyright © 2011 SciRes. OPEN ACCESS 970 REFERENCES [1] Xianga, J.W., Chenb, X.F., Moa, Q.Y. and Heb, Z.J. (2007) Identification of crack in a rotor system based on wavelet finite element method. The State Key Laboratory for Manufacturing Systems Engineering, Xi’an. [2] Chang, C.-C. and Chen, L.-W. (2005) Detection of the location and size of cracks in the multiple cracked beam by spatial wavelet based approach. Mechanical Systems and Signal Processing, 19, 139-155. doi:10.1016/j.ymssp.2003.11.001 [3] Yeh, P.-L. and Liu, P.-L. (2008) Application of the wave- let transform and the enhanced Fourier spectrum in the impact echo test. NDT&E International, 41, 382-394. doi:10.1016/j.ndteint.2008.01.002 [4] Krug, R., Carballido-Gamio, J., Burgardi, A.J., Haase, S., Sedat, J.W., Moss, W.C. and Majumdar, S. (2007) Wave- let-based characterization of verbecular bone structure from magnetic resonance images at 3 T compared with mi- cro-computed tomography measurements. Magnetic Reso- nance Imaging, 25, 392-398. doi:10.1016/j.mri.2006.09.020 [5] Sullivan, C.J., Garner, S.E., Blagoev, K.B. and Weiss, D.L. (2007) Generation of customized wavelets for the analysis of γ-ray spectra. Nuclear Instruments and Methods in Physics Research Section A: Accelerators, Spectrometers, Detectors and Associated Equipment, 579, 275-278. doi:10.1016/j.nima.2007.04.055 [6] Hariharan, G. and Kannan, K. (2009) Haar wavelet method for solving Cahn-Allen Equation. Applied Mathe- matical Sciences, 3, 2523-2533. [7] Lee, Y.-S. (2009) Principles of terahertz science and technology. Springer, Berlin, 1, 261-262. [8] Nandhakumar, S., Selladurai, V., Muthukumaran, V. and Sekar, S. (2010) Haar wavelet approach to time varying model robot arm control problem. International Journal of Academic Research, 2. |