

Paper Menu >>
Journal Menu >>
 Vol.3, No.11, 907-913 (2011) Natural Science http://dx.doi.org/10.4236/ns.2011.311116 Copyright © 2011 SciRes. OPEN ACCESS Tornado-like non-stationary vortices: experimental modelling under laboratory conditions Aleksei Y. Varaksin*, Mikhael E. Romash, Viktor N. Kopeitsev Joint Institute of High Temperatures, Russian Academy of Sciences, Moscow, Russia; *Corresponding Author: [email protected] Received 16 September 2011; revised 20 October 2011; accepted 30 October 2011. ABSTRACT The purposes of the paper are threefold: 1) to show the fundamental possibility of physical simulation of non-stationary wall-free concen- trated air vortices (called here as tornado-like vortices) under laboratory conditions without using of the mechanical rotation, 2) to find the heating rates of underlying surface and air tem- poral and spatial temperature shear which lead to the stable genesis of wall-free vortices, and 3) to investigate the some parameters of the pro- cess of generation of vortices and their char- acteristics. The wall-free vortices were gener- ated over underlying surface of aluminum sheet due to its controlled heating from below as a result of development of unstable stratifycation of air. Keywords: Vortex Flows; Tornado-Like Flows; Physical Simulation 1. INTRODUCTION As a global phenomenon, tornadoes have been re- ported in many countries in the world, such as Australia, Austria 1, Bermuda Islands, Britain 2, Canada, China, England, France, Germany 3, Holland, Hungary, India, Italy 4, Lithuania 5, Russia, Japan 6 and many oth- ers. However, they are most frequent in spring and summer during the late afternoon on the central plains and in the South-Eastern states in the United States. Each year an average of a thousand tornadoes are re- ported in the United States. Compared with other storms in the nature, a tornado is the most violent one. It is estimated that tornadoes cause about one billion dollars of damage per year in the United States. Additionally to destroying everything on its path the tornadoes lead to the human fatalities 7,8. Some words about tornado study methods. The first method to be introduced is tornado-chasing. Tornado- chasing has become an important activity for many sci- entists and weather enthusiasts to observe the tornado dynamics and collect the data about real tornadoes. The tornado videos recorded by tornado chasers offer us fur- ther understandings about its appearance and formation. Unfortunately, due to the difficulties to put the data re- cording equipments into the tornado path, the real data collection for tornado’s internal dynamics study is still not much successful today. Tornado-chasing has great disadvantage connected with significant risk for chaser’s live during tornado observation. Instead of chasing tornadoes, on the other hand, satel- lite and radar images are also used to understand the flow dynamics of tornadoes. But the cost is high in order to build enough satellites and radars to monitor torna- does. Turbulent and vortex flows (including “bubble-type” vortex) bounded by the walls are formed by way of tan- gential nozzle delivery of medium, application of me- chanical swirling devices (ventilators 9,10, guide swirl vanes, screws, internal spiral ribbing, and the like), and intensive rotation of body elements of channels (rotating tubes, tables 11, tanks 12,13, rotating screen 9, and the like). For the experimental and numerical studies in a closed cylinder, techniques employed include small ro- tating disk 14,15, rotating end wall 16, corotating end walls 17,18 , counter-rotating end walls 19, independ- ently rotating a small central rod 20, and the others. In earlier work by Ward 9 the apparatus produced an adjustably convergent airflow through a fine mesh cy- lindrical wire screen, 8 ft in diameter, which imposes controlled angular momentum by its rotation around the perimeter. The convective flow was created by a vari- able speed exhaust fan with the pressure deficit distrib- uted over the top of the convective chamber, 6 ft in di- ameter and 3 ft high. At the top of the chamber the air passed through a relatively fine mesh honeycomb mate- rial which effectively removed the tangential component from the flow. In 10 the experimental setup represented a closed chamber having the shape of a parallelepiped with trans- 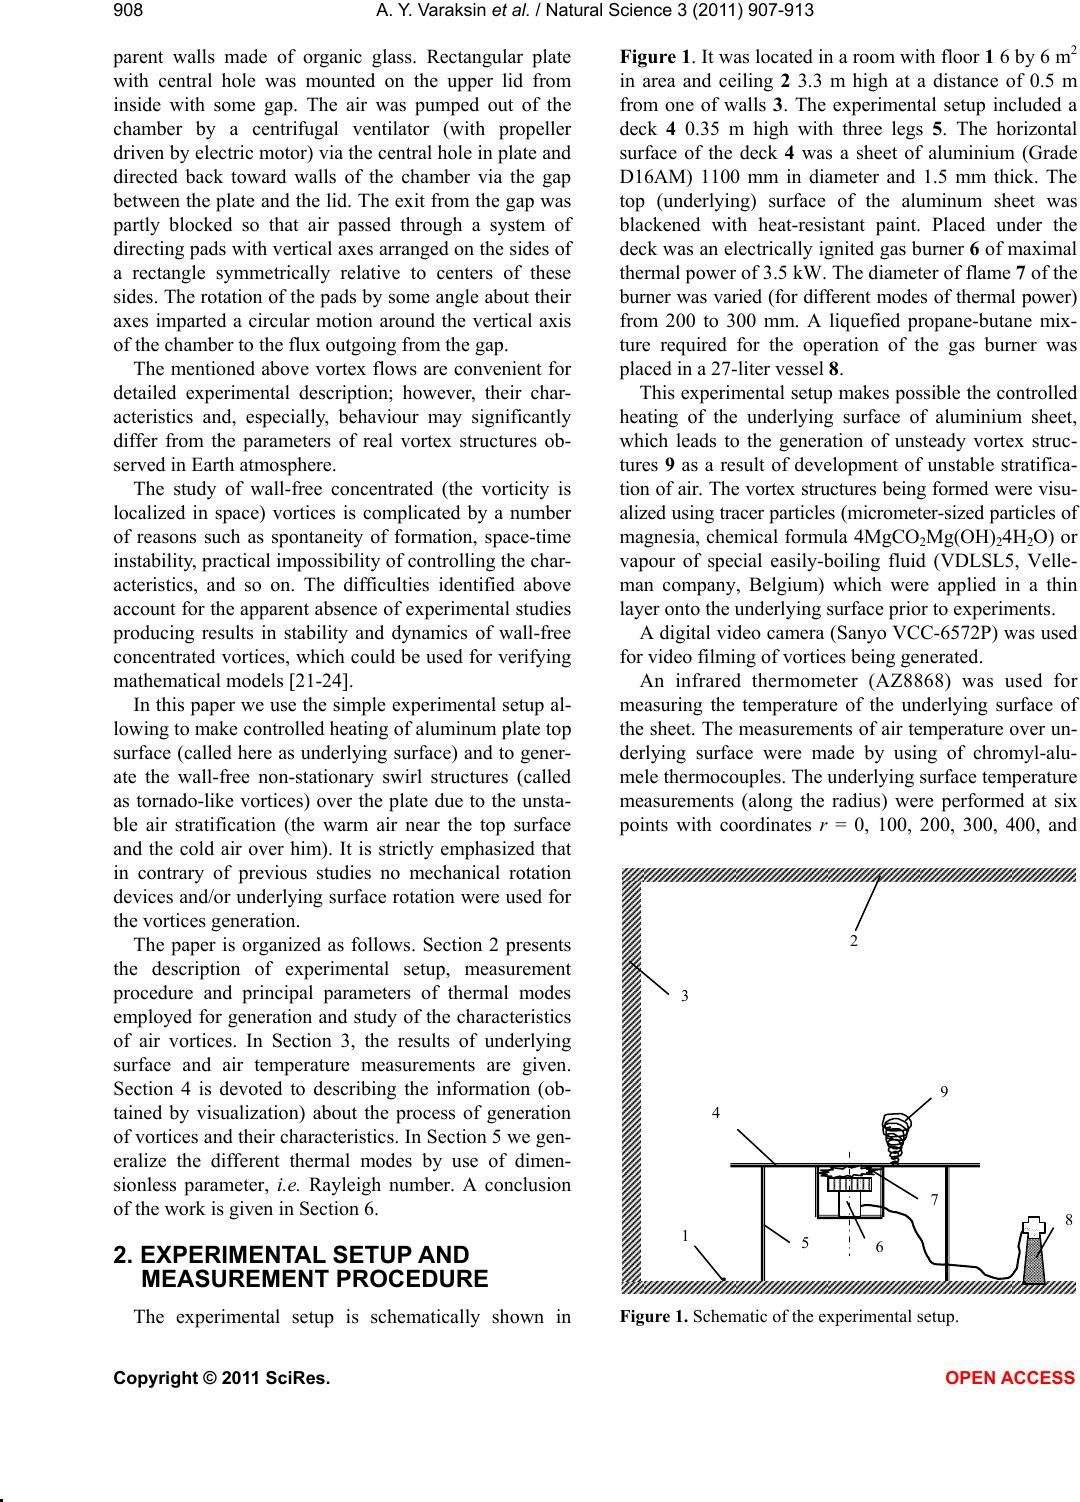 A. Y. Varaksin et al. / Natural Science 3 (2011) 907-913 Copyright © 2011 SciRes. OPEN ACCESS 908 parent walls made of organic glass. Rectangular plate with central hole was mounted on the upper lid from inside with some gap. The air was pumped out of the chamber by a centrifugal ventilator (with propeller driven by electric motor) via the central hole in plate and directed back toward walls of the chamber via the gap between the plate and the lid. The exit from the gap was partly blocked so that air passed through a system of directing pads with vertical axes arranged on the sides of a rectangle symmetrically relative to centers of these sides. The rotation of the pads by some angle about their axes imparted a circular motion around the vertical axis of the chamber to the flux outgoing from the gap. The mentioned above vortex flows are convenient for detailed experimental description; however, their char- acteristics and, especially, behaviour may significantly differ from the parameters of real vortex structures ob- served in Earth atmosphere. The study of wall-free concentrated (the vorticity is localized in space) vortices is complicated by a number of reasons such as spontaneity of formation, space-time instability, practical impossibility of controlling the char- acteristics, and so on. The difficulties identified above account for the apparent absence of experimental studies producing results in stability and dynamics of wall-free concentrated vortices, which could be used for verifying mathematical models 21-24. In this paper we use the simple experimental setup al- lowing to make controlled heating of aluminum plate top surface (called here as underlying surface) and to gener- ate the wall-free non-stationary swirl structures (called as tornado-like vortices) over the plate due to the unsta- ble air stratification (the warm air near the top surface and the cold air over him). It is strictly emphasized that in contrary of previous studies no mechanical rotation devices and/or underlying surface rotation were used for the vortices generation. The paper is organized as follows. Section 2 presents the description of experimental setup, measurement procedure and principal parameters of thermal modes employed for generation and study of the characteristics of air vortices. In Section 3, the results of underlying surface and air temperature measurements are given. Section 4 is devoted to describing the information (ob- tained by visualization) about the process of generation of vortices and their characteristics. In Section 5 we gen- eralize the different thermal modes by use of dimen- sionless parameter, i.e. Rayleigh number. A conclusion of the work is given in Section 6. 2. EXPERIMENTAL SETUP AND MEASUREMENT PROCEDURE The experimental setup is schematically shown in Figure 1. It was located in a room with floor 1 6 by 6 m2 in area and ceiling 2 3.3 m high at a distance of 0.5 m from one of walls 3. The experimental setup included a deck 4 0.35 m high with three legs 5. The horizontal surface of the deck 4 was a sheet of aluminium (Grade D16AM) 1100 mm in diameter and 1.5 mm thick. The top (underlying) surface of the aluminum sheet was blackened with heat-resistant paint. Placed under the deck was an electrically ignited gas burner 6 of maximal thermal power of 3.5 kW. The diameter of flame 7 of the burner was varied (for different modes of thermal power) from 200 to 300 mm. A liquefied propane-butane mix- ture required for the operation of the gas burner was placed in a 27-liter vessel 8. This experimental setup makes possible the controlled heating of the underlying surface of aluminium sheet, which leads to the generation of unsteady vortex struc- tures 9 as a result of development of unstable stratifica- tion of air. The vortex structures being formed were visu- alized using tracer particles (micrometer-sized particles of magnesia, chemical formula 4MgCO2Mg(OH)24H2O) or vapour of special easily-boiling fluid (VDLSL5, Velle- man company, Belgium) which were applied in a thin layer onto the underlying surface prior to experiments. A digital video camera (Sanyo VCC-6572P) was used for video filming of vortices being generated. An infrared thermometer (AZ8868) was used for measuring the temperature of the underlying surface of the sheet. The measurements of air temperature over un- derlying surface were made by using of chromyl-alu- mele thermocouples. The underlying surface temperature measurements (along the radius) were performed at six points with coordinates r = 0, 100, 200, 300, 400, and 9 8 5 3 1 2 7 6 4 Figure 1. Schematic of the experimental setup.  A. Y. Varaksin et al. / Natural Science 3 (2011) 907-913 Copyright © 2011 SciRes. OPEN ACCESS 909909 500 mm (r is the distance from the sheet centre). The air temperature measurements were produced at the same points of horizontal direction and at the different coor- dinates y = 50, 100, 200 and 300 mm (y is the distance from the sheet surface in the vertical direction). Also monitored in the course of experiments was the air temperature in the room. The initial (prior to experi- ments) difference between the air temperature on the level of underlying surface T1 and the vicinity of the room ceiling T2 was ΔT = T2 – T1 1˚C. The maximal increase in the air temperature in the vicinity of the ceil- ing after a single experiment in one thermal mode (see below) reached a value of ΔT 3˚C - 4˚C. Further ex- periments were performed after complete “cooling off” of the room to initial values of temperature. The Table 1 gives the principal parameters of thermal modes employed for generation and study of the charac- teristics of air vortices. 3. UNDERLYING SURFACE AND AIR TEMPERATURE MEASUREMENTS The dependences of temperature on the radius of un- derlying surface and a time in different modes were ob- tained as follows: 1) monitoring of the “inadequate heating” of the surface by way of measuring T = T(r) = const; 2) switching on the gas burner; 3) heating of the underlying surface during time h (see Table 1) for obtaining the distribution of (, )TTr ; 4) switching off of the gas burner; 5) cooling of the underlying sur- face during time c (see Table 1) for obtaining the distribution of (, )TTr . The dependences of air tem- perature on the horizontal and vertical directions and a time (,,) aa TTry were received by similar procedure. Examples of the thus obtained distributions for se- lected thermal modes are given in Figures 2-5. Figure 2 gives the dependence of temperature at the center of underlying surface on time () cc TT for two modes (no. 3 and 6). One can see from the data given in the figure that these modes are characterized by the same heating time (180 h s) and by the following values of maximal temperature: max 500 c T K (mode no. 3) and max 610 c T K (mode No. 6). The temperature distributions along the radius of un- derlying surface for mode no. 6 under heating are given in Figure 3. Some decrease in temperature in the central region of underlying surface (r < 100 mm), observed for short times of heating (120 h s), is attributed to the structural features of the employed gas burner. Figure 4 gives the dependence of air temperature at the center of underlying surface on time () ac ac TT for y = 50 mm over surface for two modes (no. 3 and 6). One can see from the data given in the figure that these modes are characterized by the following values of Table 1. Principal characteristics of experimental modes. No. Mode of heating Heating time τh, s Cooling time τc, s Maximal temperature Tcmax, K 1 60 600 420 2 120 900 470 3 Weak 180 1200 500 4 60 600 500 5 120 900 580 6 Strong 180 1200 610 240 280 320 360 400 440 480 520 560 600 0180 360540 720 90010801260 , s T c , К 1 2 h c Figure 2. The temperature at the center of underlying surface as a function of time: 1—mode No. 3; 2—mode No. 6. 250 300 350 400 450 500 550 600 0100200 300 400500 rmm T, K 1 2 3 4 5 Figure 3. The temperature as a function of the radius of underlying surface and of time under heating (mode no.6): 1—τh = 0; 2—τh = 30 s; 3—τh = 60 s; 4—τh = 120 s; 5—τh = 180 s. maximal air temperature: max 315 ac T K (mode no. 3) and max 334 ac T K (mode no. 6). The air temperature distributions along the radius of  A. Y. Varaksin et al. / Natural Science 3 (2011) 907-913 Copyright © 2011 SciRes. OPEN ACCESS 910 underlying surface for mode no. 6 under heating are given in Figure 5. It is clearly seen, that the air tem- perature distributions are not uniform. The maximal air temperature shear is realized in a circular region (150 mm < r < 250 mm), i.e. in the same region of abrupt rise of underlying surface temperature gradient (see Figure 3). Some increase in air temperature in the peripheral region (r > 400 mm), is attributed, probably, to the exis- tence of upstream flow of warm air from bottom part of aluminum sheet due to gas burner operation. 4. VORTEX PARAMETERS STUDY BY VISUALIZATION The video filming and use of tracer (magnesia) and vapour particles made it possible to visualize the vortex structures arising above the underlying surface. Frame-by-frame analysis (see Figure 6) of video re- 280 290 300 310 320 330 340 0180360 54072090010801260 , c T ac , К 1 2 h c Figure 4. The temperature of air as a function of time (y = 50 mm, r = 0): 1—mode No. 3; 2—mode No. 6. 280 300 320 340 0100 200 300400500 rmm T a , K 1 2 3 4 5 Figure 5. The temperature of air as a function of the radius of underlying surface and of time under heating (mode no.6), y = 50 mm: 1—τh = 0; 2—τh = 30 s; 3— τh = 60 s; 4—τh = 120 s; 5—τh = 180 s. cords in different thermal modes (see Table 1) enables one to obtain information about the following parame- ters of the process of generation of vortices and their characteristics: 1) the values of underlying and air tem- peratures, at which the vortices are generated; 2) the region of underlying surface, where the vortices are generated; 3) the direction of rotation of vortex structure; 4) the number of vortices observed per experiment; 5) the trajectory of travel of the base of vortex structure; 6) the length of the trajectory of the vortex base; 7) the ve- locity of travel of the vortex base; 8) the lifetime of vor- tex structure; 9) the visible height of vortices; 10) the visible diameter of vortices, and others. Repeated experiments in different thermal modes gave rise to the following inferences. A stable generation of vortices was observed in all modes except for mode no. 1 (see Table 1). Vortex structures began to form in the mode of heating of the underlying surface after the tem- perature at its center reached a value of 470 c T K. The largest vortices were generated at a temperature at the surface center 570 c T K. Vortex structures were largely generated in a circular region (150 mm < r < 250 mm), i.e. in the region of abrupt rise of temperature gra- dient. The preferable direction of rotation of vortices was not observed. Up to ten vortex structures were ob- served per experiment. Three types of trajectories of motion of vortex base were identified. The majority of vortex structures moved along spiral trajectories (trajec- tories of the first type) within the circular region (150 mm < r < 250 mm) in which they were generated. Some vortices moved in fact along the shortest, almost recti- linear trajectories (trajectories of the second type) from the region of their generation to the edge of underlying surface where they disintegrated. Some vortices pro- duced the wake in a form of “circle” (trajectories of the Figure 6. A typical frame (negative) with a registered vortex (mode No. 6); magnesia particles visualization, the image size is 1.0 by 0.75 m. 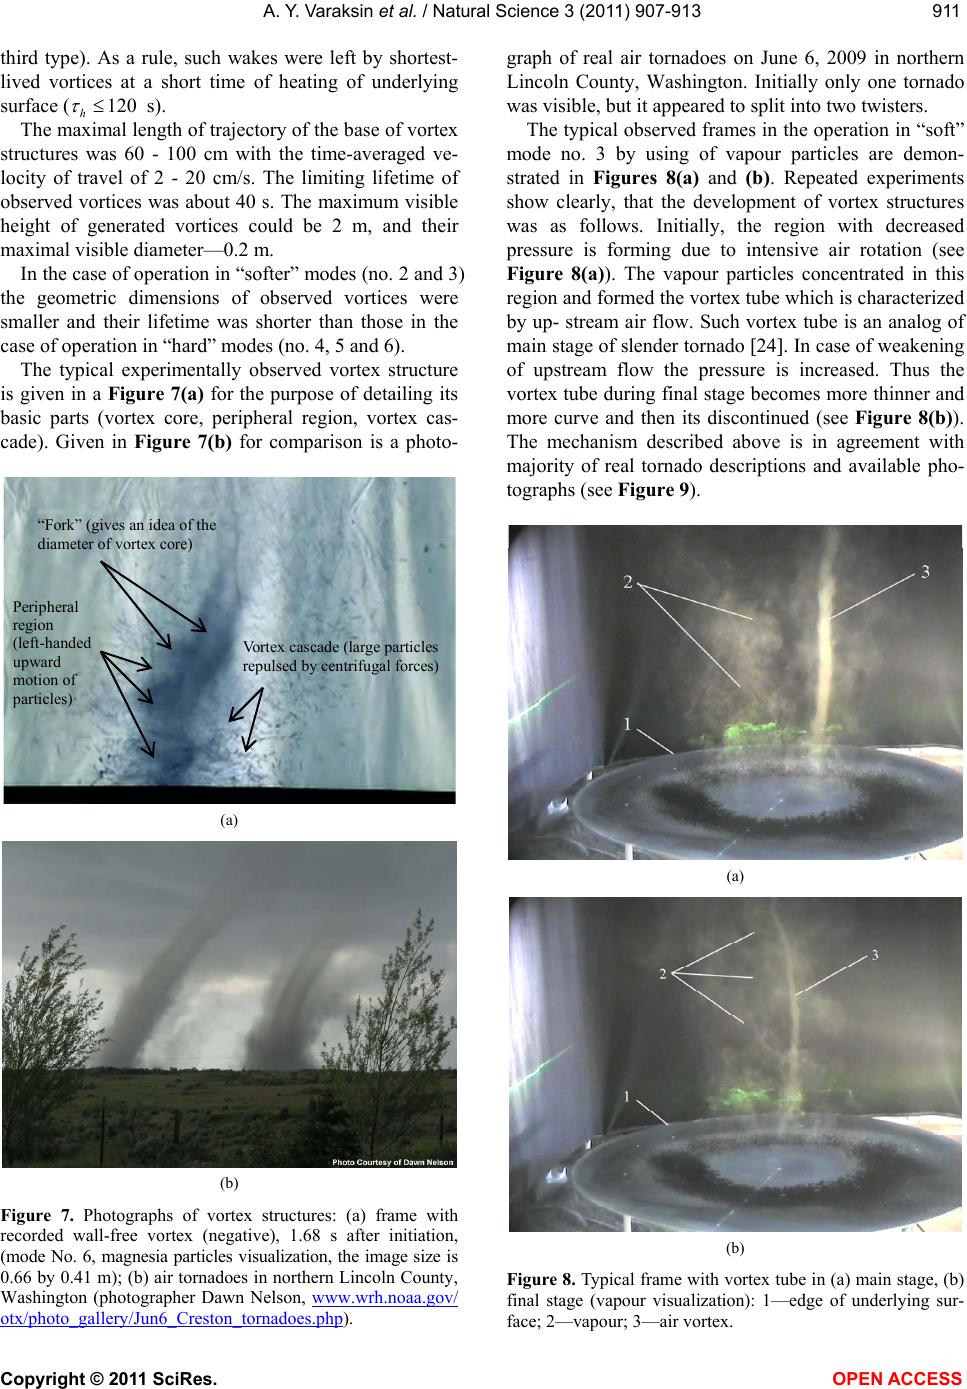 A. Y. Varaksin et al. / Natural Science 3 (2011) 907-913 Copyright © 2011 SciRes. OPEN ACCESS 911911 third type). As a rule, such wakes were left by shortest- lived vortices at a short time of heating of underlying surface (120 h s). The maximal length of trajectory of the base of vortex structures was 60 - 100 cm with the time-averaged ve- locity of travel of 2 - 20 cm/s. The limiting lifetime of observed vortices was about 40 s. The maximum visible height of generated vortices could be 2 m, and their maximal visible diameter—0.2 m. In the case of operation in “softer” modes (no. 2 and 3) the geometric dimensions of observed vortices were smaller and their lifetime was shorter than those in the case of operation in “hard” modes (no. 4, 5 and 6). The typical experimentally observed vortex structure is given in a Figure 7(a) for the purpose of detailing its basic parts (vortex core, peripheral region, vortex cas- cade). Given in Figure 7(b) for comparison is a photo- Vortex cascade (large particles repulsed by centrifugal forces) “Fork” (gives an idea of the diameter of vortex core) Peripheral region (left-handed upward motion of p articles) (a) (b) Figure 7. Photographs of vortex structures: (a) frame with recorded wall-free vortex (negative), 1.68 s after initiation, (mode No. 6, magnesia particles visualization, the image size is 0.66 by 0.41 m); (b) air tornadoes in northern Lincoln County, Washington (photographer Dawn Nelson, www.wrh.noaa.gov/ otx/photo_gallery/Jun6_Creston_tornadoes.php). graph of real air tornadoes on June 6, 2009 in northern Lincoln County, Washington. Initially only one tornado was visible, but it appeared to split into two twisters. The typical observed frames in the operation in “soft” mode no. 3 by using of vapour particles are demon- strated in Figures 8(a) and (b). Repeated experiments show clearly, that the development of vortex structures was as follows. Initially, the region with decreased pressure is forming due to intensive air rotation (see Figure 8(a)). The vapour particles concentrated in this region and formed the vortex tube which is characterized by up- stream air flow. Such vortex tube is an analog of main stage of slender tornado 24. In case of weakening of upstream flow the pressure is increased. Thus the vortex tube during final stage becomes more thinner and more curve and then its discontinued (see Figure 8(b)). The mechanism described above is in agreement with majority of real tornado descriptions and available pho- tographs (see Figure 9). (a) (b) Figure 8. Typical frame with vortex tube in (a) main stage, (b) final stage (vapour visualization): 1—edge of underlying sur- face; 2—vapour; 3—air vortex. 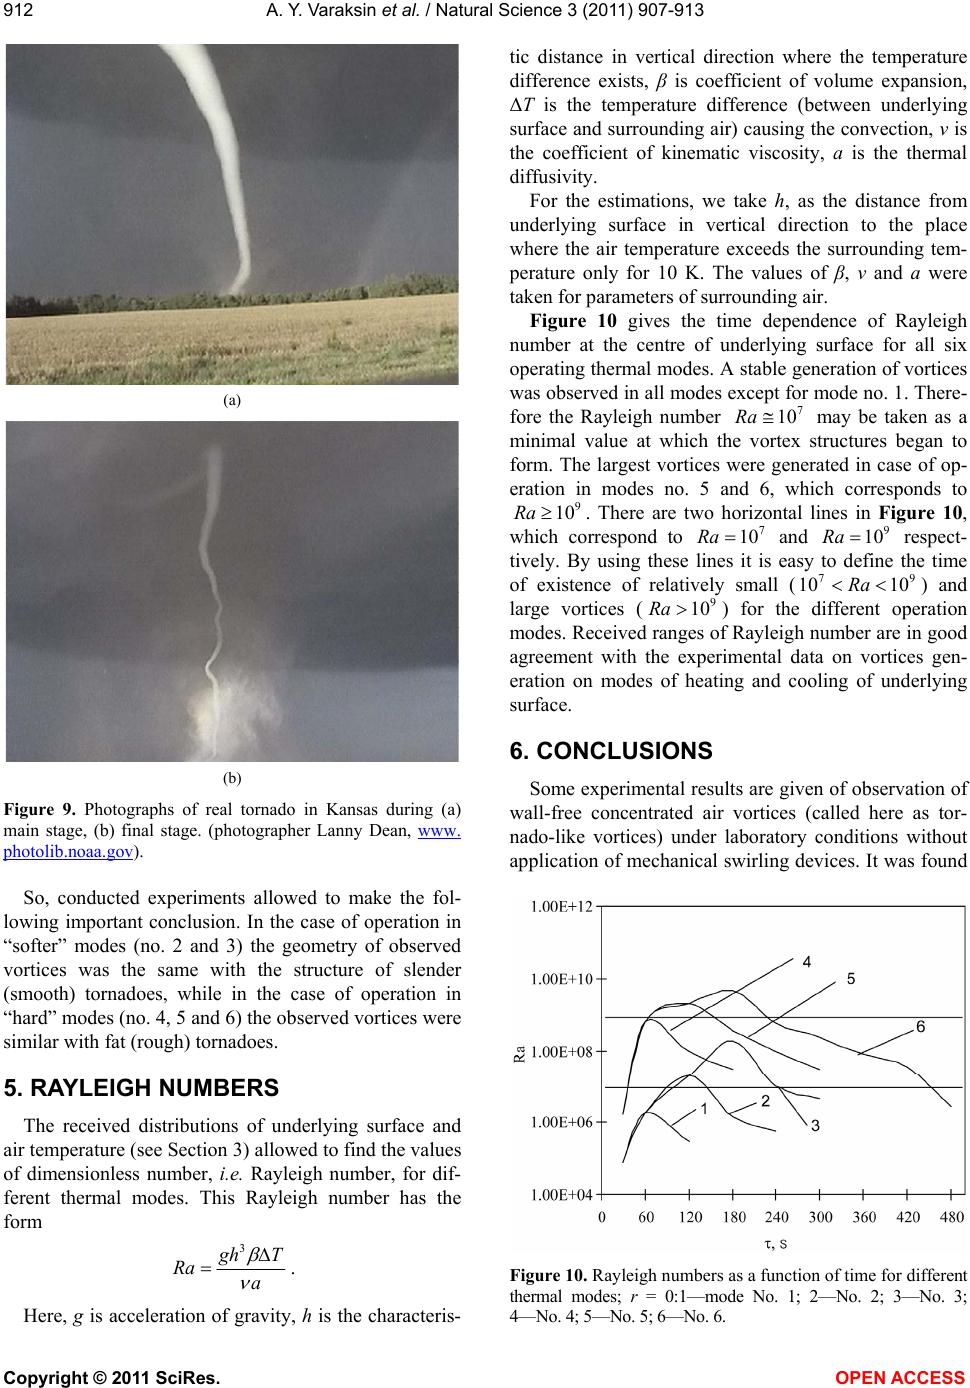 A. Y. Varaksin et al. / Natural Science 3 (2011) 907-913 Copyright © 2011 SciRes. OPEN ACCESS 912 (a) (b) Figure 9. Photographs of real tornado in Kansas during (a) main stage, (b) final stage. (photographer Lanny Dean, www. photolib.noaa.gov). So, conducted experiments allowed to make the fol- lowing important conclusion. In the case of operation in “softer” modes (no. 2 and 3) the geometry of observed vortices was the same with the structure of slender (smooth) tornadoes, while in the case of operation in “hard” modes (no. 4, 5 and 6) the observed vortices were similar with fat (rough) tornadoes. 5. RAYLEIGH NUMBERS The received distributions of underlying surface and air temperature (see Section 3) allowed to find the values of dimensionless number, i.e. Rayleigh number, for dif- ferent thermal modes. This Rayleigh number has the form 3 g hT Ra a . Here, g is acceleration of gravity, h is the characteris- tic distance in vertical direction where the temperature difference exists, β is coefficient of volume expansion, ΔT is the temperature difference (between underlying surface and surrounding air) causing the convection, v is the coefficient of kinematic viscosity, a is the thermal diffusivity. For the estimations, we take h, as the distance from underlying surface in vertical direction to the place where the air temperature exceeds the surrounding tem- perature only for 10 K. The values of β, v and a were taken for parameters of surrounding air. Figure 10 gives the time dependence of Rayleigh number at the centre of underlying surface for all six operating thermal modes. A stable generation of vortices was observed in all modes except for mode no. 1. There- fore the Rayleigh number 7 10Ra may be taken as a minimal value at which the vortex structures began to form. The largest vortices were generated in case of op- eration in modes no. 5 and 6, which corresponds to 9 10Ra . There are two horizontal lines in Figure 10, which correspond to 7 10Ra and 9 10Ra respect- tively. By using these lines it is easy to define the time of existence of relatively small (79 10 10Ra) and large vortices (9 10Ra ) for the different operation modes. Received ranges of Rayleigh number are in good agreement with the experimental data on vortices gen- eration on modes of heating and cooling of underlying surface. 6. CONCLUSIONS Some experimental results are given of observation of wall-free concentrated air vortices (called here as tor- nado-like vortices) under laboratory conditions without application of mechanical swirling devices. It was found Figure 10. Rayleigh numbers as a function of time for different thermal modes; r = 0:1—mode No. 1; 2—No. 2; 3—No. 3; 4—No. 4; 5—No. 5; 6—No. 6. 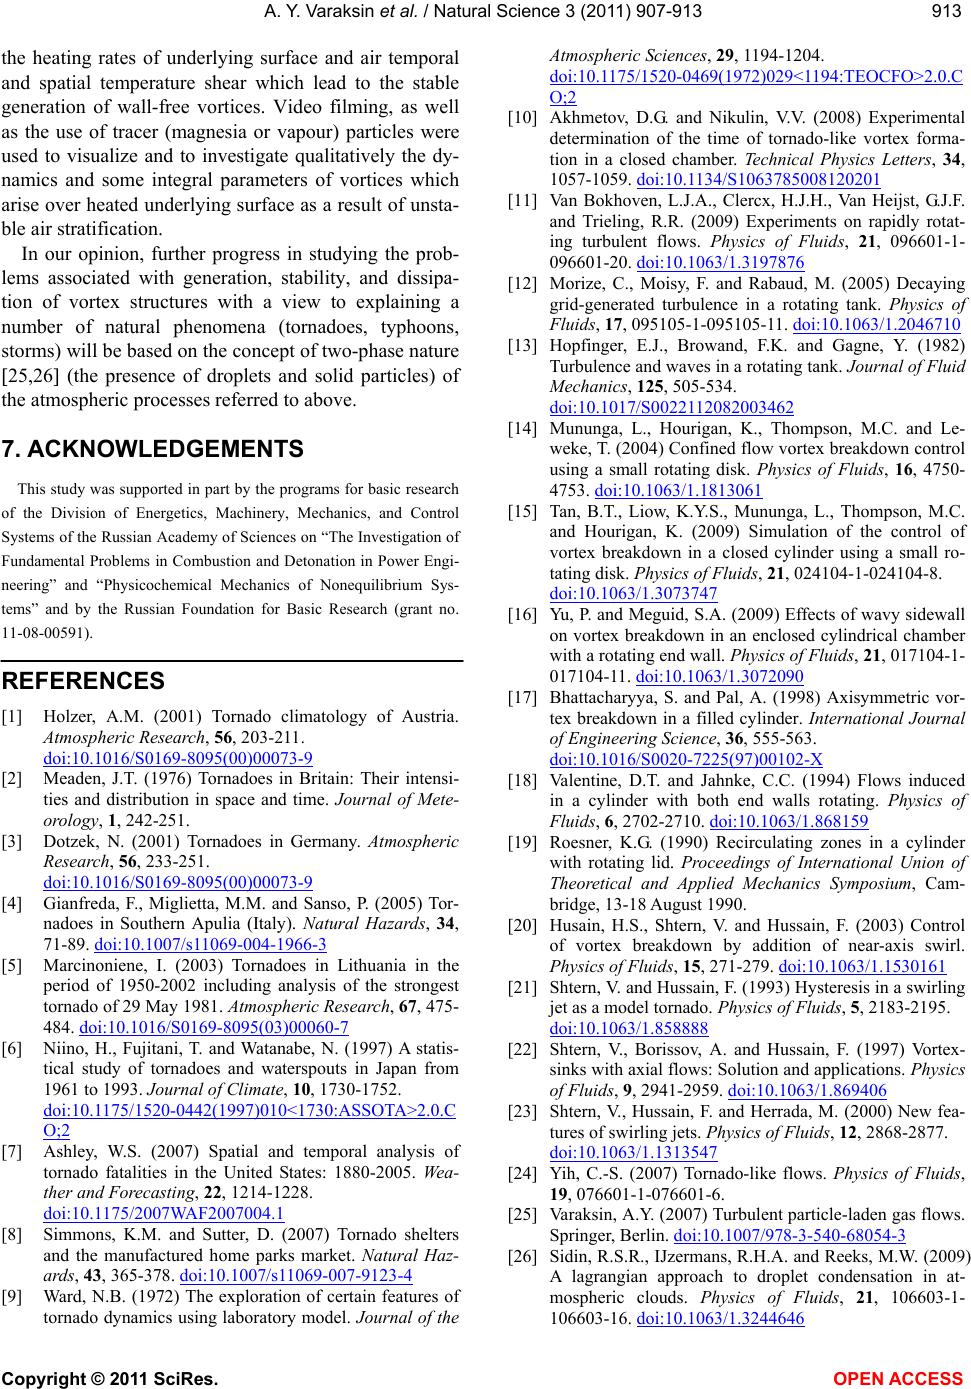 A. Y. Varaksin et al. / Natural Science 3 (2011) 907-913 Copyright © 2011 SciRes. OPEN ACCESS 913913 the heating rates of underlying surface and air temporal and spatial temperature shear which lead to the stable generation of wall-free vortices. Video filming, as well as the use of tracer (magnesia or vapour) particles were used to visualize and to investigate qualitatively the dy- namics and some integral parameters of vortices which arise over heated underlying surface as a result of unsta- ble air stratification. In our opinion, further progress in studying the prob- lems associated with generation, stability, and dissipa- tion of vortex structures with a view to explaining a number of natural phenomena (tornadoes, typhoons, storms) will be based on the concept of two-phase nature 25,26 (the presence of droplets and solid particles) of the atmospheric processes referred to above. 7. ACKNOWLEDGEMENTS This study was supported in part by the programs for basic research of the Division of Energetics, Machinery, Mechanics, and Control Systems of the Russian Academy of Sciences on “The Investigation of Fundamental Problems in Combustion and Detonation in Power Engi- neering” and “Physicochemical Mechanics of Nonequilibrium Sys- tems” and by the Russian Foundation for Basic Research (grant no. 11-08-00591). REFERENCES [1] Holzer, A.M. (2001) Tornado climatology of Austria. Atmospheric Research, 56, 203-211. doi:10.1016/S0169-8095(00)00073-9 [2] Meaden, J.T. (1976) Tornadoes in Britain: Their intensi- ties and distribution in space and time. Journal of Mete- orology, 1, 242-251. [3] Dotzek, N. (2001) Tornadoes in Germany. Atmospheric Research, 56, 233-251. doi:10.1016/S0169-8095(00)00073-9 [4] Gianfreda, F., Miglietta, M.M. and Sanso, P. (2005) Tor- nadoes in Southern Apulia (Italy). Natural Hazards, 34, 71-89. doi:10.1007/s11069-004-1966-3 [5] Marcinoniene, I. (2003) Tornadoes in Lithuania in the period of 1950-2002 including analysis of the strongest tornado of 29 May 1981. Atmospheric Research, 67, 475- 484. doi:10.1016/S0169-8095(03)00060-7 [6] Niino, H., Fujitani, T. and Watanabe, N. (1997) A statis- tical study of tornadoes and waterspouts in Japan from 1961 to 1993. Journal of Climate, 10, 1730-1752. doi:10.1175/1520-0442(1997)010<1730:ASSOTA>2.0.C O;2 [7] Ashley, W.S. (2007) Spatial and temporal analysis of tornado fatalities in the United States: 1880-2005. Wea- ther and Forecasting, 22, 1214-1228. doi:10.1175/2007WAF2007004.1 [8] Simmons, K.M. and Sutter, D. (2007) Tornado shelters and the manufactured home parks market. Natural Haz- ards, 43, 365-378. doi:10.1007/s11069-007-9123-4 [9] Ward, N.B. (1972) The exploration of certain features of tornado dynamics using laboratory model. Journal of the Atmospheric Sciences, 29, 1194-1204. doi:10.1175/1520-0469(1972)029<1194:TEOCFO>2.0.C O;2 [10] Akhmetov, D.G. and Nikulin, V.V. (2008) Experimental determination of the time of tornado-like vortex forma- tion in a closed chamber. Technical Physics Letters, 34, 1057-1059. doi:10.1134/S1063785008120201 [11] Van Bokhoven, L.J.A., Clercx, H.J.H., Van Heijst, G.J.F. and Trieling, R.R. (2009) Experiments on rapidly rotat- ing turbulent flows. Physics of Fluids, 21, 096601-1- 096601-20. doi:10.1063/1.3197876 [12] Morize, C., Moisy, F. and Rabaud, M. (2005) Decaying grid-generated turbulence in a rotating tank. Physics of Fluids, 17, 095105-1-095105-11. doi:10.1063/1.2046710 [13] Hopfinger, E.J., Browand, F.K. and Gagne, Y. (1982) Turbulence and waves in a rotating tank. Journal of Fluid Mechanics, 125, 505-534. doi:10.1017/S0022112082003462 [14] Mununga, L., Hourigan, K., Thompson, M.C. and Le- weke, T. (2004) Confined flow vortex breakdown control using a small rotating disk. Physics of Fluids, 16, 4750- 4753. doi:10.1063/1.1813061 [15] Tan, B.T., Liow, K.Y.S., Mununga, L., Thompson, M.C. and Hourigan, K. (2009) Simulation of the control of vortex breakdown in a closed cylinder using a small ro- tating disk. Physics of Fluids, 21, 024104-1-024104-8. doi:10.1063/1.3073747 [16] Yu, P. and Meguid, S.A. (2009) Effects of wavy sidewall on vortex breakdown in an enclosed cylindrical chamber with a rotating end wall. Physics of Fluids, 21, 017104-1- 017104-11. doi:10.1063/1.3072090 [17] Bhattacharyya, S. and Pal, A. (1998) Axisymmetric vor- tex breakdown in a filled cylinder. International Journal of Engineering Science, 36, 555-563. doi:10.1016/S0020-7225(97)00102-X [18] Valentine, D.T. and Jahnke, C.C. (1994) Flows induced in a cylinder with both end walls rotating. Physics of Fluids, 6, 2702-2710. doi:10.1063/1.868159 [19] Roesner, K.G. (1990) Recirculating zones in a cylinder with rotating lid. Proceedings of International Union of Theoretical and Applied Mechanics Symposium, Cam- bridge, 13-18 August 1990. [20] Husain, H.S., Shtern, V. and Hussain, F. (2003) Control of vortex breakdown by addition of near-axis swirl. Physics of Fluids, 15, 271-279. doi:10.1063/1.1530161 [21] Shtern, V. and Hussain, F. (1993) Hysteresis in a swirling jet as a model tornado. Physics of Fluids, 5, 2183-2195. doi:10.1063/1.858888 [22] Shtern, V., Borissov, A. and Hussain, F. (1997) Vortex- sinks with axial flows: Solution and applications. Physics of Fluids, 9, 2941-2959. doi:10.1063/1.869406 [23] Shtern, V., Hussain, F. and Herrada, M. (2000) New fea- tures of swirling jets. Physics of Fluids, 12, 2868-2877. doi:10.1063/1.1313547 [24] Yih, C.-S. (2007) Tornado-like flows. Physics of Fluids, 19, 076601-1-076601-6. [25] Varaksin, A.Y. (2007) Turbulent particle-laden gas flows. Springer, Berlin. doi:10.1007/978-3-540-68054-3 [26] Sidin, R.S.R., IJzermans, R.H.A. and Reeks, M.W. (2009) A lagrangian approach to droplet condensation in at- mospheric clouds. Physics of Fluids, 21, 106603-1- 106603-16. doi:10.1063/1.3244646 |