

Paper Menu >>
Journal Menu >>
 International Journal of Geosciences, 2011, 2, 468-475 doi:10.4236/ijg.2011.24049 Published Online November 2011 (http://www.SciRP.org/journal/ijg) Copyright © 2011 SciRes. IJG Improving the Predictive Capability of Popular SWCCs by Incorporating Maximum Possible Suction Shada H. Krishnapillai, Nadarajah Ravichandran Civil Engineering Department, Clemson University, Clemson, USA E-mail: [email protected] Received July 12, 201 1; revised August 27, 2011; accepted October 6, 2011 Abstract Soil-water characteristic curve (SWCC) that represents the relationship between the soil moisture and matric suction is one of the important constitutive models required for numerical modeling of unsaturated soils. An effective SWCC model should be capable of calculating the moisture-suction variation for the entire range of degree of saturation. Applicability of popular SWCC models such as Brooks and Corey, van Genuchten, and Fredlund and Xing is limited, especially in low (<20%) degree of saturation range. In this study, all these models are modified by incorporating maximum suction as one of the model parameters, so that these mod- els can be effectively used over the entire range of degree of saturation. The Fredlund et al. (1994) perme- ability function is also modified based on the modification to the Fredlund and Xing SWCC model. The ap- plicability of the improved models is investigated by calibrating the SWCC of various types of soil and pre- sented in this paper. Based on this study it can be concluded that the modified models are flexible enough to fit the experimental data for the entire range of degree of saturation. Keywords: Unsaturated Soils, Soil Water Characteristic Curve, Permeability Function, Relative Permeability of Unsaturated Soils, Relative Permeability Using Soil Water Characteristic Curve 1. Introduction Unsaturated soil is a three phase porous media consisting of three bulk phases: solid skeleton, water, and pore air. In addition to these three bulk phases, there exist three interfaces: solid-water interface, solid-air interface, and water-air interface. Of the three interfaces, the water-air interface also known as contractile skin that does not exist in either saturated or dry soil influences the flow and mechanical behavior of unsaturated soil. The con- tractile skin maintains the pressure balance between wa- ter and air phases. The difference between the air pres- sure and water pressure is known as matric suction. 1.1. Soil Water Characteristic Curves The Soil Water Characteristic Curves (SWCC) is a rela- tionship between the amount of water present in the soil (moisture) and the suction characteristics of the soil ma- trix. The amount of water present in the soil can be ex- pressed in terms of degree of saturation (S), volumetric water content (θ), or gravimetric water content (w). Many researchers have identified the factors which in- fluence the shape of the SWCC and based on that, many mathematical SWCC models were developed. These basic soil properties include void ratio, void distribution, particle size distribution and initial density. Gardner [1], Brooks and Corey [2], van Genuchten [3], Kosugi [4], and Fredlund and Xing [5] are some of the notable mathematical models found in the literature. All these models confirm an inverse proportional relationship be- tween S and suction (ψ). This can be explained with the fundamental meniscus theory shown in Equation (1). When the S increases, the radius of the meniscus (Rs) will increase. When Rs increases, the pressure difference between the pore air pressure and the pore water pressure (matric suction) will decrease. 2 gl s s T pp R (1) where m is the suction, pg is pore gas pressure, pl is pore liquid pressure, and Ts is surface tension. The air-entry value and pore size distribution are two basic parameters incorporated in widely used Brooks and Corey (B-C), van Genuchten (v-G), and Fredlund and  469 S. H. KRISHNAPILLAI ET AL. Xing (F-X) and are denoted by a an d n, respectively. The B-C model shown in Equation (2) is one of the basic SWCC models developed with two parameters. Although this is widely us ed model, it doe s not provide a continuous mathematical function for the entire range of S. 1 =ln r m n sr eψa (2) where a and n are the fitting parameters. The parameter a is related to the air-entry suction of the soil and the n is related to the pore size distribution of the soil, θ is volu- metric water content, θr is residual water content, and θs is saturated water content. The v-G model shown in Equation (3) provides a sin- gle equation for the en tire range of S. This model has an additional fitting parameter m, thereby making this mod- el more flexible compared to the B-C model. 1 1 r m n sr a (3) where the fitting parameter m is related to residual water content. In some versions the parameter m is related to n resulting in only two independent parameters a and n. Other parameters are same as in the B-C model. The F-X model is shown in Equation (4). The F-X model assumes a maximum suction of 1,000,000 kPa at dry condition, while the B-C and the v-G models assume infinite value of maximum suction. This maximum pos- sible suction of 1,000,000 kPa for any soil is based on thermodynamic principles rather than actual measure- ment. The F-X model is similar to the v-G model other than the correction factor ()C and the logarithmic function in the equation. The logarithmic function is the key in the F-X equation (Equation (4)). It keeps the de- nominator a nonzero value for any suction value. The corresponding correction function is shown in Equation (5). This equation can be literally used for degree of saturation that is below residual value. However, Fred- lund and Xing [5] suggested another form of the same model which is shown in Equation (5). This second form can be used if a residual water content is known. ln m n s C eψa (4) 6 ln 1 1ln 110 r r ψψ Cψ ψ (5) 1 ln r m n sr ea (6) where is the suction corresponding to the residu r ψ water contental r . and other parameters ar the v-G odel tion of the permeability is important for s in ty of unsatu- e same as in m 1.2. Relative Permeability Functions Accurate evalua accurate modeling of flow and deformation problem unsaturated soils. Because the permeabili rated soil is uniquely influenced by the degree of satura- tion [6], the soil water characteristic curve (SWCC) of the soil can be used to predict the permeability coeffi- cient. The SWCC is a unique constitutive equation in unsaturated soil that relates the degree of saturation to the matric suction and it incorporates the basic soil prop- erties associated with flow such as void ratio, pore size distribution, void distribution, particle size distribution and initial density. The major advantage of using the SWCC is that the moisture-suction relationship can be easily obtained experimentally than the moisture-per- meability relationship. Based on F-X SW CC model, the permeability functio n shown in Equation (7) was proposed by Fredlund et al. [6]. ln d y b y y eey e ln d aev ry bsy y Keey e (7) where ψ is suction, Kr(ψ) is the relative perm suction ψ, ψaev is the air-entry su ction, y is a dummy var- iable of integration, b = ln(l,000,000), θ is volumetric o calcd ils B-C and v-G models, a residual water con- eability at water content given in Equation (4) and θ′ is its deriva- tive. a, n, m and Cr are fitting parameters of the F-X model (Equation (4)). 1.3. Need for Modification to the Existing Popular SWCC and Relative Permeability Model The B-C, v-G, and F-X models are being widely used t ulate the moisture-suction relation of unsaturate . For the so tent value has to be specified. However these two models calculate unrealistic suction when the normalized water content is zero or less, i.e. water content of the soil is less than or equal to the residual water content. In the F-X model, the maximum suction is assumed to be 1,000,000 kPa. Although there are thermodynamic concepts to back up this maximum suction, it is a concern to use a fixed value for all types of soils. In addition, when the actual Copyright © 2011 SciRes. IJG  S. H. KRISHNAPILLAI ET AL. 470 ts that there are three major di itional fitting parameter Cr. Incorporating the m lthough there are nu merous SWCC models available in e the popu- lar models. The B-C and v-G models e modified primarily to make sure that these models no he improved Brooks and Corey (I-B-C) model is given C moditional fitting parameter is introduced. ven though the maximum suction ψmax is incorporated maximum suction is low, usage of such larger maximum suction value might over predict shear strength in nu- merical simulations. Similar to the B-C and v-G models, the second form of the F-X model (Equation (5)) also calculates an unrealistic suction when the normalized water content is zero or less. Therefore, to avoid an un- realistic suction value at zero normalized water content, the maximum suction value should be specified even with a residual water content specified. In addition, the fourth model parameter Cr in the F-X model is chosen from a wide range (1 to 1,000,000 kPa) and it creates difficulties in achieving a unique set of calibrated model parameters. Also, the Cr affects the initial portion of the curve when the value of Cr is relatively low and it is considered as another disadvantage [6]. The primary objective of this study is to increase the flexibility o f the B-C and v-G models so that these models can predict realistic high suctions in low degree of saturations with- out causing numerical instabilities in finite element simu- lations. That is, in the modeling the dynamic behavior of unsaturated soils, there are numerous constitutive rela- tions that can cause “numerical problems” during the simulation. The best example is the nonlinear constitu- tive model (elastoplastic stress-strain model). The other one is the soil water characteristic cu rve which is used to calculate the suction value at a given time increment for the calculated degree of saturation or vise versa. If the calculated suction is really large or really small, it can introduce really large or really small number in one of the element matrices (mass, damping or fluid stiffness). This might result in crashing the program even with really small time increment. It is very challenging to model the soil behavior from a fully dry condition to a fully saturated condition using a single fully coupled finite element computer code. The current state of the art sugges fficulties in developing numerically stable simulation capability. They are: difficulties in dealing with multiple nodal/element variables in finite element formulation of porous media at these extreme conditions, difficulties in developing stress-strain behavior with appropriate stress state variables at these extreme conditions, and difficul- ties in accurately calculating the suction over the entire range of degree of saturation. The modified models can be incorporated in finite element simulation without in- troducing numerical instabilities from SWCC. The idea here is to modify the original curve in such a way it cal- culates a finite number at very low degree of saturation. In the original model, the curve is very steep at low de- gree of saturation. A small change in degree of saturation can result in unrealistic suction value at very low degree of saturation. Since the modified curve calculates finite values, numerical instability can be reduced or elimi- nated. In this study, the B-C and v-G models are modified by incorporating correction factors. Also, the correction factor in the F-X model is modified to avoid the effects of add aximum suction as part of the model increased its flexibility in fitting measured data of various soils over the full range of S. All three models are improved with the feature to specify both residual water content and maximum suction values. The capability of the improved models is verified by matching with the experimental data and prediction of original models. Based on the im- proved F-X model, the permeability function proposed by Fredlund et al. [6] is modified and presented. 2. Improved SWCC Models and Comparisons A the literature, this study is intended to improv B-C, v-G, and F-X ar longer calculate high suction when the normalized water content is zero or less. And also the modified models have the feature to specify both residual water content an d maximum suction values. 2.1. The Improved Brooks and Corey (I-B-C) Model T in Equation (8). To preserve the advantage of the B- el, no add E in the equation, it cannot be considered to be a fitting parameter, as the shape of the SWCC cannot be changed by adjusting the ψmax. The I-B-C model does not provide a continuous mathematical function for the entire range of degree of saturation but gives a finite number of suc- tion value at very low degree of saturation value. 1if if r n sr ψa Cψa a (8) The correction function for the I-B-C model is shown below in Equation (9). A trial and error followed to fit the data and there was no theoretical basis for the equation for the correction function. An obvious procedure was condition needed to be satisfied was to obtain the correc- tion function but to obtain C is equal to zero at the residual water content. 1r C (9) Copyright © 2011 SciRes. IJG  471 S. H. KRISHNAPILLAI ET AL. where r is suction at residual water content r and other parameters are same as i the B-C model. If the residual water content in s set to zero, then r becomes max . 2.2. Coparison of the B-C and the I-B-C Models ca m The pability of the Improved B-C (I-B-C) model in redicting the moisture-suction relation is investigated soils. heof B-C and I-B-C Models for Columbia ndy loam (data from [2]) is shown in Figure 1. The ontent is assumed to be zero for all four so ils. As sh p and compared with the B-C model for four different comparison T sa Figures 2 and 3 show the comparison for Madrid clay sand and Arlington soil, respectively. The Figures 4 shows the comparison for Indian head till (data from [8]). It should be noted that the experimental SWCC data are not available for the full range of S (0% - 100%). Based on the experimental data, the maximum suction of 1,000,000 kPa is chosen for all four soils. The residual water c own in these figures, the predictions by I-B-C model shows slight improvement compared to the original B-C model. The B-C, I-B-C models are not effective for Figure 1. B-C and I-B-C SWCCs for Columbia sandy loam. Figure 3. B-C and I-B-C SWCCs for Arlington soil. Figure 4. B-C and I-B-C SWCCs for Indian head till. sandy soils and it is eviden tly shown in Figure 1 as th e se models failed to keep the shape of the SWCC without reaching zero normalized water content in low suction range. 2.3. The Improved van Genuchten (I-v-G) Model The Improved van Genuchten (I-v-G) model is given in Equation (10). Since the parameter a is related to the air- entry suction, the model is revised so that the parameter a has the unit of suction. The I-v-G model is developed wit h the feature to specify both residual water content and maximum suction value with no additional fitting parameter. Figure 2. B-C and I-B-C SWCCs for Madrid clay sand. 1n sr a quation (11) . r m C (10) The modified correction function is shown below in E 0.5 max 1 1m Cm (11) where ψmax is maxi mum suction and other par ameters are Copyright © 2011 SciRes. IJG 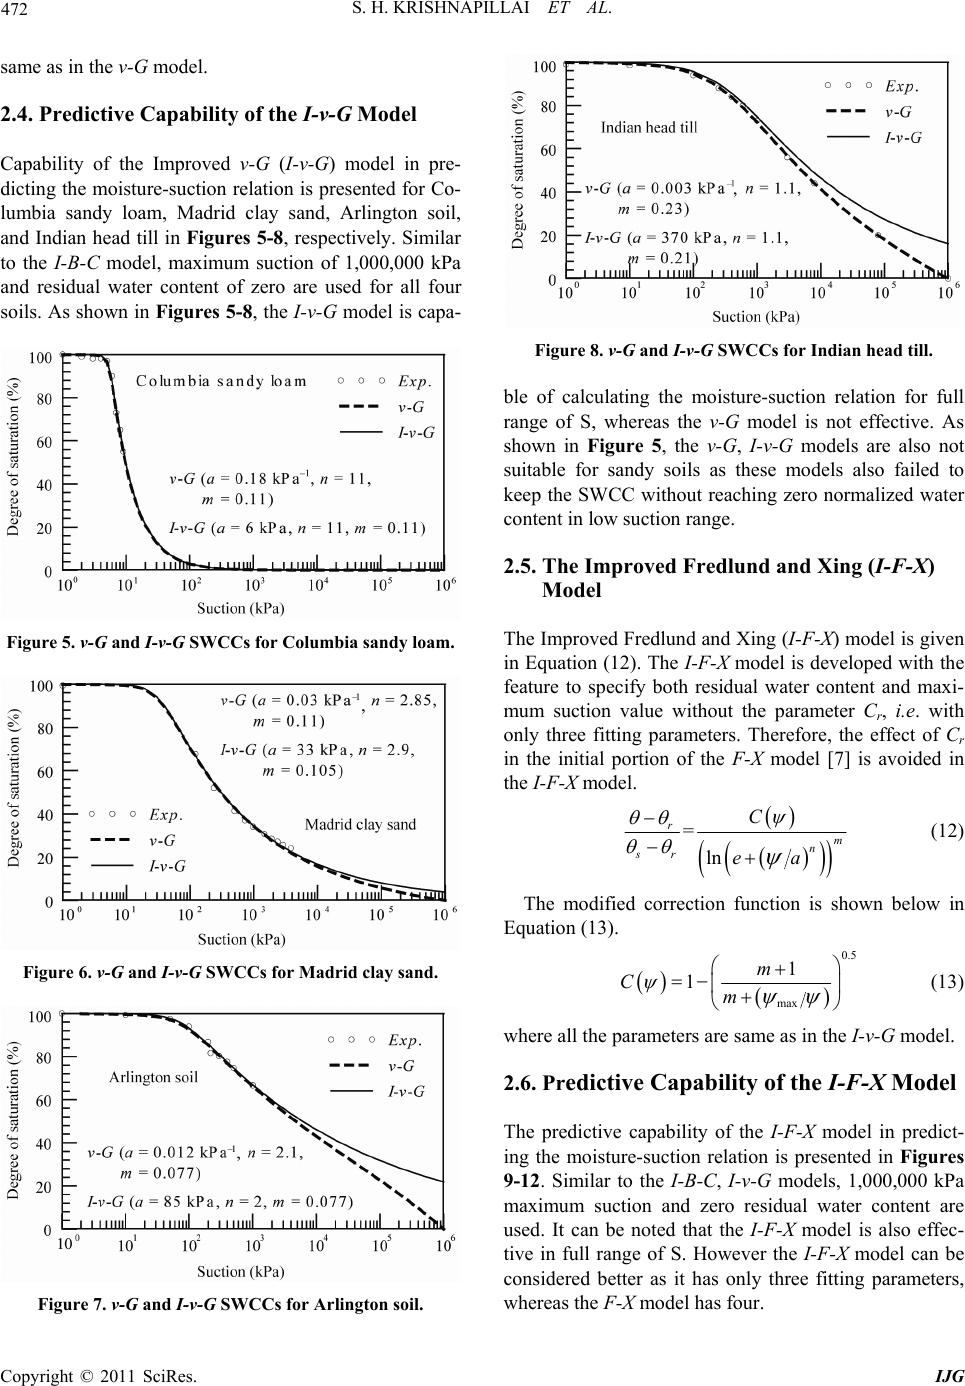 S. H. KRISHNAPILLAI ET AL. 472 2.4. Predictive Capability of the I-v-G Model Capability of the Improved v-G (I-v-G) model in pre- dicting the moisture-suction relation is presen ted for Co- lu Figures 5-8, respectively. Similar to the I-B-C model, maximum suction of 1,000,000 kPa and residual water content of zero are us soils. As shown in Figures 5-8, the I-v-G model is capa- same as in the v-G model. mbia sandy loam, Madrid clay sand, Arlington soil, and Indian head till in ed for all four Figure 5. v-G and I-v-G SWCCs for Columbia sandy loam. Figure 6. v-G and I-v-G SWCCs for Madrid clay sand. Figure 8. v-G and I-v-G SWCCs for Indian head till. ble of calculating the moisture-suction relation for full range of S, whereas the v-G model is not effective. As shown in Figure 5, the v-G, I-v-G models are also not suitable for sandy soils as these models also failed to keep the SWCC without reaching zero normalized water content in low suction range. 2.5. The Improved Fredlund and Xing (I-F-X) Model The Improved Fredlund and Xing (I-F-X) model is given in Ehe quation (12). The I-F-X model is developed with t feature to specify both residual water content and maxi- mum suction value without the parameter Cr, i.e. with only three fitting parameters. Therefore, the effect of Cr in the initial portion of the F-X model [7] is avoided in the I-F-X model. Figure 7. v-G and I-v-G SWCCs for Arlington soil. = rC ln sr ea he modified m n (12) T correction function is shown below in quation (13) . E 0.5 max 1 1m Cm (13) where all the parameters are same as in the I-v-G model. 2.6. Predictive Capability of the I-F-X Model The predictive capability of the I-F-X mo ing the moisture-suction relation is presented in Figures 9-12. Similar to the I-B-C, I-v-G models, 1,000,000 kPa m e of S. However the I-F-X model can be considered better as it has only three fittin whereas the F-X model has four. del in predict- aximum suction and zero residual water content are used. It can be noted that the I-F-X model is also effec- tive in full rangg parameters, Copyright © 2011 SciRes. IJG 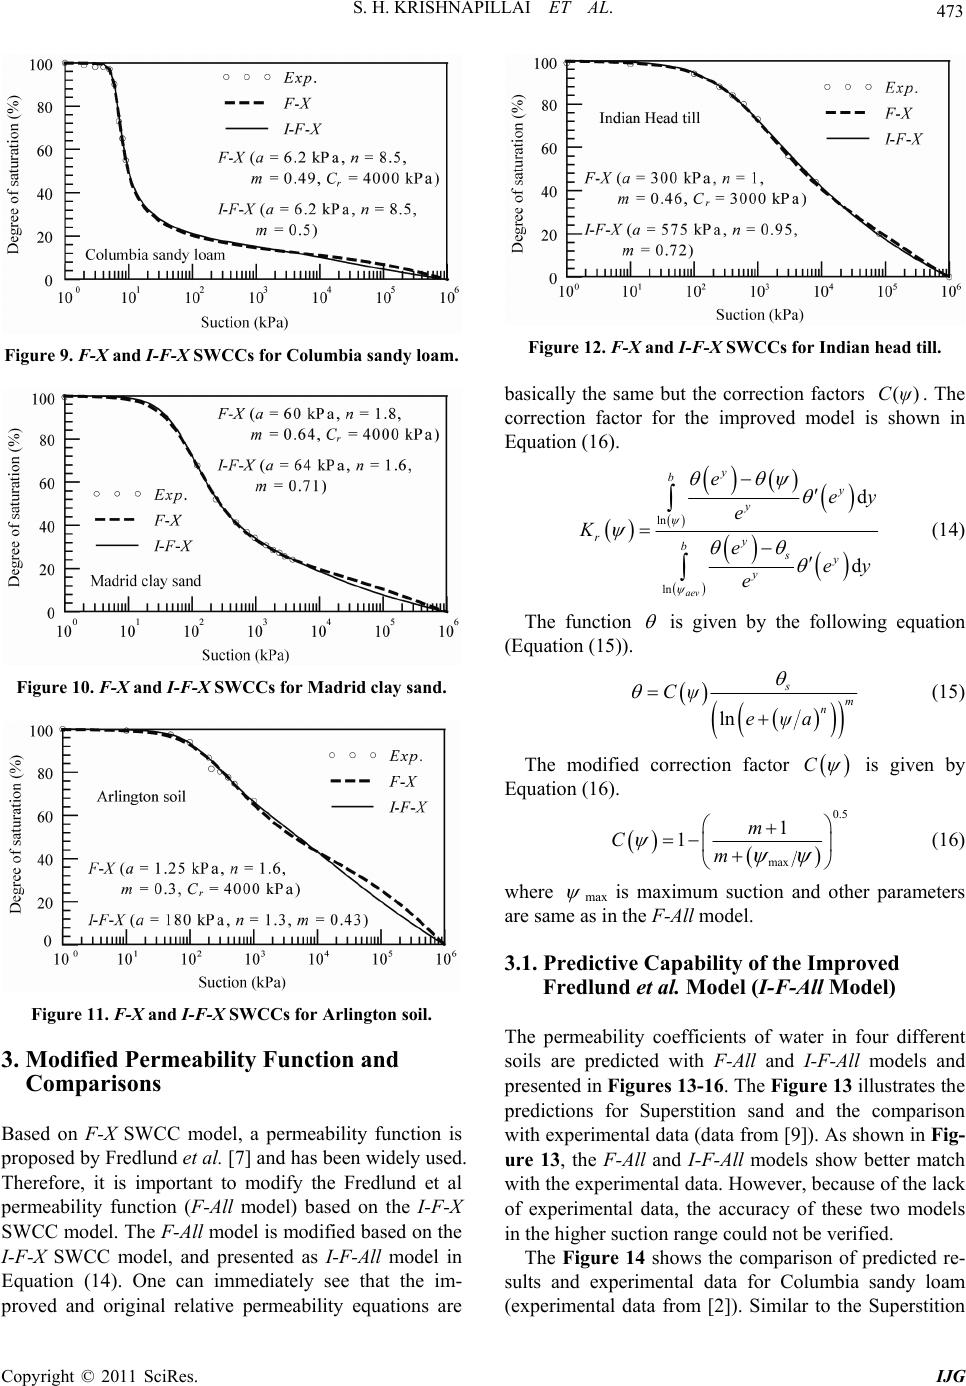 473 S. H. KRISHNAPILLAI ET AL. Figure 9. F-X and I-F-X SWCCs for Columbia sandy loam. Figure 10. F-X and I-F-X SWCCs for Madrid clay sand. Figure 11. F-X and I-F-X SWCCs for Arlington soil. 3. Modified Permeability Function and Comparisons Based on F-X SWCC model, a permeability function is proposed by Fredlund et al. [7] and has been widely used. Therefore, it is important to modify the Fredlund et al permeability function (F-All model) based on the I-F-X SWCC model. Th e F-All model is modified based on the I-F-X SWCC model, and presented as I-F-All model in Equation (14). One can immediately see that the im prore - ved and original relative permeability equations a Figure 12. F-X and I-F-X SWCCs for Indian head till. basically the same but the correction factors . The correction factor for the improved model in in Equation (16) . ()Cψ s show ln ln d d aev y b y y ry bsy y eey e Keey e (14) The function is given by the following equation (E quation (15) ). ln s m n Cψ eψa (15) The modified correction factor C is given by Equation (16) . 0.5 max 1 1m Cm where (16) max e same as in the-All model. is maximum suction and other parameters ar F 3.1. Predictive Capability of the Improved Fredlund et al. Model (I-F-All Mo The permeability coefficients of water in four different so I-F-A res 13-16. The Figure 13 illustrates the predictions for Superstition sand and the comparison with experimental data (data from [9]). As ure 13, the F-All and I-F-All models show better match ecy of these two models the higher suction range could not be verified. ted re- sultsloam xperimental data from [2]). Similar to the Superstition del) ils are predicted with F-All and ll models and presented in Figu shown in Fig- with thexperimental data. However, because of the lack of experimental data, the accura in The Figure 14 shows the comparison of predic and experimental data for Columbia sandy (e Copyright © 2011 SciRes. IJG 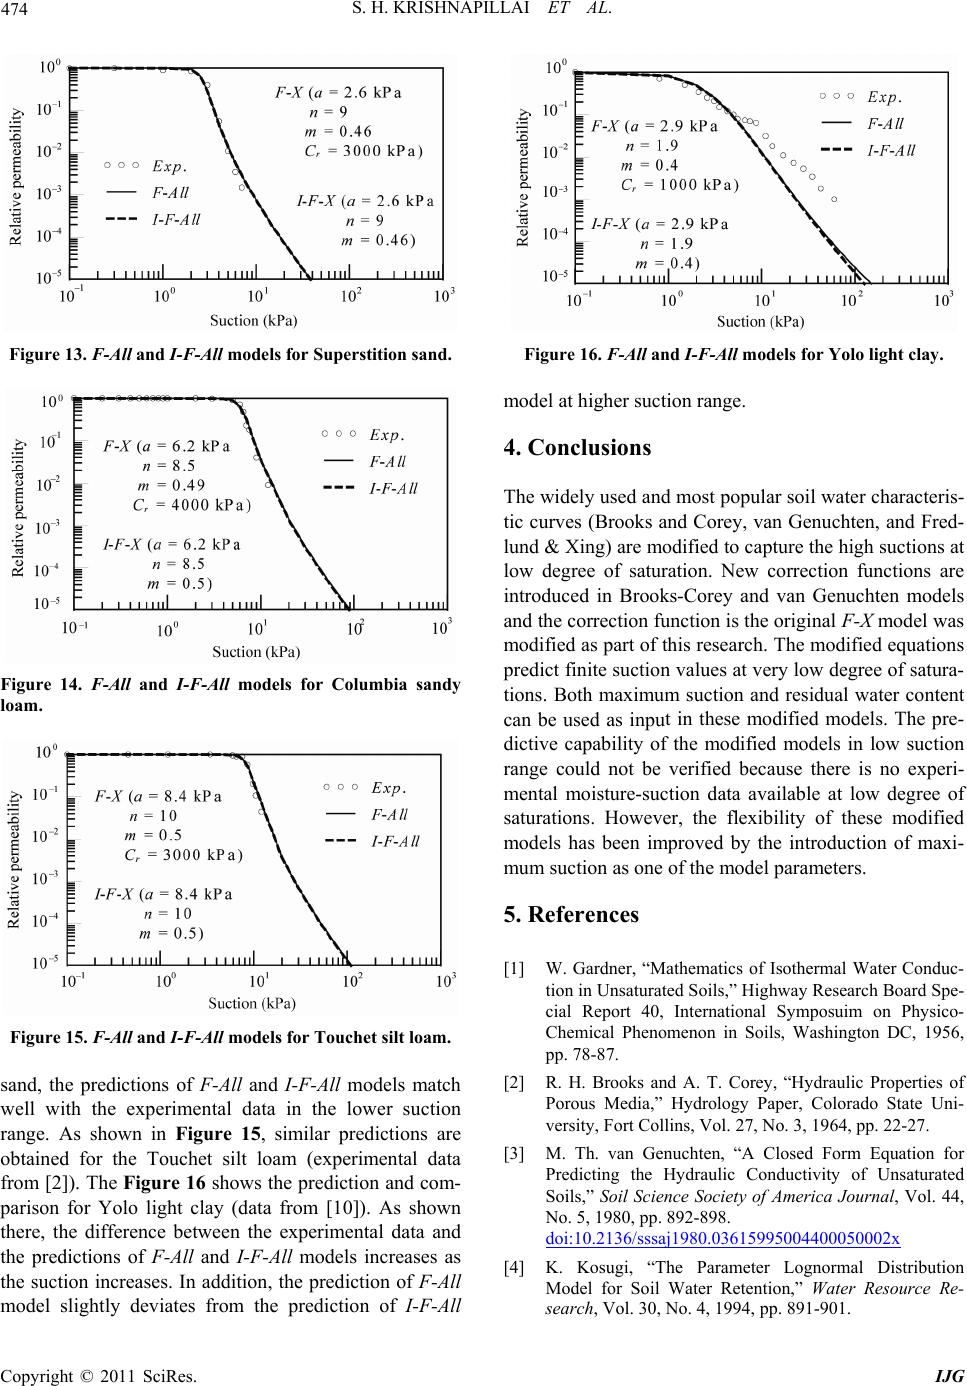 S. H. KRISHNAPILLAI ET AL. 474 Figure 13. F-All and I-F-All models for Superstition sand. Figure 14. F-All and I-F-All models for Columbia sandy loam. Figure 15. F-All and I-F-All models for Touchet silt loam. sand, the predictions of F-All and I-F-All models match well with the experimental data in the lower suction range. As shown in Figure 15, similar predictions are obtained for the Touchet silt loam (experimental data from [2]). The Figure 16 shows the prediction and com- parison for Yolo light clay (data from [10]). As shown there, the difference between the experimental data and the predictions of F-All and I-F-All models increases the suction increases. In addition, the prediction of F-All model slightly deviates from the prediction of I-F-Al as l Figure 16. F-All and I-F-All models for Yolo light clay. model at higher suction range. 4. Conclusions The widely used and most popular soil water characteris- tic curves (Brooks and Corey, van Genuchten, and Fred- lund & Xing) are modified to capture the high suctions at low degree of saturation. New correction functions are introduced in Brooks-Corey and van Genuchten models and the correction function is the original F-X model was ms predict finite suctio n values at very low degree of satura- nd residual water content t in these modified models. The pre- the modified models in low suction uation for ted ience Society of America Journal, Vol. 44, . 892-898. doi:10.2136/sssaj1980.03615995004400050002x odified as part of this research. The modified equation tions. Both maximum suction a can be used as inpu dictive capability of range could not be verified because there is no experi- mental moisture-suction data available at low degree of saturations. However, the flexibility of these modified models has been improved by the introduction of maxi- mum suction as one of the model parameters. 5. References [1] W. Gardner, “Mathematics of Isothermal Water Conduc- tion in Unsaturated Soils,” Highway Research Board Spe- cial Report 40, International Symposuim on Physico- Chemical Phenomenon in Soils, Washington DC, 1956, pp. 78-87. [2] R. H. Brooks and A. T. Corey, “Hydraulic Properties of Porous Media,” Hydrology Paper, Colorado State Uni- versity, Fort Collins, Vol. 27, No. 3, 1964, pp. 22-27. [3] M. Th. van Genuchten, “A Closed Form Eq Predicting the Hydraulic Conductivity of Unsatura Soils,” Soil Sc No. 5, 1980, pp [4] K. Kosugi, “The Parameter Lognormal Distribution Model for Soil Water Retention,” Water Resource Re- search, Vol. 30, No. 4, 1994, pp. 891-901. Copyright © 2011 SciRes. IJG 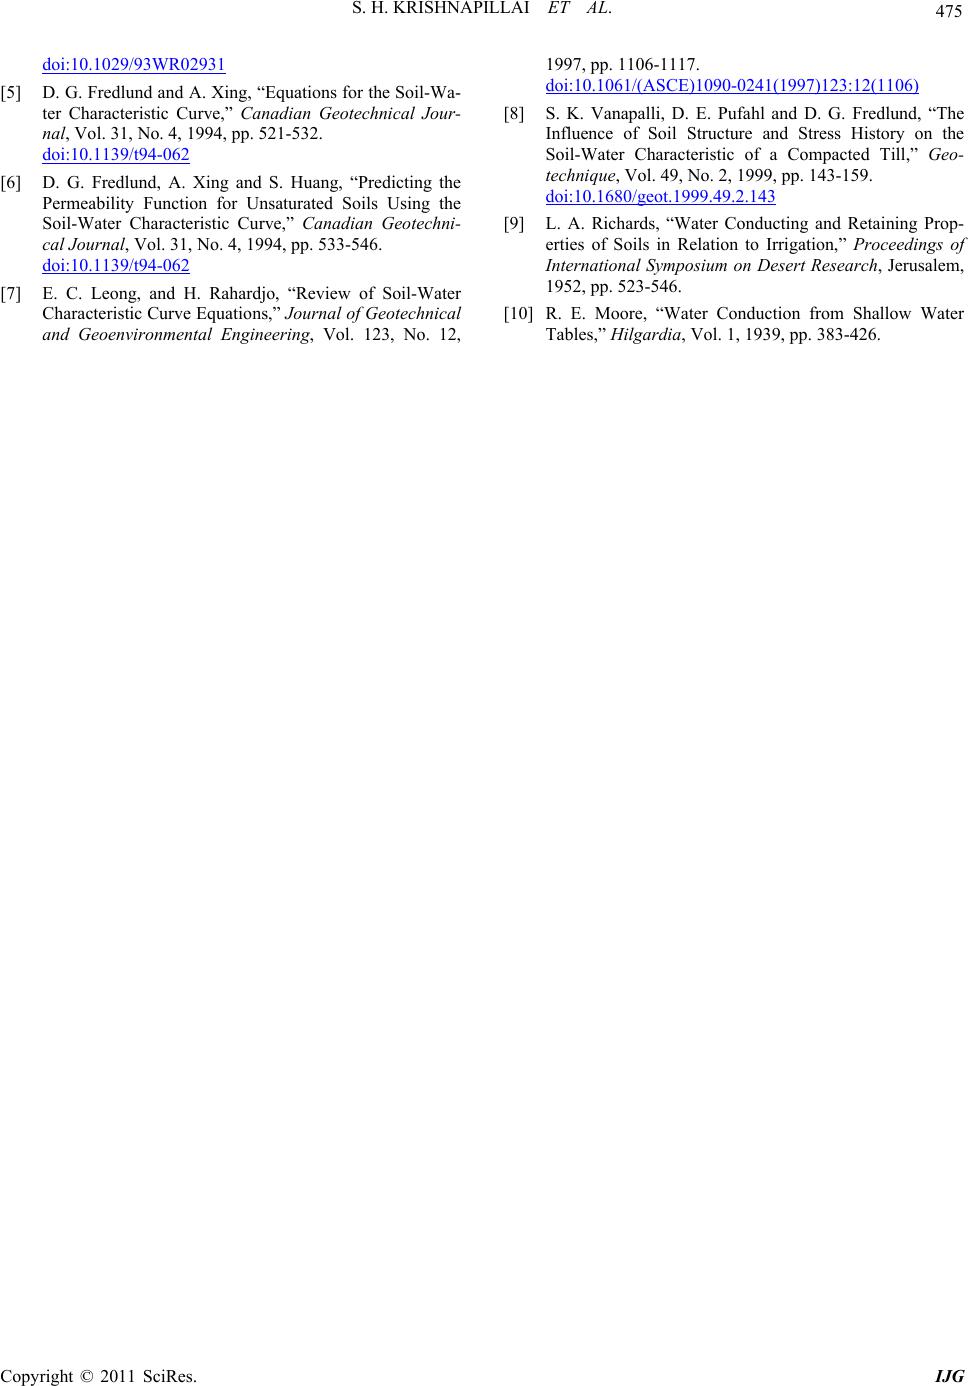 S. H. KRISHNAPILLAI ET AL. Copyright © 2011 SciRes. IJG 475 doi:10.1029/93WR02931 [5] D. G. Fredlund and A. Xing, “Equations for the Soil-Wa- ter Characteristic Curve,” Canadian Geotechnical Jour- nal, Vol. 31, No. 4, 1994, pp. 521-532. doi:10.1139/t94-062 [6] D. G. Fredlund, A. Xing and S. Huang, “Predicting the Permeability Function for Unsaturated Soils Using the Soil-Water Characteristic Curve,” Canadian Geotechni- cal Journal, Vol. 31, No. 4, 1994, pp. 533-546. doi:10.1139/t94-062 [7] E. C. Leong, and H. Rahardjo, “Review of Soil-Water Characteristic Curve Equations,” Journal of Geotechnical and Geoenvironmental Engineering, Vol. 123, No. 12, 1997, pp. 1106-1117. doi:10.1061/(ASCE)1090-0241(1997)123:12(1106) . Pufahl and D. G. Fredlund, “The .49.2.143 [8] S. K. Vanapalli, D. E Influence of Soil Structure and Stress History on the Soil-Water Characteristic of a Compacted Till,” Geo- technique, Vol. 49, No. 2, 1999, pp. 143-159. doi:10.1680/geot.1999 rop- low Water pp. 383-426. [9] L. A. Richards, “Water Conducting and Retaining P erties of Soils in Relation to Irrigation,” Proceedings of International Symposium on Desert Research, Jerusalem, 1952, pp. 523-546. [10] R. E. Moore, “Water Conduction from Shal Tables,” Hilgardia, Vol. 1, 1939, |