

Paper Menu >>
Journal Menu >>
 International Journal of Geosciences, 2011, 2, 523-529 doi:10.4236/ijg.2011.24055 Published Online November 2011 (http://www.SciRP.org/journal/ijg) Copyright © 2011 SciRes. IJG 523 Changes in the Shoreline Position Caused by Natural Processes for Coastline of Marsa Alam and Hamata, Red Sea, Egypt Khalid Dewidar Department of Envi ron mental Science, Faculty of Science, Mansoura University, New Damietta City, Egypt E-mail: [email protected] Received June 17, 2011; revised July 26, 2011; accepted September 3, 2011 Abstract The probability of storms and ice-drift events and their impact on coasts is expected to increase as result of climate change. Multi-years shoreline mapping is considered a valuable task for coastal monitoring and as- sessment. This paper presents shoreline maps illustrating the shoreline erosion accretion pattern in the coastal area between Marsa Alam and Hamata of Red Sea coastline by using different sources of remote sensing data. In the present study, Landsat MSS (1972), Landsat TM (1990), Landsat ETM+ (1998, 2000) and Terra Aster (2007) satellite images were used. In this study, two techniques were used to estimate rate of shoreline retreat. The first technique is corresponding to the formation of automated shoreline positions and the second one is for estimating rate of shoreline change based on data of remote sensing applying Digital Shoreline Analysis System (DSAS) software. In this study, the End Point Rate (EPR) was calculated by dividing the distance of shoreline movement by the time elapsed between the earliest and latest measurements at each transect. Alongshore rate changes shows that there are changes of erosion and accretion pattern due to coastal processes and climate changes. Keywords: Shoreline Changes, Red Sea, Satellite Images, Climate Changes, Coastal Processes 1. Introduction The coastal area consists of the interface between land and sea. It is highly dynamic environment with many physical processes, such as tidal inundation, sea level rise and coastal geomorphology. The horizontal position of the land-water interface is constantly changing with time as the water level moves up and down. Water level of the sea fluctuates due to short-term effects of tides as well as long-term relative sea level changes. It is also, affected by wind, atmospheric pressure, river discharge, beach changes, and steric effects due to changing salinity and temperature of the water body. The Intergovernmen- tal Panel on Climate Changes (IPCC) Fourth Assessment Report (AR4) noted that coastal vulnerability assess- ments still focus mainly on sea level rise, with less atten- tion to other dimensions of climate change. The impacts of rising temperatures are most unambiguous, both on high latitude coasts subject to increased erosion as sea level rise and permafrost melts and on low latitude coral reef coasts subject to increased bleaching and mortality. Also, increased sea surface temperatures due to global warming may increase the frequency and intensity of hurricanes [1]. These changes in storm frequency and their intensity could also change patterns of alongshore sediment transport. Ashton et al.[2] conducted that rais- ing sea level not only increases the likelihood of coastal flooding, but changes the template for waves and tides to sculpt the coast, which can lead to land loss orders of magnitude greater than that from direct inundation alone. Nicholls et al. [3] stated that to better support climate and coastal management policy development, more inte- grated assessments of climate change in coastal areas are required, including the significant non-climate changes. The Red Sea region has been targeted for massive tourism development in Egypt. The majority of the re- sorts were built along a coastal stretch of the Red Sea with about 50 - 300 m coastal setback depending on the shoreline conditions. The climate of the Red Sea is equa- torial, 35˚C - 41˚C in average. Water temperature is 18˚C - 21˚C in winter and 21˚C - 26˚C in summer. The Red Sea has relatively little water exchange with the Medi- 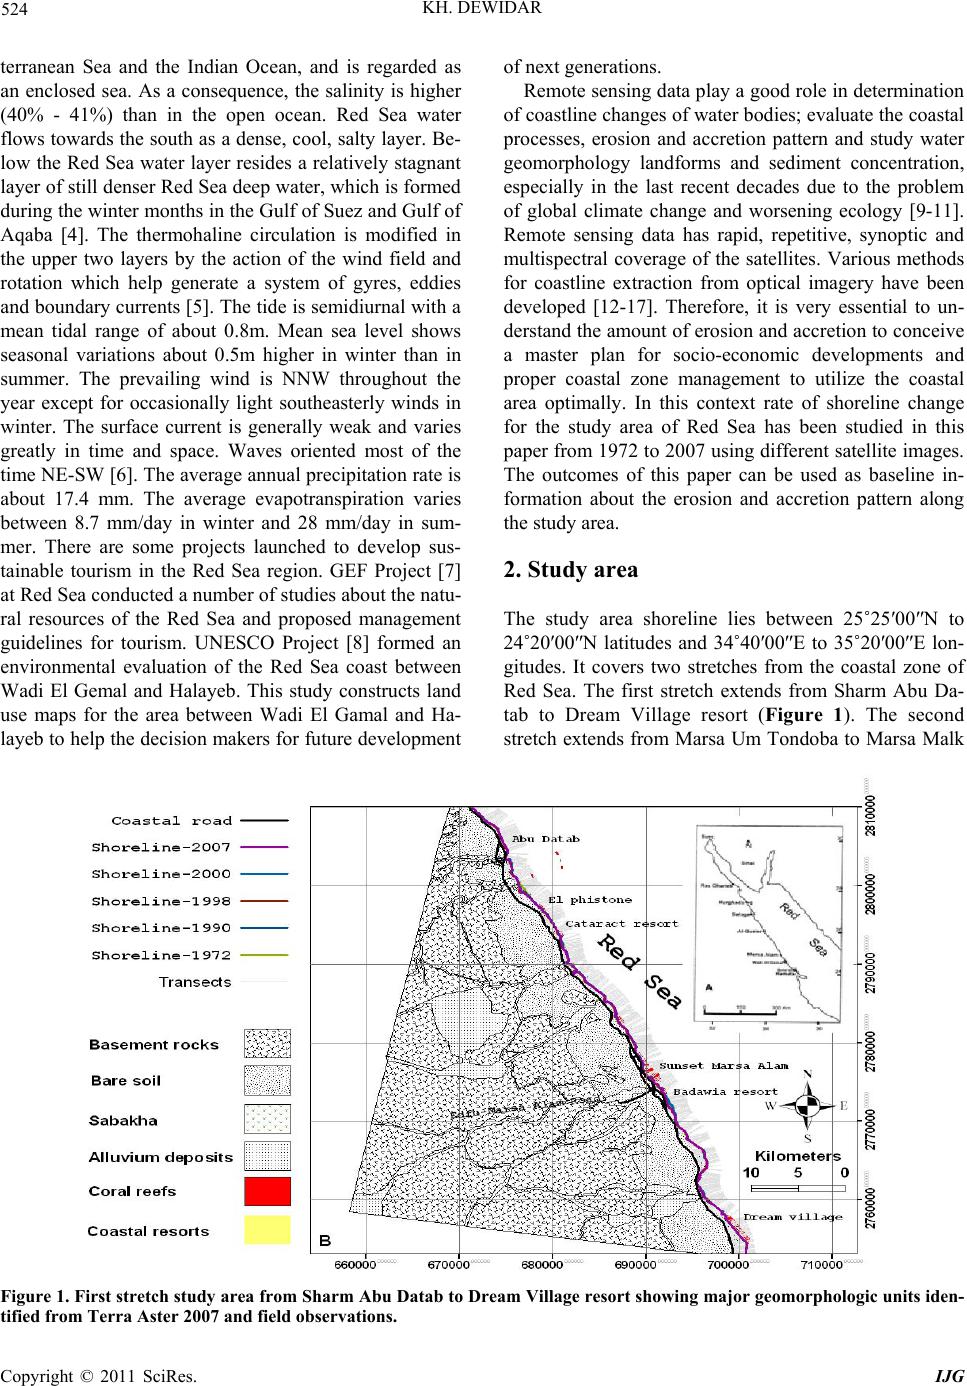 KH. DEWIDAR 524 terranean Sea and the Indian Ocean, and is regarded as an enclosed sea. As a consequence, the salinity is higher (40% - 41%) than in the open ocean. Red Sea water flows towards the south as a dense, cool, salty layer. Be- low the Red Sea water layer resides a relatively stagnant layer of still denser Red Sea deep water, which is formed during the winter months in the Gulf of Suez and Gulf of Aqaba [4]. The thermohaline circulation is modified in the upper two layers by the action of the wind field and rotation which help generate a system of gyres, eddies and boundary currents [5]. The tide is semidiurnal with a mean tidal range of about 0.8m. Mean sea level shows seasonal variations about 0.5m higher in winter than in summer. The prevailing wind is NNW throughout the year except for occasionally light southeasterly winds in winter. The surface current is generally weak and varies greatly in time and space. Waves oriented most of the time NE-SW [6]. The average annual precipitation rate is about 17.4 mm. The average evapotranspiration varies between 8.7 mm/day in winter and 28 mm/day in sum- mer. There are some projects launched to develop sus- tainable tourism in the Red Sea region. GEF Project [7] at Red Sea conducted a number of studies about the natu- ral resources of the Red Sea and proposed management guidelines for tourism. UNESCO Project [8] formed an environmental evaluation of the Red Sea coast between Wadi El Gemal and Halayeb. This study constructs land use maps for the area between Wadi El Gamal and Ha- layeb to help the decision makers for future development of next generations. Remote sensing data play a good role in determination of coastline changes of water bodies; evaluate the coastal processes, erosion and accretion pattern and study water geomorphology landforms and sediment concentration, especially in the last recent decades due to the problem of global climate change and worsening ecology [9-11]. Remote sensing data has rapid, repetitive, synoptic and multispectral coverage of the satellites. Various methods for coastline extraction from optical imagery have been developed [12-17]. Therefore, it is very essential to un- derstand the amount of erosion and accretion to conceive a master plan for socio-economic developments and proper coastal zone management to utilize the coastal area optimally. In this context rate of shoreline change for the study area of Red Sea has been studied in this paper from 1972 to 2007 using different satellite images. The outcomes of this paper can be used as baseline in- formation about the erosion and accretion pattern along the study area. 2. Study area The study area shoreline lies between 25˚25′00″N to 24˚20′00″N latitudes and 34˚40′00″E to 35˚20′00″E lon- gitudes. It covers two stretches from the coastal zone of Red Sea. The first stretch extends from Sharm Abu Da- tab to Dream Village resort (Figure 1). The second stretch extends from Marsa Um Tondoba to Marsa Malk Figure 1. First stretch study area from Sharm Abu Datab to Dream Village resort showing major geomorphologic units iden- ified from Terra Aster 2007 and field observations. t Copyright © 2011 SciRes. IJG 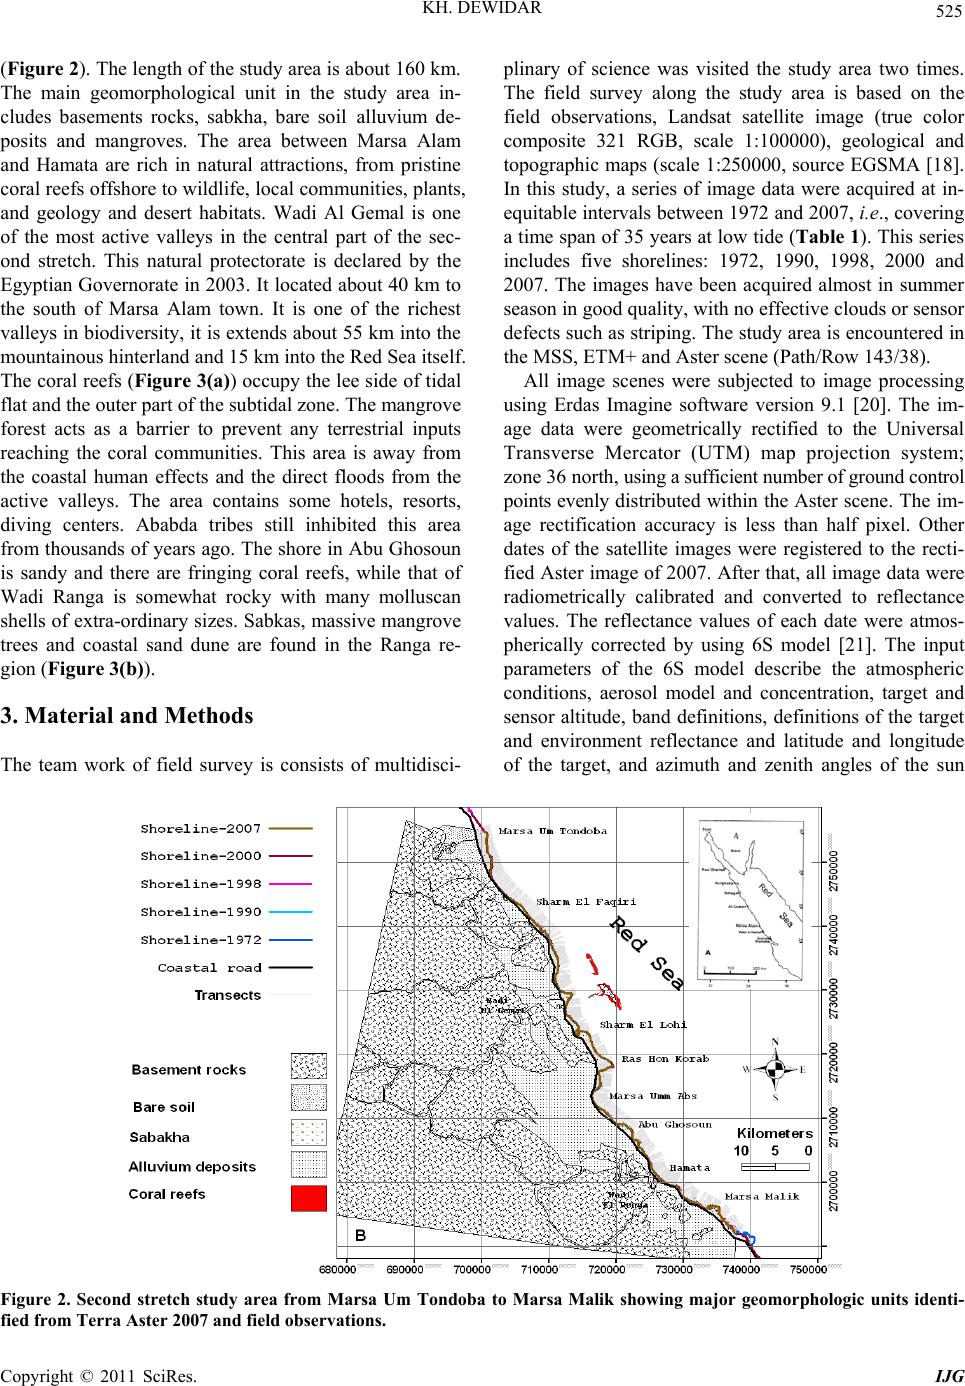 525 KH. DEWIDAR (Figure 2). The length of the study area is about 160 km. The main geomorphological unit in the study area in- cludes basements rocks, sabkha, bare soil alluvium de- posits and mangroves. The area between Marsa Alam and Hamata are rich in natural attractions, from pristine coral reefs offshore to wildlife, local communities, plants, and geology and desert habitats. Wadi Al Gemal is one of the most active valleys in the central part of the sec- ond stretch. This natural protectorate is declared by the Egyptian Governorate in 2003. It located about 40 km to the south of Marsa Alam town. It is one of the richest valleys in biodiversity, it is extends about 55 km into the mountainous hinterland and 15 km into the Red Sea itself. The coral reefs (Figure 3(a)) occupy the lee side of tidal flat and the outer part of the subtidal zone. The mangrove forest acts as a barrier to prevent any terrestrial inputs reaching the coral communities. This area is away from the coastal human effects and the direct floods from the active valleys. The area contains some hotels, resorts, diving centers. Ababda tribes still inhibited this area from thousands of years ago. The shore in Abu Ghosoun is sandy and there are fringing coral reefs, while that of Wadi Ranga is somewhat rocky with many molluscan shells of extra-ordinary sizes. Sabkas, massive mangrove trees and coastal sand dune are found in the Ranga re- gion (Figure 3(b)). 3. Material and Methods The team work of field survey is consists of multidisci- plinary of science was visited the study area two times. The field survey along the study area is based on the field observations, Landsat satellite image (true color composite 321 RGB, scale 1:100000), geological and topographic maps (scale 1:250000, source EGSMA [18]. In this study, a series of image data were acquired at in- equitable intervals between 1972 and 2007, i.e., covering a time span of 35 years at low tide (Table 1). This series includes five shorelines: 1972, 1990, 1998, 2000 and 2007. The images have been acquired almost in summer season in good quality, with no effective clouds or sensor defects such as striping. The study area is encountered in the MSS, ETM+ and Aster scene (Path/Row 143/38). All image scenes were subjected to image processing using Erdas Imagine software version 9.1 [20]. The im- age data were geometrically rectified to the Universal Transverse Mercator (UTM) map projection system; zone 36 north, using a sufficient number of ground control points evenly distributed within the Aster scene. The im- age rectification accuracy is less than half pixel. Other dates of the satellite images were registered to the recti- fied Aster image of 2007. After that, all image data were radiometrically calibrated and converted to reflectance values. The reflectance values of each date were atmos- pherically corrected by using 6S model [21]. The input parameters of the 6S model describe the atmospheric conditions, aerosol model and concentration, target and sensor altitude, band definitions, definitions of the target and environment reflectance and latitude and longitude of the target, and azimuth and zenith angles of the sun Figure 2. Second stretch study area from Marsa Um Tondoba to Marsa Malik showing major geomorphologic units identi- fied from Terra Aster 2007 and field observations. Copyright © 2011 SciRes. IJG 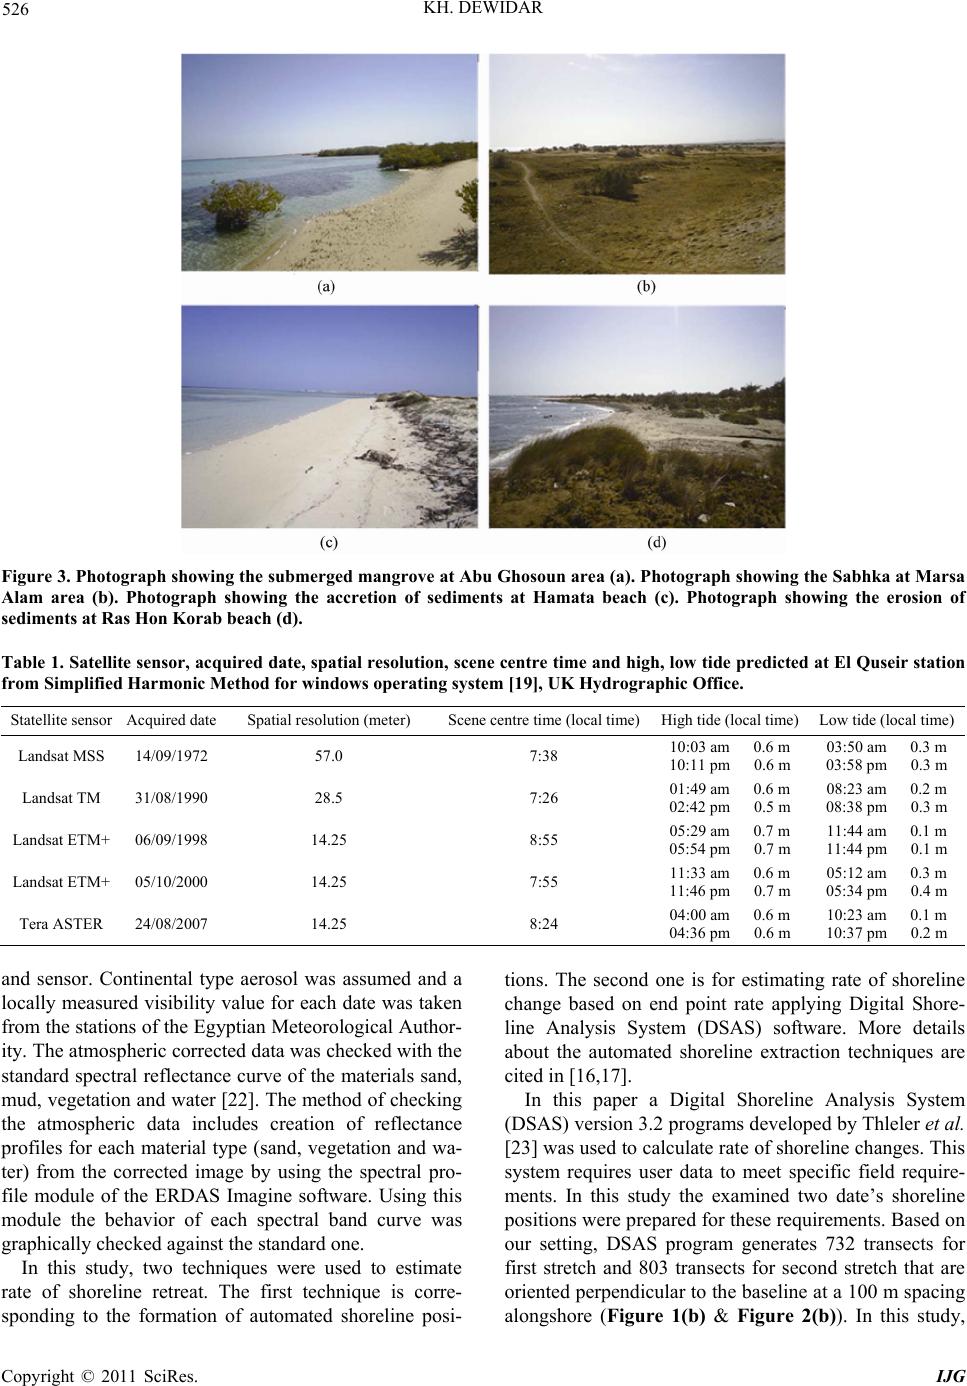 KH. DEWIDAR 526 Figure 3. Photograph showing the submerge d mangrove at Abu Ghosoun area (a). Photograph showing the Sabhka at Marsa Alam area (b). Photograph showing the accretion of sediments at Hamata beach (c). Photograph showing the erosion of sediments at Ras Hon Korab beach (d). Table 1. Satellite sensor, acquired date, spatial resolution, scene centre time and high, low tide predicted at El Quseir station from Simplified Harmonic Method for windows operating system [19], UK Hydrographic Office. Statellite sensor Acquired date Spatial resolution (meter) Scene centre time (local time)High tide (local time) Low tide (local time) Landsat MSS 14/09/1972 57.0 7:38 10:03 am 0.6 m 10:11 pm 0.6 m 03:50 am 0.3 m 03:58 pm 0.3 m Landsat TM 31/08/1990 28.5 7:26 01:49 am 0.6 m 02:42 pm 0.5 m 08:23 am 0.2 m 08:38 pm 0.3 m Landsat ETM+ 06/09/1998 14.25 8:55 05:29 am 0.7 m 05:54 pm 0.7 m 11:44 am 0.1 m 11:44 pm 0.1 m Landsat ETM+ 05/10/2000 14.25 7:55 11:33 am 0.6 m 11:46 pm 0.7 m 05:12 am 0.3 m 05:34 pm 0.4 m Tera ASTER 24/08/2007 14.25 8:24 04:00 am 0.6 m 04:36 pm 0.6 m 10:23 am 0.1 m 10:37 pm 0.2 m and sensor. Continental type aerosol was assumed and a locally measured visibility value for each date was taken from the stations of the Egyptian Meteorological Author- ity. The atmospheric corrected data was checked with the standard spectral reflectance curve of the materials sand, mud, vegetation and water [22]. The method of checking the atmospheric data includes creation of reflectance profiles for each material type (sand, vegetation and wa- ter) from the corrected image by using the spectral pro- file module of the ERDAS Imagine software. Using this module the behavior of each spectral band curve was graphically checked against the standard one. In this study, two techniques were used to estimate rate of shoreline retreat. The first technique is corre- sponding to the formation of automated shoreline posi- tions. The second one is for estimating rate of shoreline change based on end point rate applying Digital Shore- line Analysis System (DSAS) software. More details about the automated shoreline extraction techniques are cited in [16,17]. In this paper a Digital Shoreline Analysis System (DSAS) version 3.2 programs developed by Thleler et al. [23] was used to calculate rate of shoreline changes. This system requires user data to meet specific field require- ments. In this study the examined two date’s shoreline positions were prepared for these requirements. Based on our setting, DSAS program generates 732 transects for first stretch and 803 transects for second stretch that are oriented perpendicular to the baseline at a 100 m spacing alongshore (Figure 1(b) & Figure 2(b)). In this study, Copyright © 2011 SciRes. IJG  527 KH. DEWIDAR the End Point Rate (EPR) was calculated by dividing the distance of shoreline movement by the time elapsed between the earliest and latest measurements at each transect. These transects span the entire study coastline from Sharm Abu Datab to Sharm Marsa Malik (~160 km length). To assess the spatial and temporal migration trend of shoreline positions a hypothetical baseline was created from north to south parallel to the present-day coastline geometry with a position of approximately 2.5 km distance behind. The measured distance between the fixed baseline point and the shoreline positions generated by the program provides a reliable record monitoring the changes of shoreline positions from 1972-1990 and from 1990-2007 at each coastline stretch. This time intervals (~18 years) was found reasonable to represent the magnitude of shoreline changes along the study area 4. Results and Discussions Change in shoreline positions were determined by estab- lishing a 732 transects for first stretch and 803 transects for second stretch that are oriented perpendicular to the baseline at 100 m spacing alongshore by using DSAS software. The estimated rates of erosion and accretion along the study area have shown alongshore pattern changes during the examined time intervals (1972-1990 and 1990-2007). Alongshore pattern along the first stretch from Abu Datab was changes from accretion to erosion pattern with rate ranged from 5.5 m to –2.5 m/yr (Figure 4(a)). The alongshore accretion pattern between El Phistone resort to Sunset Marsa Alam resort is com- pletely transformed to erosion pattern during the second period of time (1990-2007). The alongshore erosion and accretion pattern was still vulnerable between the Sunset Marsa Alam and Dream village (Figure 4(a)). These changes may be attributed to climate changes and coastal processes with the sea at or near its present level, and there will be additional responses to relative sea level changes. Eric, [24] conducted that the changes in coastal wind regimes may increase sand blown from hinterland dunes to beaches, or modify incident wave regimes to increase Figure 4. Alongshore pattern along the first stretch (a) and the second stretch (b) in UTM map projection (meters). Copyright © 2011 SciRes. IJG 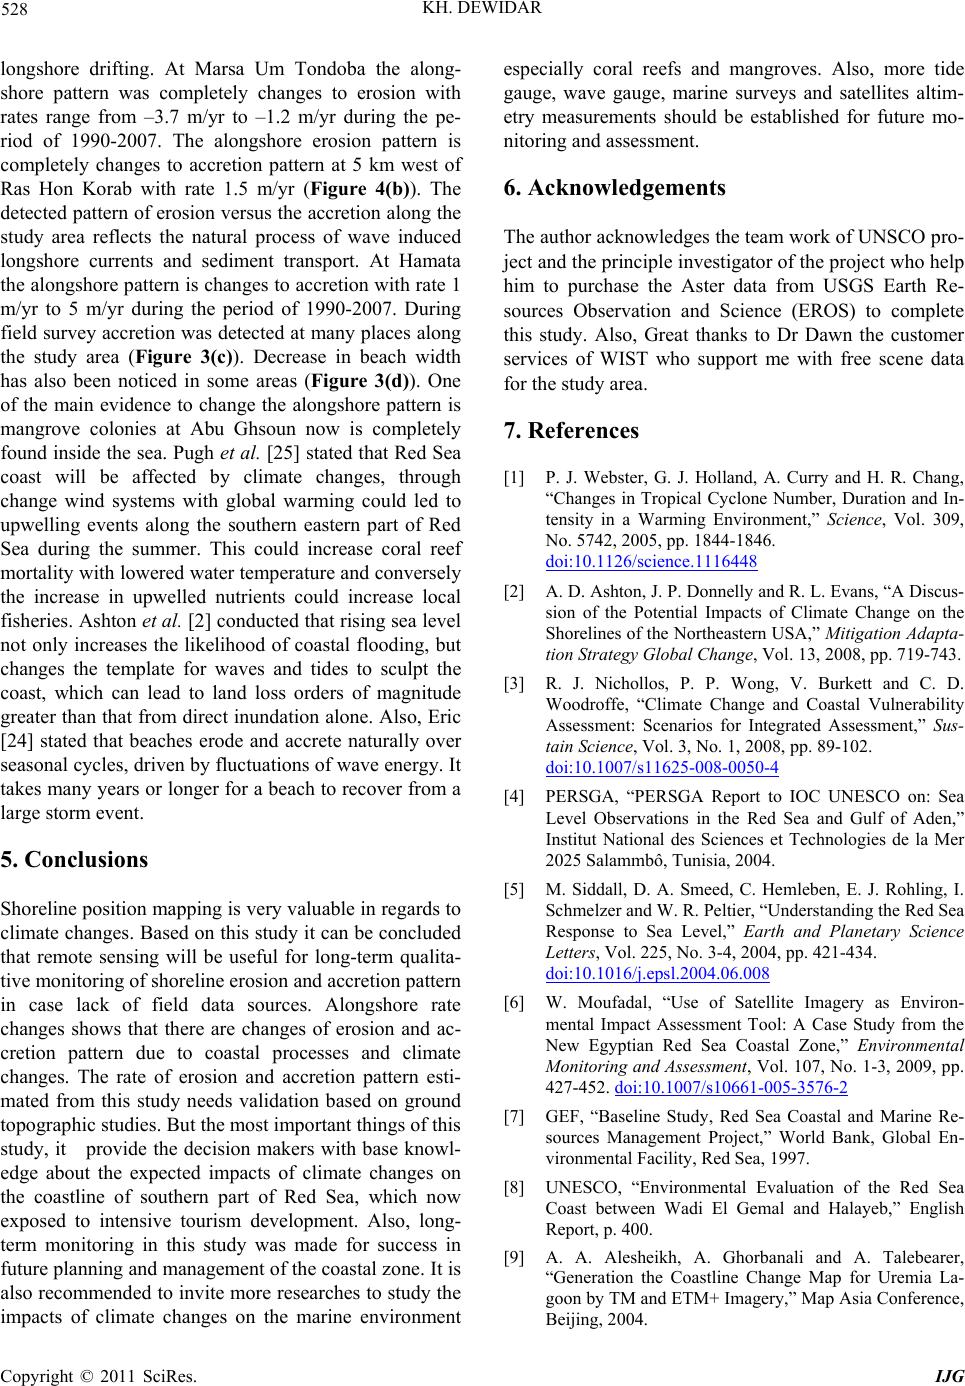 KH. DEWIDAR 528 longshore drifting. At Marsa Um Tondoba the along- shore pattern was completely changes to erosion with rates range from –3.7 m/yr to –1.2 m/yr during the pe- riod of 1990-2007. The alongshore erosion pattern is completely changes to accretion pattern at 5 km west of Ras Hon Korab with rate 1.5 m/yr (Figure 4(b)). The detected pattern of erosion versus the accretion along the study area reflects the natural process of wave induced longshore currents and sediment transport. At Hamata the alongshore pattern is changes to accretion with rate 1 m/yr to 5 m/yr during the period of 1990-2007. During field survey accretion was detected at many places along the study area (Figure 3(c)). Decrease in beach width has also been noticed in some areas (Figure 3(d)). One of the main evidence to change the alongshore pattern is mangrove colonies at Abu Ghsoun now is completely found inside the sea. Pugh et al. [25] stated that Red Sea coast will be affected by climate changes, through change wind systems with global warming could led to upwelling events along the southern eastern part of Red Sea during the summer. This could increase coral reef mortality with lowered water temperature and conversely the increase in upwelled nutrients could increase local fisheries. Ashton et al. [2] conducted that rising sea level not only increases the likelihood of coastal flooding, but changes the template for waves and tides to sculpt the coast, which can lead to land loss orders of magnitude greater than that from direct inundation alone. Also, Eric [24] stated that beaches erode and accrete naturally over seasonal cycles, driven by fluctuations of wave energy. It takes many years or longer for a beach to recover from a large storm event. 5. Conclusions Shoreline position mapping is very valuable in regards to climate changes. Based on this study it can be concluded that remote sensing will be useful for long-term qualita- tive monitoring of shoreline erosion and accretion pattern in case lack of field data sources. Alongshore rate changes shows that there are changes of erosion and ac- cretion pattern due to coastal processes and climate changes. The rate of erosion and accretion pattern esti- mated from this study needs validation based on ground topographic studies. But the most important things of this study, it provide the decision makers with base knowl- edge about the expected impacts of climate changes on the coastline of southern part of Red Sea, which now exposed to intensive tourism development. Also, long- term monitoring in this study was made for success in future planning and management of the coastal zone. It is also recommended to invite more researches to study the impacts of climate changes on the marine environment especially coral reefs and mangroves. Also, more tide gauge, wave gauge, marine surveys and satellites altim- etry measurements should be established for future mo- nitoring and assessment. 6. Acknowledgements The author acknowledges the team work of UNSCO pro- ject and the principle investigator of the project who help him to purchase the Aster data from USGS Earth Re- sources Observation and Science (EROS) to complete this study. Also, Great thanks to Dr Dawn the customer services of WIST who support me with free scene data for the study area. 7. References [1] P. J. Webster, G. J. Holland, A. Curry and H. R. Chang, “Changes in Tropical Cyclone Number, Duration and In- tensity in a Warming Environment,” Science, Vol. 309, No. 5742, 2005, pp. 1844-1846. doi:10.1126/science.1116448 [2] A. D. Ashton, J. P. Donnelly and R. L. Evans, “A Discus- sion of the Potential Impacts of Climate Change on the Shorelines of the Northeastern USA,” Mitigation Adapta- tion Strategy Global Change, Vol. 13, 2008, pp. 719-743. [3] R. J. Nichollos, P. P. Wong, V. Burkett and C. D. Woodroffe, “Climate Change and Coastal Vulnerability Assessment: Scenarios for Integrated Assessment,” Sus- tain Science, Vol. 3, No. 1, 2008, pp. 89-102. doi:10.1007/s11625-008-0050-4 [4] PERSGA, “PERSGA Report to IOC UNESCO on: Sea Level Observations in the Red Sea and Gulf of Aden,” Institut National des Sciences et Technologies de la Mer 2025 Salammbô, Tunisia, 2004. [5] M. Siddall, D. A. Smeed, C. Hemleben, E. J. Rohling, I. Schmelzer and W. R. Peltier, “Understanding the Red Sea Response to Sea Level,” Earth and Planetary Science Letters, Vol. 225, No. 3-4, 2004, pp. 421-434. doi:10.1016/j.epsl.2004.06.008 [6] W. Moufadal, “Use of Satellite Imagery as Environ- mental Impact Assessment Tool: A Case Study from the New Egyptian Red Sea Coastal Zone,” Environmental Monitoring and Assessment, Vol. 107, No. 1-3, 2009, pp. 427-452. doi:10.1007/s10661-005-3576-2 [7] GEF, “Baseline Study, Red Sea Coastal and Marine Re- sources Management Project,” World Bank, Global En- vironmental Facility, Red Sea, 1997. [8] UNESCO, “Environmental Evaluation of the Red Sea Coast between Wadi El Gemal and Halayeb,” English Report, p. 400. [9] A. A. Alesheikh, A. Ghorbanali and A. Talebearer, “Generation the Coastline Change Map for Uremia La- goon by TM and ETM+ Imagery,” Map Asia Conference, Beijing, 2004. Copyright © 2011 SciRes. IJG  529 KH. DEWIDAR [10] S. S. Durduran, “Coastline Change Assessment on Water Reservoirs Located in the Konya Basin Area, Turky, Us- ing Multitemporal Landsat Imagery,” Environmental Monitoring Assessment, Vol. 164, No. 1-4, 2010, pp. 453- 461. doi:10.1007/s10661-009-0906-9 [11] E. Sener, A. Davraz and S. Sener, “Investigation of Ak- sehir and Eber Lakes (SW Turky) Coastline Change with Multitemporal Satellite Images,” Water Resources Man- agement, Vol. 24, No. 4, 2010, pp. 727-745. doi:10.1007/s11269-009-9467-5 [12] J. Bosworth, T. Koshimizu and S. T. Acton, “Multi- Resolution Segmentation of Soil Moisture Imagery by Watershed Pyramids with Region Growing Merging,” International Journal of Remote Sensing, Vol. 24, No. 4, 2003, pp. 741-760. doi:10.1080/01431160110114989 [13] K. Di, J. Wang, R. Ma and R. Li, “Automated Shoreline Extraction from High Resolution IKONOS Satellite Im- agery,” Proceedings of the ASPRS 2003 Annual Confer- ence, Anchorage, May 2003. [14] G. M. Foody, A. M. Muslim and P. M. Atkinson, “Super- resolution Mapping of the Waterline from Remotely Sensed Data,” International Journal of Remote Sensing, Vol. 26, No. 24, 2005, pp. 5381-5392. doi:10.1080/01431160500213292 [15] J. Lira, “Segmentation and Morphology of Open Water Bodies from Multispectral Images,” International Jour- nal of Remote Sensing, Vol. 27, No. 18, 2006, pp. 4015- 4038. doi:10.1080/01431160600702384 [16] Kh. Dewidar and O. E. Frihy, “Pre-and Post-Beach Re- sponse to Engineering Hard Structures Using Landsat Time-Series at the Northwestern Part of the Nile Delta, Egypt,” Journal of Coastal Conservation, Vol. 11, No. 2, 2008, pp. 133-142. doi:10.1007/s11852-008-0013-z [17] Kh. Dewidar and O. E. Frihy, “Automated Techniques for Quantification of beach Change Rates Using Landsat Series along the Northeastern Nile Delta, Egypt,” Journal of Oceanography and Marine Science, Vol. 1, 2010, pp. 28-39. [18] EGSMA, “Egyptian Geological Survey and Mining Au- thority,” Cairo, 1997. [19] UK Hydrographic Office, “Simplified Harmonic Method for Windows Operating System,” 2001. [20] Earth Resources Data Analysis System, “Leica Geosys- tems Geospatial Imaging,” LLC, 5051 Peachtree Corners Circle, Suite 100, Norcross, 2003. [21] F. E. Vermote, D. Tanre, J. L. Deuze, M. Herman and M. J. Morcrette, “Second Simulation of the Satellite Signal in the Solar Spectrum, 6S: An Overview,” IEEE Transac- tions on Geosciences and Remote Sensing, Vol. 35, No. 3, 1997, pp. 675-686. doi:10.1109/36.581987 [22] T. M. Lillesand, R. W. Kiefer and J. W. Chipman, “Re- mote Sensing and Image Interpretation,” Wiley, Hoboken, 2008. [23] E. R. Thieler, E. A. Himmelstoss, J. L. Zichichi and, T. L. Miller, “Digital Shoreline Analysis System (DSAS) Ver- sion 3.0: An ARCGIS Extension for Calculating Shore- line Change,” US Geological Survey Open-File Report 2005-1304, 2005. [24] B. Eric, “Coastal Geomorphology an Introduction,” 2nd Edition, John Wiley & Sons Ltd, Chichester, 2008. [25] D. T. Pugh, D. J. Dixon and P. L. Woodworth, “Marine Impacts of Potential Climate Change,” Journal of Marine Science, Vol. 12, 2001, pp. 3-11. Copyright © 2011 SciRes. IJG |