

Paper Menu >>
Journal Menu >>
 Vol.2, No.4, 443-450 (2011) doi:10.4236/as.2011.24057 C opyright © 2011 SciRes. Openly accessible at http://www.scirp.org/journal/AS/ Agricultural Scienc es Chemical properties of wild coffee forest soils in Ethiopia and management implications Taye Kufa Ethiopian Institute of Agricultural Research, Jimma Research Center, Jimma, Ethiopia; [email protected] Received 7 September 2011; revised 19 October 2011; accepted 27 October 2011. ABSTRACT The study aims at determining the status of soil chemical fertility in four wild coffee forests of southeast ern and southw estern Eth iopia. Acc ord- ingly, soil samples were collected from surface and subsurface depths at three sites w ithin each forest and analy zed for soil chemical properties. The results depicted that the soils at the four coffee forests did not reveal significant varia- tions for most parameters, except Mg, CEC and C:N ratio. Significant variations w ere determined between the surface and sub-surface soils of the four studied forests, partly indicating the impacts of anthropogenic factors on vegetation cover and soil fertility status along profile depth. At Harenn a, surfa ce so il had si gnifica ntly hi gher total nitrogen and organic matter than sub-surface soil. The decline in available phosphorus with soil depth was also significant at the Harenna and Yayu forests. Most soil results were com- parable and showed inter- an d in tra -fo rest varia- tions, demonstrating the contributions of vege- tation cover and climate gradients. The study revealed the declined soil quality parameters with increased depth, demonstrating the vul- nerability of forest soils to human-induced dis- turbances of natural habitats and land degrada- tion, coupled with climate changes. Overall, the results underline the need for a multi-site forest conservation and promote productivity of high quality coffee standards. This demands urgent supports for implementing community-oriented management and incentive options towards main- taining environmental sustainability and coffee genetic resources for global benefits. Keywords: Carbon Sequestration; Coffee Forest Environments; Profile Depth; Soil Fertility; Wild Coffee Genetic Resourc es 1. INTRODUCTION The montane rainforest areas in Ethiopia are the only known center of origin and genetic diversity for the highland arabica coffee (Coffea arabica L). In its origi- nal forest habitat, arabica coffee occurs in the multi- strata of forest ecosystems and thus it is a shade-loving plant. Since time immemorial, coffee has been grown in the humid montane rainforests of southwestern Ethiopia [1,2]. As to its adaptation, coffee grows in wide ecology and it does not appear to have very specific soil re- quirements. In fact, it performs just as well in the clay- silcaceous soils of granite as it does on soils of volcanic origin with diverse characteristics or even on alluvial soils [3,4]. Water-logging can reduce yield by a substan- tial amount and kill trees if it is prolonged. Texture and depth of the soil are, therefore, extremely important fac- tors. Coffee tree is capable of extending its root system considerably. It requires an effective depth of greater than 150 cm. This characteristic enables it to exploit a considerable volume of land and to thus offset a relative lack of fertility. Highly suitable areas had high soil or- ganic matter (SOM > 3%) content. With regard to soil pH, a slightly acid soil is preferred. The best conditions are between pH 5.3 and 6.5. However, there are also highly productive coffee plantations on soils that are nearly neutral (pH = 7.0) [1,4]. Nitrogen is the most im- portant single element affecting the growth of roots. However, shoots lack nitrate reductase and thus cannot utilize nitrate. Phosphorus is an important element in shoot growth and leaf initiation. Thus, when shoot growth is more needed than root growth, phosphatic fertilizers should be applied to encourage faster growth of suckers [3,5]. In Ethiopia, the natural coffee forest areas, which have conserved the sustainable ecology and Coffea arabica gene pools, are now seriously threatened by several fac- tors. These include, among others, increasing population pressure, expansion of farmlands, forest land-use con- flicts, priority for other food and cash crops and other socio-economic factors [6-9]. There are still natural cof- 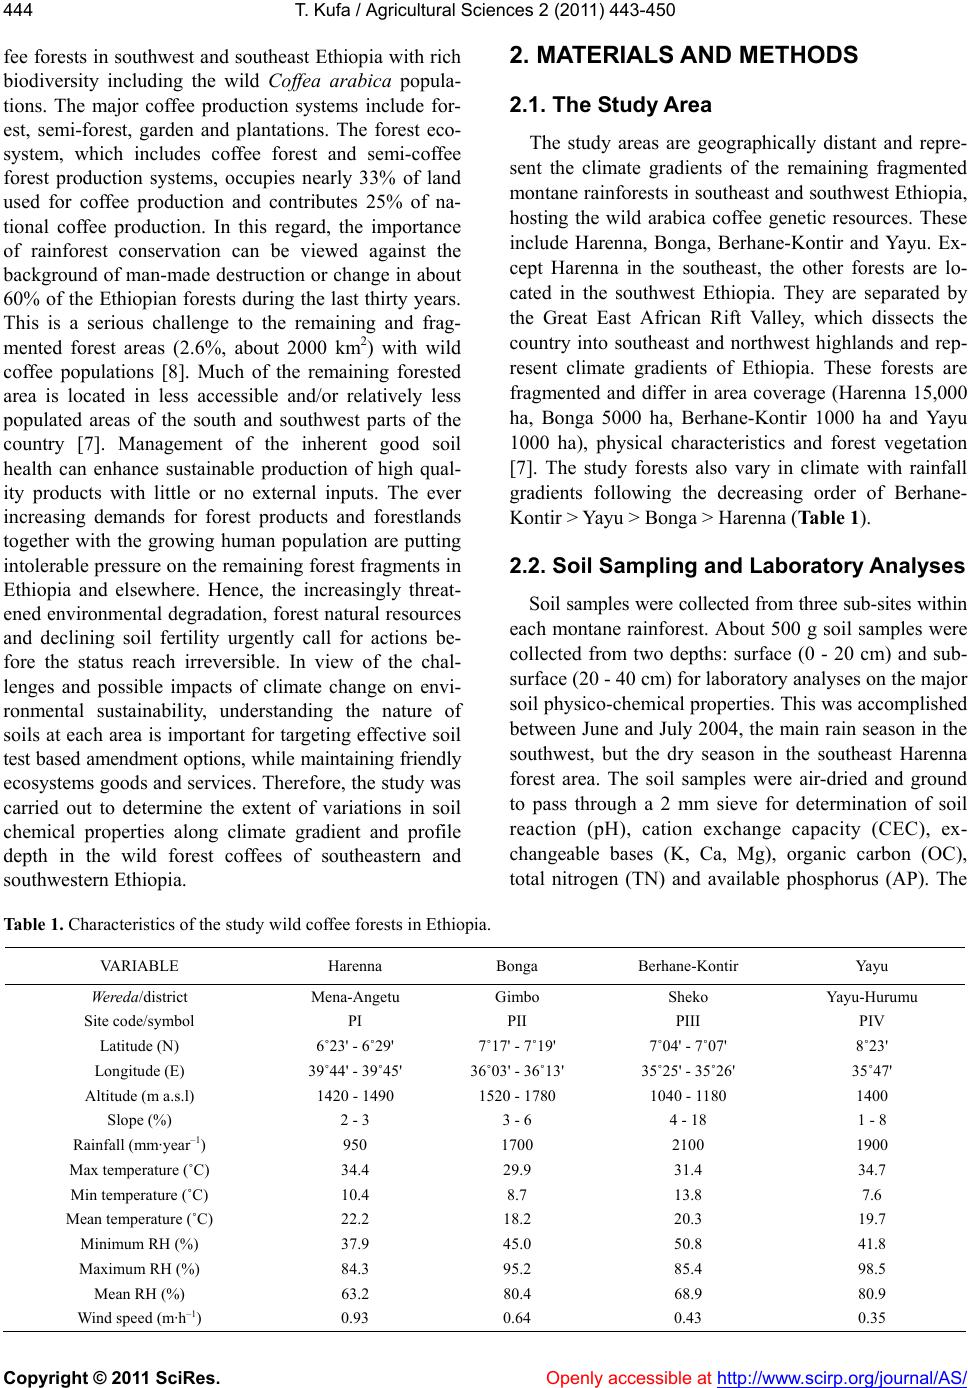 T. Kufa / Agricultural Sciences 2 (2011) 443-450 Copyright © 2011 SciRes. Openly accessible at http://www.scirp.org/journal/AS/ 444 fee forests in southwest and southeast Ethiopia with rich biodiversity including the wild Coffea arabica popula- tions. The major coffee production systems include for- est, semi-forest, garden and plantations. The forest eco- system, which includes coffee forest and semi-coffee forest production systems, occupies nearly 33% of land used for coffee production and contributes 25% of na- tional coffee production. In this regard, the importance of rainforest conservation can be viewed against the background of man-made destruction or change in about 60% of the Ethiopian forests during the last thirty years. This is a serious challenge to the remaining and frag- mented forest areas (2.6%, about 2000 km2) with wild coffee populations [8]. Much of the remaining forested area is located in less accessible and/or relatively less populated areas of the south and southwest parts of the country [7]. Management of the inherent good soil health can enhance sustainable production of high qual- ity products with little or no external inputs. The ever increasing demands for forest products and forestlands together with the growing human population are putting intolerable pressure on the remaining forest fragments in Ethiopia and elsewhere. Hence, the increasingly threat- ened environmental degradation, forest natural resources and declining soil fertility urgently call for actions be- fore the status reach irreversible. In view of the chal- lenges and possible impacts of climate change on envi- ronmental sustainability, understanding the nature of soils at each area is important for targeting effective soil test based amendment options, while maintaining friendly ecosystems goods and services. Therefore, the study was carried out to determine the extent of variations in soil chemical properties along climate gradient and profile depth in the wild forest coffees of southeastern and southwestern Ethiopia. 2. MATERIALS AND METHODS 2.1. The Study Area The study areas are geographically distant and repre- sent the climate gradients of the remaining fragmented montane rainforests in southeast and southwest Ethiopia, hosting the wild arabica coffee genetic resources. These include Harenna, Bonga, Berhane-Kontir and Yayu. Ex- cept Harenna in the southeast, the other forests are lo- cated in the southwest Ethiopia. They are separated by the Great East African Rift Valley, which dissects the country into southeast and northwest highlands and rep- resent climate gradients of Ethiopia. These forests are fragmented and differ in area coverage (Harenna 15,000 ha, Bonga 5000 ha, Berhane-Kontir 1000 ha and Yayu 1000 ha), physical characteristics and forest vegetation [7]. The study forests also vary in climate with rainfall gradients following the decreasing order of Berhane- Kontir > Yayu > Bonga > Harenna (Table 1). 2.2. Soil Sampling and Laboratory Analyses Soil samples were collected from three sub-sites within each montane rainforest. About 500 g soil samples were collected from two depths: surface (0 - 20 cm) and sub- surface (20 - 40 cm) for laboratory analyses on the major soil physico-chemical properties. This was accomplished between June and July 2004, the main rain season in the southwest, but the dry season in the southeast Harenna forest area. The soil samples were air-dried and ground to pass through a 2 mm sieve for determination of soil reaction (pH), cation exchange capacity (CEC), ex- changeable bases (K, Ca, Mg), organic carbon (OC), total nitrogen (TN) and available phosphorus (AP). The Table 1. Characteristics of the study wild coffee forests in Ethiopia. VARIABLE Harenna Bonga Berhane-Kontir Yayu Wer eda/district Mena-Angetu Gimbo Sheko Yayu-Hurumu Site code/symbol PI PII PIII PIV Latitude (N) 6˚23' - 6˚29' 7˚17' - 7˚19' 7˚04' - 7˚07' 8˚23' Longitude (E) 39˚44' - 39˚45' 36˚03' - 36˚13' 35˚25' - 35˚26' 35˚47' Altitude (m a.s.l) 1420 - 1490 1520 - 1780 1040 - 1180 1400 Slope (%) 2 - 3 3 - 6 4 - 18 1 - 8 Rainfall (mm·year–1) 950 1700 2100 1900 Max temperature (˚C) 34.4 29.9 31.4 34.7 Min temperature (˚C) 10.4 8.7 13.8 7.6 Mean temperature (˚C) 22.2 18.2 20.3 19.7 Minimum RH (%) 37.9 45.0 50.8 41.8 Maximum RH (%) 84.3 95.2 85.4 98.5 Mean RH (%) 63.2 80.4 68.9 80.9 Wind speed (m·h–1) 0.93 0.64 0.43 0.35 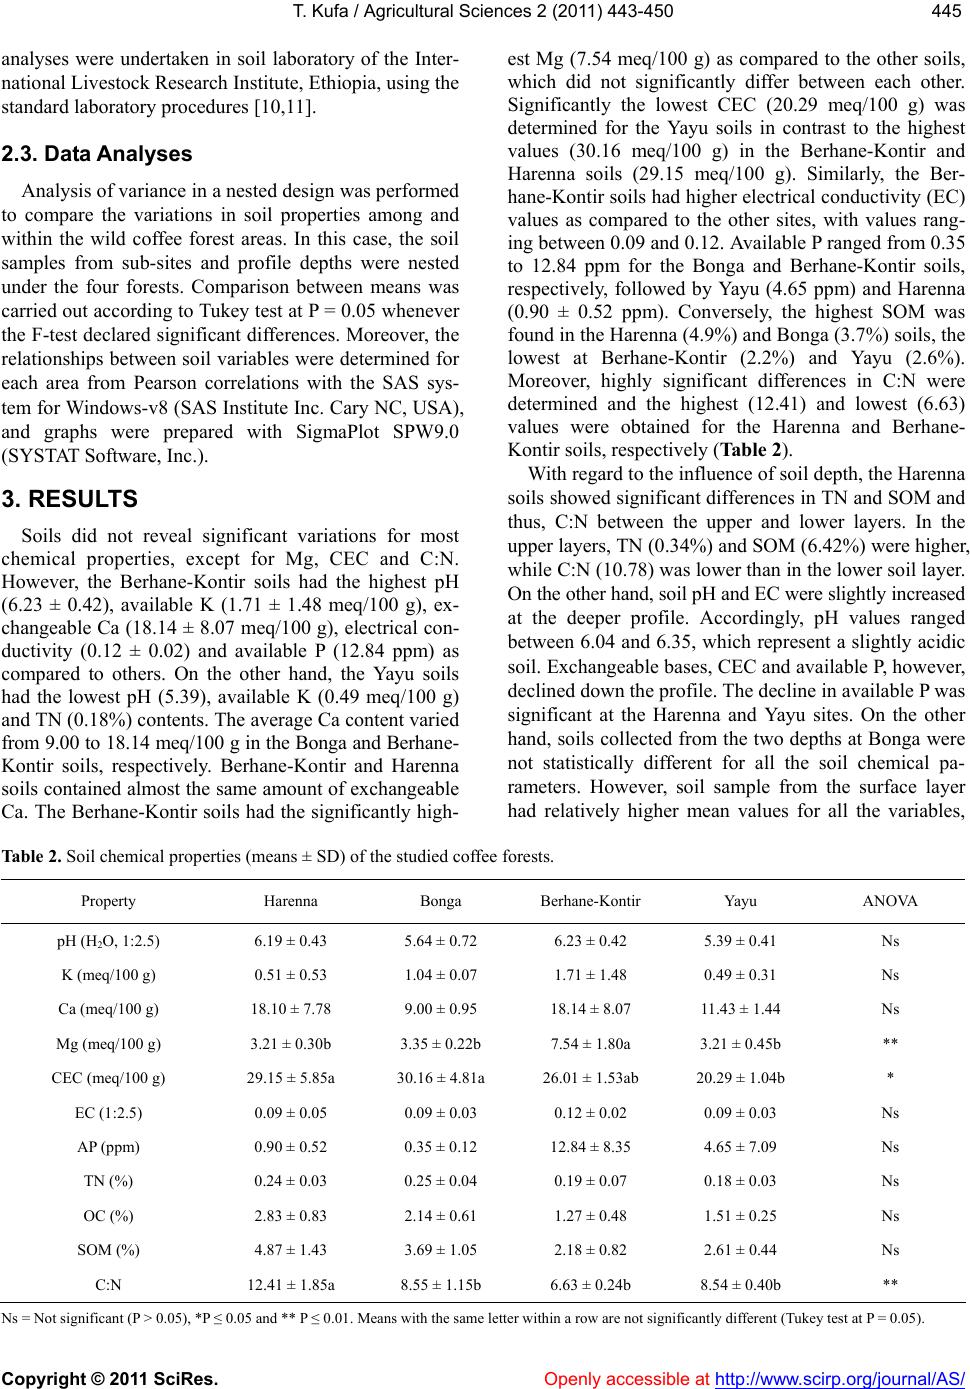 T. Kufa / Agricultural Sciences 2 (2011) 443-450 Copyright © 2011 SciRes. Openly accessible at http://www.scirp.org/journal/AS/ 445445 analyses were undertaken in soil laboratory of the Inter- national Livestock Research Institute, Ethiopia, using the standard laboratory procedures [10,11]. 2.3. Data Anal yses Analysis of variance in a nested design was performed to compare the variations in soil properties among and within the wild coffee forest areas. In this case, the soil samples from sub-sites and profile depths were nested under the four forests. Comparison between means was carried out according to Tukey test at P = 0.05 whenever the F-test declared significant differences. Moreover, the relationships between soil variables were determined for each area from Pearson correlations with the SAS sys- tem for Windows-v8 (SAS Institute Inc. Cary NC, USA), and graphs were prepared with SigmaPlot SPW9.0 (SYSTAT Software, Inc.). 3. RESULTS Soils did not reveal significant variations for most chemical properties, except for Mg, CEC and C:N. However, the Berhane-Kontir soils had the highest pH (6.23 ± 0.42), available K (1.71 ± 1.48 meq/100 g), ex- changeable Ca (18.14 ± 8.07 meq/100 g), electrical con- ductivity (0.12 ± 0.02) and available P (12.84 ppm) as compared to others. On the other hand, the Yayu soils had the lowest pH (5.39), available K (0.49 meq/100 g) and TN (0.18%) contents. The average Ca content varied from 9.00 to 18.14 meq/100 g in the Bonga and Berhane- Kontir soils, respectively. Berhane-Kontir and Harenna soils contained almost the same amount of exchangeable Ca. The Berhane-Kontir soils had the significantly high- est Mg (7.54 meq/100 g) as compared to the other soils, which did not significantly differ between each other. Significantly the lowest CEC (20.29 meq/100 g) was determined for the Yayu soils in contrast to the highest values (30.16 meq/100 g) in the Berhane-Kontir and Harenna soils (29.15 meq/100 g). Similarly, the Ber- hane-Kontir soils had higher electrical conductivity (EC) values as compared to the other sites, with values rang- ing between 0.09 and 0.12. Available P ranged from 0.35 to 12.84 ppm for the Bonga and Berhane-Kontir soils, respectively, followed by Yayu (4.65 ppm) and Harenna (0.90 ± 0.52 ppm). Conversely, the highest SOM was found in the Harenna (4.9%) and Bonga (3.7%) soils, the lowest at Berhane-Kontir (2.2%) and Yayu (2.6%). Moreover, highly significant differences in C:N were determined and the highest (12.41) and lowest (6.63) values were obtained for the Harenna and Berhane- Kontir soils, respectively (Table 2). With regard to the influence of soil depth, the Harenna soils showed significant differences in TN and SOM and thus, C:N between the upper and lower layers. In the upper layers, TN (0.34%) and SOM (6.42%) were higher, while C:N (10.78) was lower than in the lower soil layer. On the other hand, soil pH and EC were slightly increased at the deeper profile. Accordingly, pH values ranged between 6.04 and 6.35, which represent a slightly acidic soil. Exchangeable bases, CEC and available P, however, declined down the profile. The decline in available P was significant at the Harenna and Yayu sites. On the other hand, soils collected from the two depths at Bonga were not statistically different for all the soil chemical pa- rameters. However, soil sample from the surface layer had relatively higher mean values for all the variables, Table 2. Soil chemical properties (means ± SD) of the studied coffee forests. Property Harenna Bonga Berhane-Kontir Yayu ANOVA pH (H2O, 1:2.5) 6.19 ± 0.43 5.64 ± 0.72 6.23 ± 0.42 5.39 ± 0.41 Ns K (meq/100 g) 0.51 ± 0.53 1.04 ± 0.07 1.71 ± 1.48 0.49 ± 0.31 Ns Ca (meq/100 g) 18.10 ± 7.78 9.00 ± 0.95 18.14 ± 8.07 11.43 ± 1.44 Ns Mg (meq/100 g) 3.21 ± 0.30b 3.35 ± 0.22b 7.54 ± 1.80a 3.21 ± 0.45b ** CEC (meq/100 g) 29.15 ± 5.85a 30.16 ± 4.81a 26.01 ± 1.53ab 20.29 ± 1.04b * EC (1:2.5) 0.09 ± 0.05 0.09 ± 0.03 0.12 ± 0.02 0.09 ± 0.03 Ns AP (ppm) 0.90 ± 0.52 0.35 ± 0.12 12.84 ± 8.35 4.65 ± 7.09 Ns TN (%) 0.24 ± 0.03 0.25 ± 0.04 0.19 ± 0.07 0.18 ± 0.03 Ns OC (%) 2.83 ± 0.83 2.14 ± 0.61 1.27 ± 0.48 1.51 ± 0.25 Ns SOM (%) 4.87 ± 1.43 3.69 ± 1.05 2.18 ± 0.82 2.61 ± 0.44 Ns C:N 12.41 ± 1.85a 8.55 ± 1.15b 6.63 ± 0.24b 8.54 ± 0.40b ** Ns = Not significant (P > 0.05), *P ≤ 0.05 and ** P ≤ 0.01. Means with the same letter within a row are not significantly different (Tukey test at P = 0.05). 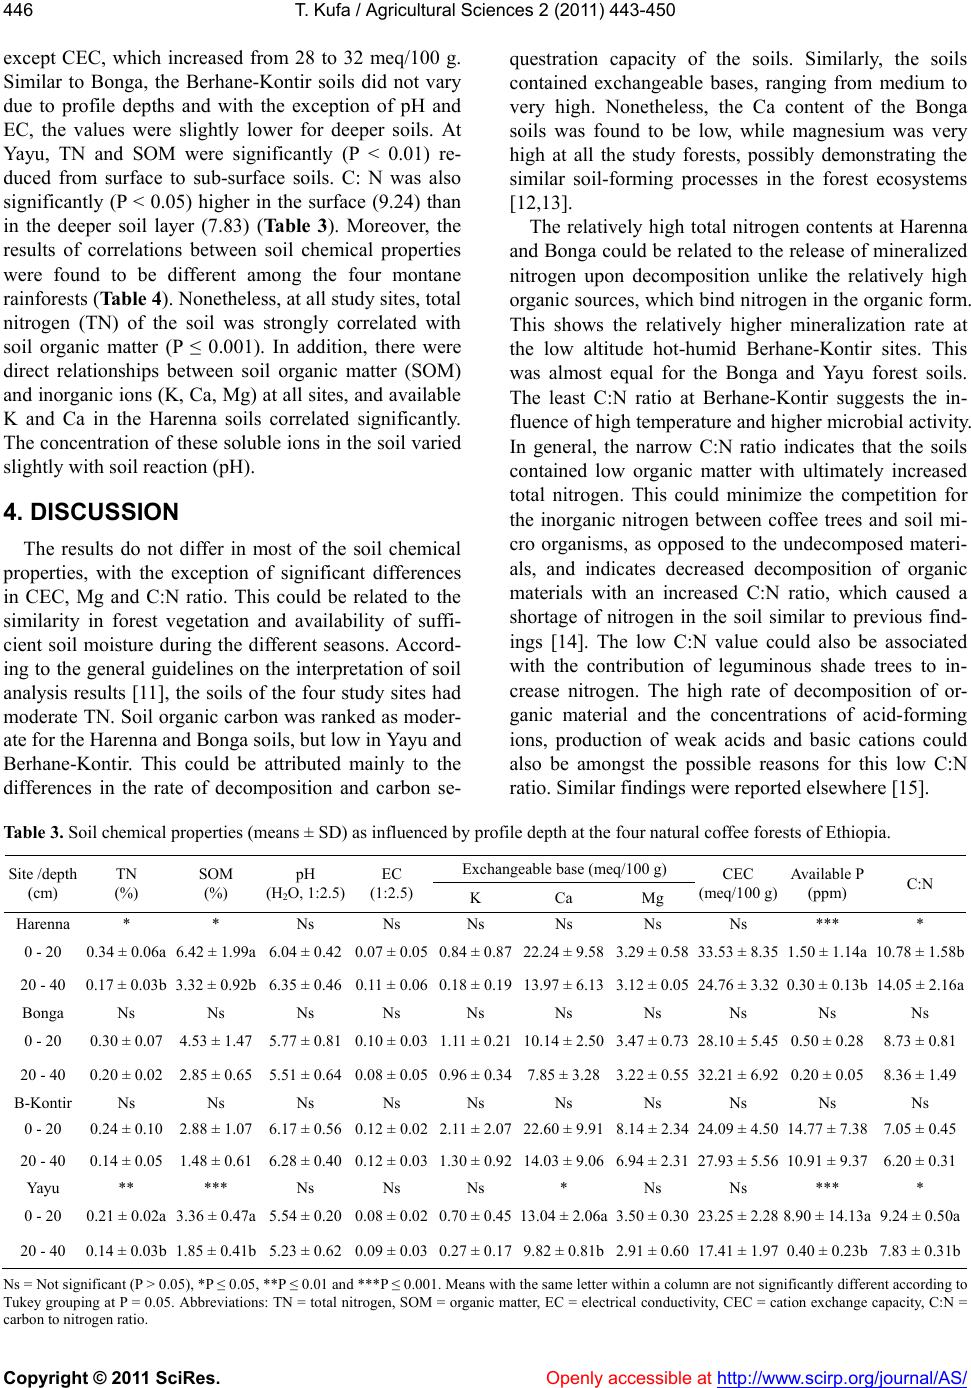 T. Kufa / Agricultural Sciences 2 (2011) 443-450 Copyright © 2011 SciRes. Openly accessible at http://www.scirp.org/journal/AS/ 446 except CEC, which increased from 28 to 32 meq/100 g. Similar to Bonga, the Berhane-Kontir soils did not vary due to profile depths and with the exception of pH and EC, the values were slightly lower for deeper soils. At Yayu, TN and SOM were significantly (P < 0.01) re- duced from surface to sub-surface soils. C: N was also significantly (P < 0.05) higher in the surface (9.24) than in the deeper soil layer (7.83) (Ta b l e 3 ). Moreover, the results of correlations between soil chemical properties were found to be different among the four montane rainforests (Table 4). Nonetheless, at all study sites, total nitrogen (TN) of the soil was strongly correlated with soil organic matter (P ≤ 0.001). In addition, there were direct relationships between soil organic matter (SOM) and inorganic ions (K, Ca, Mg) at all sites, and available K and Ca in the Harenna soils correlated significantly. The concentration of these soluble ions in the soil varied slightly with soil reaction (pH). 4. DISCUSSION The results do not differ in most of the soil chemical properties, with the exception of significant differences in CEC, Mg and C:N ratio. This could be related to the similarity in forest vegetation and availability of suffi- cient soil moisture during the different seasons. Accord- ing to the general guidelines on the interpretation of soil analysis results [11], the soils of the four study sites had moderate TN. Soil organic carbon was ranked as moder- ate for the Harenna and Bonga soils, but low in Yayu and Berhane-Kontir. This could be attributed mainly to the differences in the rate of decomposition and carbon se- questration capacity of the soils. Similarly, the soils contained exchangeable bases, ranging from medium to very high. Nonetheless, the Ca content of the Bonga soils was found to be low, while magnesium was very high at all the study forests, possibly demonstrating the similar soil-forming processes in the forest ecosystems [12,13]. The relatively high total nitrogen contents at Harenna and Bonga could be related to the release of mineralized nitrogen upon decomposition unlike the relatively high organic sources, which bind nitrogen in the organic form. This shows the relatively higher mineralization rate at the low altitude hot-humid Berhane-Kontir sites. This was almost equal for the Bonga and Yayu forest soils. The least C:N ratio at Berhane-Kontir suggests the in- fluence of high temperature and higher microbial activity. In general, the narrow C:N ratio indicates that the soils contained low organic matter with ultimately increased total nitrogen. This could minimize the competition for the inorganic nitrogen between coffee trees and soil mi- cro organisms, as opposed to the undecomposed materi- als, and indicates decreased decomposition of organic materials with an increased C:N ratio, which caused a shortage of nitrogen in the soil similar to previous find- ings [14]. The low C:N value could also be associated with the contribution of leguminous shade trees to in- crease nitrogen. The high rate of decomposition of or- ganic material and the concentrations of acid-forming ions, production of weak acids and basic cations could also be amongst the possible reasons for this low C:N ratio. Similar findings were reported elsewhere [15]. Table 3. Soil chemical properties (means ± SD) as influenced by profile depth at the four natural coffee forests of Ethiopia. Exchangeable base (meq/100 g) Site /depth (cm) TN (%) SOM (%) pH (H2O, 1:2.5) EC (1:2.5) K Ca Mg CEC (meq/100 g) Available P (ppm) C:N Harenna * * Ns Ns Ns Ns Ns Ns *** * 0 - 20 0.34 ± 0.06a 6.42 ± 1.99a6.04 ± 0.42 0.07 ± 0.050.84 ± 0.8722.24 ± 9.583.29 ± 0.5833.53 ± 8.35 1.50 ± 1.14a 10.78 ± 1.58b 20 - 40 0.17 ± 0.03b 3.32 ± 0.92b6.35 ± 0.46 0.11 ± 0.060.18 ± 0.1913.97 ± 6.133.12 ± 0.0524.76 ± 3.32 0.30 ± 0.13b 14.05 ± 2.16a Bonga Ns Ns Ns Ns Ns Ns Ns Ns Ns Ns 0 - 20 0.30 ± 0.07 4.53 ± 1.475.77 ± 0.81 0.10 ± 0.031.11 ± 0.2110.14 ± 2.503.47 ± 0.7328.10 ± 5.45 0.50 ± 0.28 8.73 ± 0.81 20 - 40 0.20 ± 0.02 2.85 ± 0.655.51 ± 0.64 0.08 ± 0.050.96 ± 0.347.85 ± 3.283.22 ± 0.5532.21 ± 6.92 0.20 ± 0.05 8.36 ± 1.49 B-Kontir Ns Ns Ns Ns Ns Ns Ns Ns Ns Ns 0 - 20 0.24 ± 0.10 2.88 ± 1.076.17 ± 0.56 0.12 ± 0.022.11 ± 2.0722.60 ± 9.918.14 ± 2.3424.09 ± 4.50 14.77 ± 7.38 7.05 ± 0.45 20 - 40 0.14 ± 0.05 1.48 ± 0.616.28 ± 0.40 0.12 ± 0.031.30 ± 0.9214.03 ± 9.066.94 ± 2.3127.93 ± 5.56 10.91 ± 9.37 6.20 ± 0.31 Yayu ** *** Ns Ns Ns * Ns Ns *** * 0 - 20 0.21 ± 0.02a 3.36 ± 0.47a5.54 ± 0.20 0.08 ± 0.020.70 ± 0.4513.04 ± 2.06a3.50 ± 0.3023.25 ± 2.28 8.90 ± 14.13a 9.24 ± 0.50a 20 - 40 0.14 ± 0.03b 1.85 ± 0.41b5.23 ± 0.62 0.09 ± 0.030.27 ± 0.179.82 ± 0.81b2.91 ± 0.6017.41 ± 1.97 0.40 ± 0.23b 7.83 ± 0.31b Ns = Not significant (P > 0.05), *P ≤ 0.05, **P ≤ 0.01 and ***P ≤ 0.001. Means with the same letter within a column are not significantly different according to Tukey grouping at P = 0.05. Abbreviations: TN = total nitrogen, SOM = organic matter, EC = electrical conductivity, CEC = cation exchange capacity, C:N = carbon to nitrogen ratio. 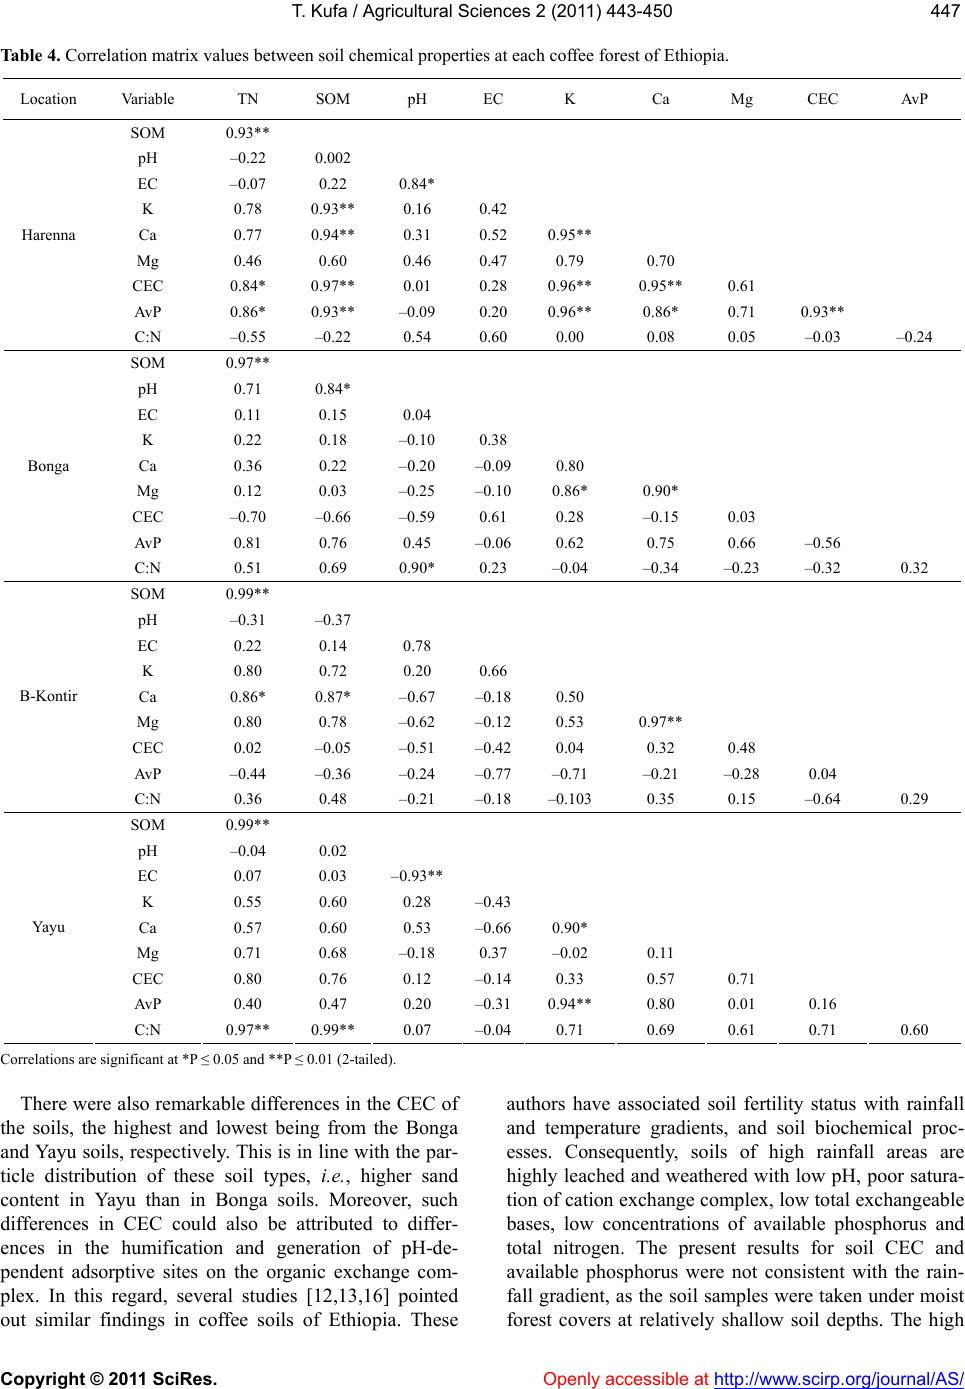 T. Kufa / Agricultural Sciences 2 (2011) 443-450 Copyright © 2011 SciRes. Openly accessible at http://www.scirp.org/journal/AS/ 447447 Table 4. Correlation matrix values between soil chemical properties at each coffee forest of Ethiopia. Location Variable TN SOM pH EC K Ca Mg CEC AvP SOM 0.93** pH –0.22 0.002 EC –0.07 0.22 0.84* K 0.78 0.93** 0.16 0.42 Ca 0.77 0.94** 0.31 0.52 0.95** Mg 0.46 0.60 0.46 0.47 0.79 0.70 CEC 0.84* 0.97** 0.01 0.28 0.96** 0.95** 0.61 AvP 0.86* 0.93** –0.09 0.20 0.96** 0.86* 0.71 0.93** Harenna C:N –0.55 –0.22 0.54 0.60 0.00 0.08 0.05 –0.03 –0.24 SOM 0.97** pH 0.71 0.84* EC 0.11 0.15 0.04 K 0.22 0.18 –0.10 0.38 Ca 0.36 0.22 –0.20 –0.090.80 Mg 0.12 0.03 –0.25 –0.100.86* 0.90* CEC –0.70 –0.66 –0.59 0.61 0.28 –0.15 0.03 AvP 0.81 0.76 0.45 –0.060.62 0.75 0.66 –0.56 Bonga C:N 0.51 0.69 0.90* 0.23 –0.04 –0.34 –0.23 –0.32 0.32 SOM 0.99** pH –0.31 –0.37 EC 0.22 0.14 0.78 K 0.80 0.72 0.20 0.66 Ca 0.86* 0.87* –0.67 –0.180.50 Mg 0.80 0.78 –0.62 –0.120.53 0.97** CEC 0.02 –0.05 –0.51 –0.420.04 0.32 0.48 AvP –0.44 –0.36 –0.24 –0.77–0.71 –0.21 –0.28 0.04 B-Kontir C:N 0.36 0.48 –0.21 –0.18–0.103 0.35 0.15 –0.64 0.29 SOM 0.99** pH –0.04 0.02 EC 0.07 0.03 –0.93** K 0.55 0.60 0.28 –0.43 Ca 0.57 0.60 0.53 –0.660.90* Mg 0.71 0.68 –0.18 0.37 –0.02 0.11 CEC 0.80 0.76 0.12 –0.140.33 0.57 0.71 AvP 0.40 0.47 0.20 –0.310.94** 0.80 0.01 0.16 Yayu C:N 0.97** 0.99** 0.07 –0.040.71 0.69 0.61 0.71 0.60 Correlations are significant at *P ≤ 0.05 and **P ≤ 0.01 (2-tailed). There were also remarkable differences in the CEC of the soils, the highest and lowest being from the Bonga and Yayu soils, respectively. This is in line with the par- ticle distribution of these soil types, i.e., higher sand content in Yayu than in Bonga soils. Moreover, such differences in CEC could also be attributed to differ- ences in the humification and generation of pH-de- pendent adsorptive sites on the organic exchange com- plex. In this regard, several studies [12,13,16] pointed out similar findings in coffee soils of Ethiopia. These authors have associated soil fertility status with rainfall and temperature gradients, and soil biochemical proc- esses. Consequently, soils of high rainfall areas are highly leached and weathered with low pH, poor satura- tion of cation exchange complex, low total exchangeable bases, low concentrations of available phosphorus and total nitrogen. The present results for soil CEC and available phosphorus were not consistent with the rain- fall gradient, as the soil samples were taken under moist forest covers at relatively shallow soil depths. The high 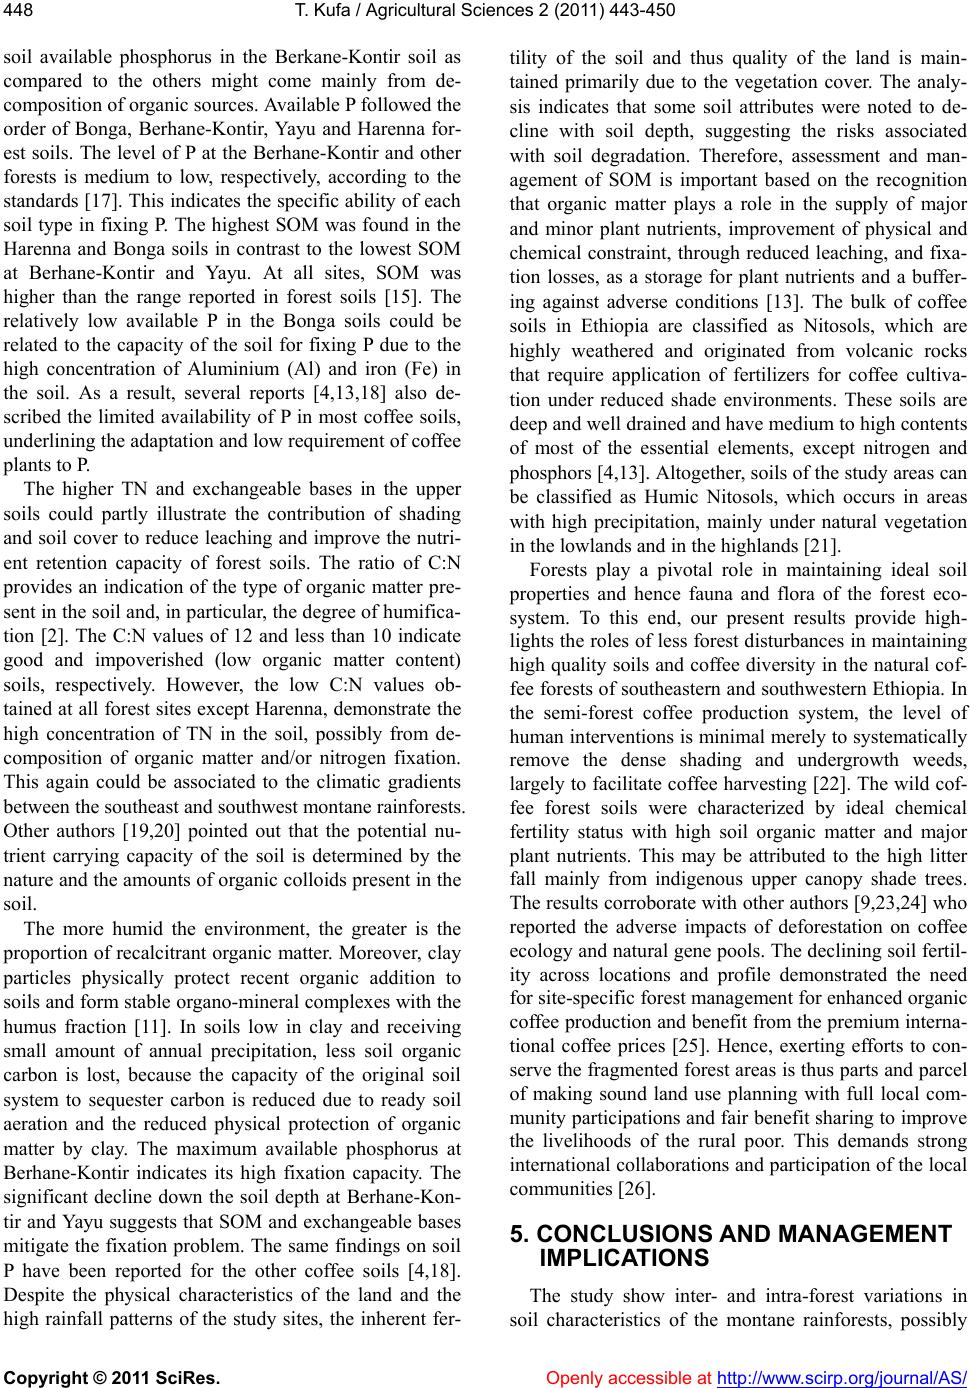 T. Kufa / Agricultural Sciences 2 (2011) 443-450 Copyright © 2011 SciRes. Openly accessible at http://www.scirp.org/journal/AS/ 448 soil available phosphorus in the Berkane-Kontir soil as compared to the others might come mainly from de- composition of organic sources. Available P followed the order of Bonga, Berhane-Kontir, Yayu and Harenna for- est soils. The level of P at the Berhane-Kontir and other forests is medium to low, respectively, according to the standards [17]. This indicates the specific ability of each soil type in fixing P. The highest SOM was found in the Harenna and Bonga soils in contrast to the lowest SOM at Berhane-Kontir and Yayu. At all sites, SOM was higher than the range reported in forest soils [15]. The relatively low available P in the Bonga soils could be related to the capacity of the soil for fixing P due to the high concentration of Aluminium (Al) and iron (Fe) in the soil. As a result, several reports [4,13,18] also de- scribed the limited availability of P in most coffee soils, underlining the adaptation and low requirement of coffee plants to P. The higher TN and exchangeable bases in the upper soils could partly illustrate the contribution of shading and soil cover to reduce leaching and improve the nutri- ent retention capacity of forest soils. The ratio of C:N provides an indication of the type of organic matter pre- sent in the soil and, in particular, the degree of humifica- tion [2]. The C:N values of 12 and less than 10 indicate good and impoverished (low organic matter content) soils, respectively. However, the low C:N values ob- tained at all forest sites except Harenna, demonstrate the high concentration of TN in the soil, possibly from de- composition of organic matter and/or nitrogen fixation. This again could be associated to the climatic gradients between the southeast and southwest montane rainforests. Other authors [19,20] pointed out that the potential nu- trient carrying capacity of the soil is determined by the nature and the amounts of organic colloids present in the soil. The more humid the environment, the greater is the proportion of recalcitrant organic matter. Moreover, clay particles physically protect recent organic addition to soils and form stable organo-mineral complexes with the humus fraction [11]. In soils low in clay and receiving small amount of annual precipitation, less soil organic carbon is lost, because the capacity of the original soil system to sequester carbon is reduced due to ready soil aeration and the reduced physical protection of organic matter by clay. The maximum available phosphorus at Berhane-Kontir indicates its high fixation capacity. The significant decline down the soil depth at Berhane-Kon- tir and Yayu suggests that SOM and exchangeable bases mitigate the fixation problem. The same findings on soil P have been reported for the other coffee soils [4,18]. Despite the physical characteristics of the land and the high rainfall patterns of the study sites, the inherent fer- tility of the soil and thus quality of the land is main- tained primarily due to the vegetation cover. The analy- sis indicates that some soil attributes were noted to de- cline with soil depth, suggesting the risks associated with soil degradation. Therefore, assessment and man- agement of SOM is important based on the recognition that organic matter plays a role in the supply of major and minor plant nutrients, improvement of physical and chemical constraint, through reduced leaching, and fixa- tion losses, as a storage for plant nutrients and a buffer- ing against adverse conditions [13]. The bulk of coffee soils in Ethiopia are classified as Nitosols, which are highly weathered and originated from volcanic rocks that require application of fertilizers for coffee cultiva- tion under reduced shade environments. These soils are deep and well drained and have medium to high contents of most of the essential elements, except nitrogen and phosphors [4,13]. Altogether, soils of the study areas can be classified as Humic Nitosols, which occurs in areas with high precipitation, mainly under natural vegetation in the lowlands and in the highlands [21]. Forests play a pivotal role in maintaining ideal soil properties and hence fauna and flora of the forest eco- system. To this end, our present results provide high- lights the roles of less forest disturbances in maintaining high quality soils and coffee diversity in the natural cof- fee forests of southeastern and southwestern Ethiopia. In the semi-forest coffee production system, the level of human interventions is minimal merely to systematically remove the dense shading and undergrowth weeds, largely to facilitate coffee harvesting [22]. The wild cof- fee forest soils were characterized by ideal chemical fertility status with high soil organic matter and major plant nutrients. This may be attributed to the high litter fall mainly from indigenous upper canopy shade trees. The results corroborate with other authors [9,23,24] who reported the adverse impacts of deforestation on coffee ecology and natural gene pools. The declining soil fertil- ity across locations and profile demonstrated the need for site-specific forest management for enhanced organic coffee production and benefit from the premium interna- tional coffee prices [25]. Hence, exerting efforts to con- serve the fragmented forest areas is thus parts and parcel of making sound land use planning with full local com- munity participations and fair benefit sharing to improve the livelihoods of the rural poor. This demands strong international collaborations and participation of the local communities [26]. 5. CONCLUSIONS AND MANAGEMENT IMPLICATIONS The study show inter- and intra-forest variations in soil characteristics of the montane rainforests, possibly  T. Kufa / Agricultural Sciences 2 (2011) 443-450 Copyright © 2011 SciRes. Openly accessible at http://www.scirp.org/journal/AS/ 449449 due to the effects of forest management, vegetation composition, site variables, parent materials and climate gradients presented in Table 1. Moreover, significant variations were detected between soil profile depths for most soil properties could demonstrate the possible ad- verse impacts of human induced soil erosion from culti- vated lands. The present findings underline the contribu- tions of vegetation cover in building up high quality soil fertility status and preventing run-off on steep slopes. Hence, the opened up plots should deserve special atten- tion of rehabilitation works of future management inter- ventions. The declining soil fertility across locations and profile demonstrated the need for site-specific forest manage- ment. However, studies on seasonal variations in dy- namics of carbon sequestration, nitrogen sources and mineralization processes call for further works. To ex- haust the present findings and use soil properties as geo- graphical indicators, more transects within and around each study remain to be assessed over seasons and across locations. To ensure traceable specialty coffees, there is a need for comprehensive works on the relation- ships between quality attributes and environmental as well as soil factors. This study would also provide prac- tical implications for cost-effective environmental sus- tainability and utilization of the remnant forest land- scapes, maximum biodiversity and functioning ecosys- tem services for global benefits. As to what extent forest management levels, composition of plant species, parent materials, soil microorganism and biochemical process can dictate soil fertility status are among the focussed areas that deserve attentions. The friendly coffee forest environments are highly vulnerable to climate change patterns and thus also require especial mitigation and adaptation strategies. Moreover, in view of the ever in- creasing population pressure, the trade-offs between agricultural productivity, quality, biodiversity, and eco- system goods and services call for strong collaborations between the national and international actors to ensure sustainability components (environmental, economical and social) for the well being of the global population in general and Ethiopian people in particular. REFERENCES [1] Coste, R. (1992) Coffee: The plant and the product. Macmillan, London. [2] Wintgens, J.N. (2004) Coffee: Growing, processing, sustainable production. A guide for growers, traders, and researchers. WILEY-VCH Verlag GmbH and Co. KGaA, Weinheim. [3] Wrigley, G (1988) Coffee. Tropical Agriculture Series, John Wiley and Sons, Inc., London. [4] Paulos, D. (1994) Mineral fertilization of coffee in Ethio- pia. Institute of Agricultural Research, Addis Ababa. [5] Cambrony, H.R. (1992) Coffee growing. CTA/The Mac- millan Press Ltd., New York. [6] Francis, B., Taye, K., Shalander, K., Julious, O., Efrain, A.P. and Africa, Z. (2000) Natural resources under threat: An analysis of the farming systems of ghimbo wereda, Kefa-Sheka Zone, Ethiopia. ICRA Working Document Series 84, Wageningen. [7] Paulos, D. and Demel, T. (2000) The need for forest cof- fee germplasm conservation in Ethiopia and its signifi- cance in the control of coffee diseases. Proceedings of the workshop on control of Coffee Berry Disease (CBD) in Ethiopia, Addis Ababa, 13-15 August 1999, 125-135. [8] Tadesse, W., Denich, M., Demel, T. and Vlek, P.L.G. (2001) Human impacts on Coffea arabica genetic pools in Ethiopia and the need for its in situ conservation. In: Rao, R., Brown, A. and Jackson, M., Eds., Managing Plant Genetic Diversity, CABI and IPGRI, 237-247. [9] Tadesse, W. (2003) Vegetation of Yayu forest in SW Ethiopia: Impacts of human use and implications for in situ conservation of wild Coffea arabica L. populations. Ph.D. Thesis, Ecology and Development Series, No. 10, Cuvillier Verlag, Göttingen. [10] Okalebo, J.R., Gathua, K.W. and Wormer, P.L. (1993) Laboratory methods of soil and plant analysis: A working manual. Soil Science Society of East Africa Technical Publication No 1, Marvel EPZ (Kenya) LTD, Nairobi. [11] Tekalign, T., Haque, I. and Aduayi, E.A. (1991) Soil, plant, water, fertilizer, animal manure and compost analysis manual. Plant Science Division Working Docu- ment 13, ILCA, Addis Ababa. [12] Murphy, H.L. (1968) A report on the fertility status and other data on some soils of Ethiopia. College of Agricul- ture, Haile Sellassie I University, Addis Ababa. [13] Mesfin, A. (1998) Nature and management of Ethiopian soils. Alemaya University of Agriculture, ILRI, Addis Ababa. [14] Brady, N.C. and Weil, R.R. (2002) The nature and prop- erties of soils. 13th Edition, Pearson Education, Inc., Upper Saddle River. [15] Brady, N. (1990) The nature and properties of soils. 10th Edition, Macmillan Publishing Company, Cranbury. [16] Tewoldeberhan, G.E. (1986) Preliminary studies on the ecology of a natural coffee (Coffea arabica) forest with emphasis on coffee. Acta Universitatis Upsaliensis Sym- bolae Botanicae Upsalienses, 26, 146-156. [17] Hofner, W. and Schmitz, M. (1984) Report on the soil and foliar analysis in 15 CIP areas in socialist Ethiopia. EEC/MCTD, Addis Ababa, Ethiopia. [18] Paulos, D. and Moorby, J. (1995) Growth response of coffee (Coffea arabica L.) seedlings to phosphorus nutri- tion in nutrient solution. Proceedings of the 16th Interna- tional Conference on Coffee Science (ASIC) Colloquium, Kyoto, 755-764. [19] Franco, A.A. and Munns, D.N. (1982) Plant assimilation and nitrogen cycling. Plant and Soil, 67, 1-13. doi:10.1007/BF02182751 [20] Hsieh, S.C. and Hsieh, C.F. (1990) The use of organic matter in crop production food and fertilizer technology center. Extension Bulletin, 315, Taiwan. [21] FAO/UNESCO (1973) Soil map of the world. 6, UNESCO, Paris.  T. Kufa / Agricultural Sciences 2 (2011) 443-450 Copyright © 2011 SciRes. http://www.scirp.org/journal/AS/Openly accessible at 450 [22] Workafes, W.T. and Kassu, K. (2000) Coffee production systems in Ethiopia. Proceedings of the Workshop on the Control of Coffee Berry Disease (CBD) in Ethiopia, Ad- dis Ababa (Ghion Hotel), 13-15 August 1999, 99-106. [23] Feyera, S. (2006) Biodiversity and ecology of Afromon- tane rainforests with Coffea arabica L. populations in Ethiopia. Ph.D. Thesis, Ecology and Development Series No. 38, Cuvillier Verlag, Göttingen. [24] Taye, K. (2006) Ecophysiological diversity of wild Ara- bica coffee populations in Ethiopia: Growth, water rela- tions and hydraulic characteristics along a climatic gra- dient. Ph.D. Thesis, Ecology and Development Series 46, Cuvillier Verlag, Göttingen. [25] Taye, K. and Tesfaye, S. (2002) Organic coffee production: Hope for small-scale farmers in Ethiopia. Proceedings of the 19th International Conference on Coffee Science (ASIC), Trieste, 14-18 May 2001. [26] Taye, K. (2010) Environmental sustainability and coffee diversity in Africa. ICO World Coffee Conference, Gua- temala City, 26-28 February 2010. http://dev.ico.org/event_pdfs/wcc2010/presentations/wcc 2010-kufa.pdf. |