

Paper Menu >>
Journal Menu >>
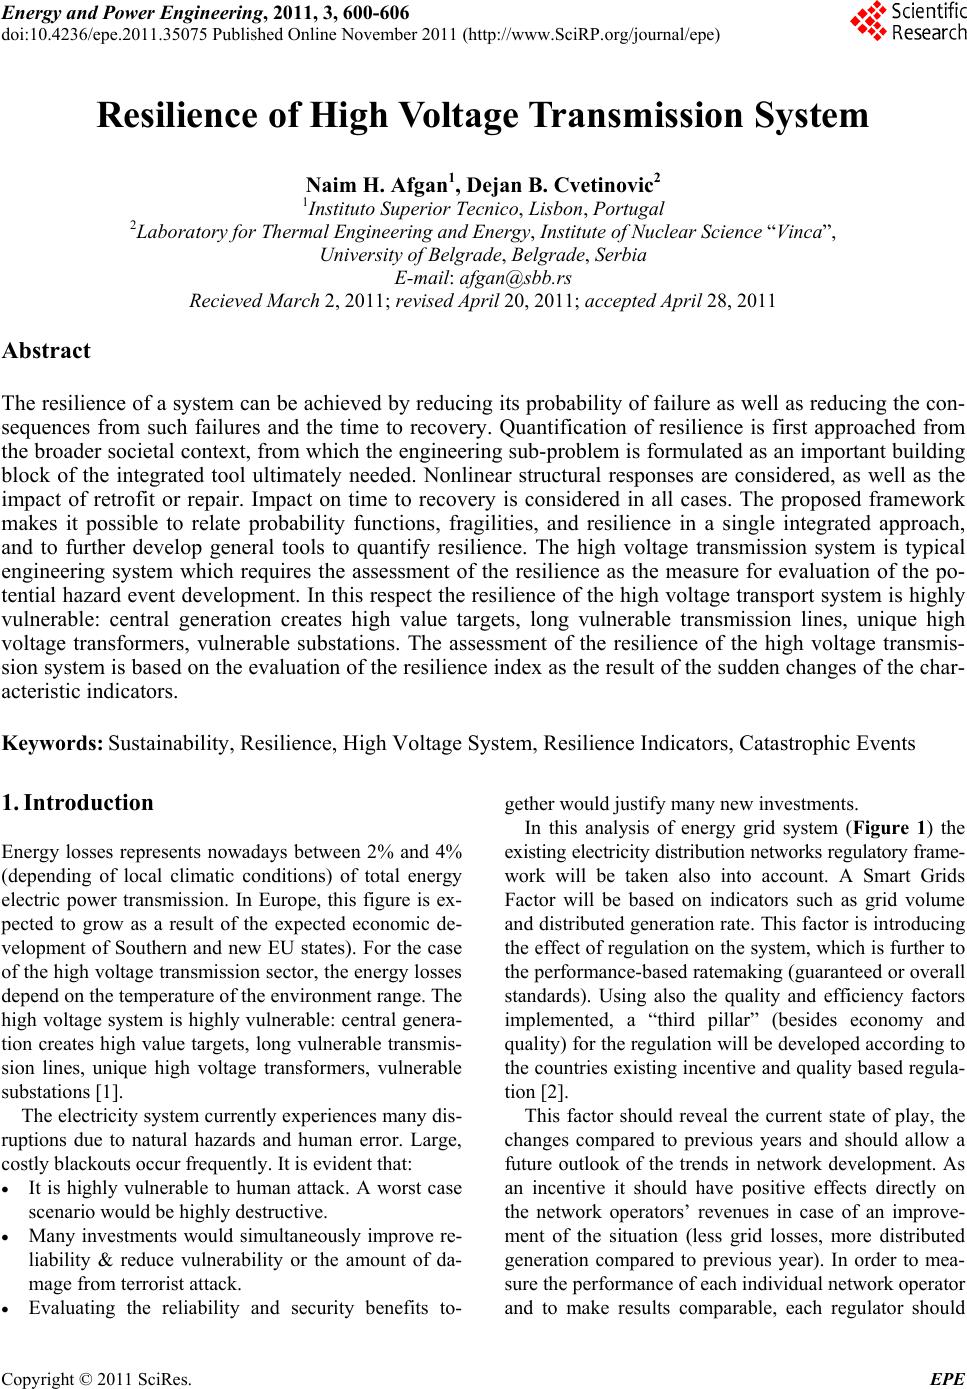 Energy and Power En gi neering, 2011, 3, 600-606 doi:10.4236/epe.2011.35075 Published Online November 2011 (http://www.SciRP.org/journal/epe) Copyright © 2011 SciRes. EPE Resilience of High Voltage Transmission System Naim H. Afgan1, Dejan B. Cvetinovic2 1Instituto Superior Tecnico, Lisbon, Portugal 2Laboratory for Thermal Engineering and Energy, Institute of Nuclear Science “Vinca”, University of Belgrade, Belgrade, Serbia E-mail: [email protected] Recieved March 2, 2011; revised April 20, 2011; accepted April 28, 2011 Abstract The resilience of a system can be achieved by reducing its probability of failure as well as reducing the con- sequences from such failures and the time to recovery. Quantification of resilience is first approached from the broader societal context, from which the engineering sub-problem is formulated as an important building block of the integrated tool ultimately needed. Nonlinear structural responses are considered, as well as the impact of retrofit or repair. Impact on time to recovery is considered in all cases. The proposed framework makes it possible to relate probability functions, fragilities, and resilience in a single integrated approach, and to further develop general tools to quantify resilience. The high voltage transmission system is typical engineering system which requires the assessment of the resilience as the measure for evaluation of the po- tential hazard event development. In this respect the resilience of the high voltage transport system is highly vulnerable: central generation creates high value targets, long vulnerable transmission lines, unique high voltage transformers, vulnerable substations. The assessment of the resilience of the high voltage transmis- sion system is based on the evaluation of the resilience index as the result of the sudden changes of the char- acteristic indicators. Keywords: Sustainability, Resilience, High Voltage System, Resilience Indicators, Catastrophic Events 1. Introduction Energy losses represents nowadays between 2% and 4% (depending of local climatic conditions) of total energy electric power transmission. In Europe, this figure is ex- pected to grow as a result of the expected economic de- velopment of Southern and new EU states). For the case of the high voltage transmission sector, the energy losses depend on the temperature of the environment range. The high voltage system is highly vulnerable: central genera- tion creates high value targets, long vulnerable transmis- sion lines, unique high voltage transformers, vulnerable substations [1]. The electricity system currently experiences many dis- ruptions due to natural hazards and human error. Large, costly blackouts occur frequently. It is evident that: It is highly vulnerable to human attack. A worst case scenario would be highly destructive. Many investments would simultaneously improve re- liability & reduce vulnerability or the amount of da- mage from terrorist attack. Evaluating the reliability and security benefits to- gether would justify many new investments. In this analysis of energy grid system (Figure 1) the existing electricity distribution networks regulatory frame- work will be taken also into account. A Smart Grids Factor will be based on indicators such as grid volume and distributed generation rate. This factor is introducing the effect of regulation on the system, which is further to the performance-based ratemaking (guaranteed or overall standards). Using also the quality and efficiency factors implemented, a “third pillar” (besides economy and quality) for the regulation will be developed according to the countries existing incentive and quality based regula- tion [2]. This factor should reveal the current state of play, the changes compared to previous years and should allow a future outlook of the trends in network development. As an incentive it should have positive effects directly on the network operators’ revenues in case of an improve- ment of the situation (less grid losses, more distributed generation compared to previous year). In order to mea- sure the performance of each individual network operator nd to make results comparable, each regulator should a 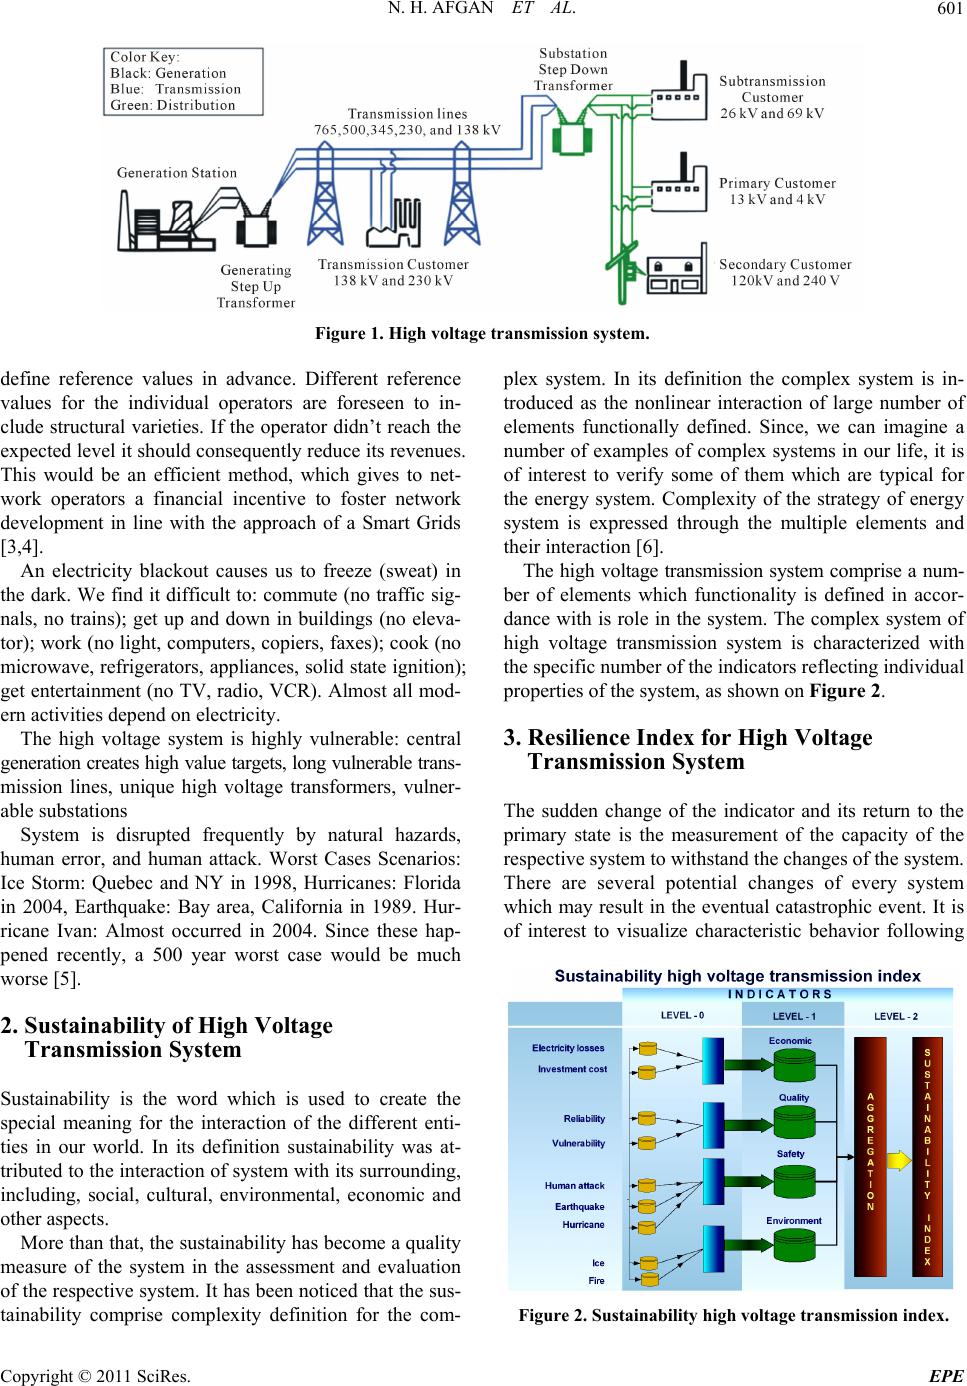 N. H. AFGAN ET AL. Copyright © 2011 SciRes. EPE 601 Figure 1. High voltage transmission system. define reference values in advance. Different reference values for the individual operators are foreseen to in- clude structural varieties. If the operator didn’t reach the expected level it should consequently reduce its revenues. This would be an efficient method, which gives to net- work operators a financial incentive to foster network development in line with the approach of a Smart Grids [3,4]. An electricity blackout causes us to freeze (sweat) in the dark. We find it difficult to: commute (no traffic sig- nals, no trains); get up and down in buildings (no eleva- tor); work (no light, computers, copiers, faxes); cook (no microwave, refrigerators, appliances, solid state ignition); get entertainment (no TV, radio, VCR). Almost all mod- ern activities depend on electricity. The high voltage system is highly vulnerable: central generation creates high value targets, long vulnerable trans- mission lines, unique high voltage transformers, vulner- able substations System is disrupted frequently by natural hazards, human error, and human attack. Worst Cases Scenarios: Ice Storm: Quebec and NY in 1998, Hurricanes: Florida in 2004, Earthquake: Bay area, California in 1989. Hur- ricane Ivan: Almost occurred in 2004. Since these hap- pened recently, a 500 year worst case would be much worse [5]. 2. Sustainability of High Voltage Transmission System Sustainability is the word which is used to create the special meaning for the interaction of the different enti- ties in our world. In its definition sustainability was at- tributed to the interaction of system with its surrounding, including, social, cultural, environmental, economic and other aspects. More than that, the sustainability has become a quality measure of the system in the assessment and evaluation of the respective system. It has been noticed that the sus- tainability comprise complexity definition for the com- plex system. In its definition the complex system is in- troduced as the nonlinear interaction of large number of elements functionally defined. Since, we can imagine a number of examples of complex systems in our life, it is of interest to verify some of them which are typical for the energy system. Complexity of the strategy of energy system is expressed through the multiple elements and their interaction [6]. The high voltage transmission system comprise a num- ber of elements which functionality is defined in accor- dance with is role in the system. The complex system of high voltage transmission system is characterized with the specific number of the indicators reflecting individual properties of the system, as shown on Figure 2. 3. Resilience Index for High V oltage Transmission System The sudden change of the indicator and its return to the primary state is the measurement of the capacity of the respective system to withstand the changes of the system. There are several potential changes of every system which may result in the eventual catastrophic event. It is of interest to visualize characteristic behavior following Figure 2. Sustainability high voltage transmission index. 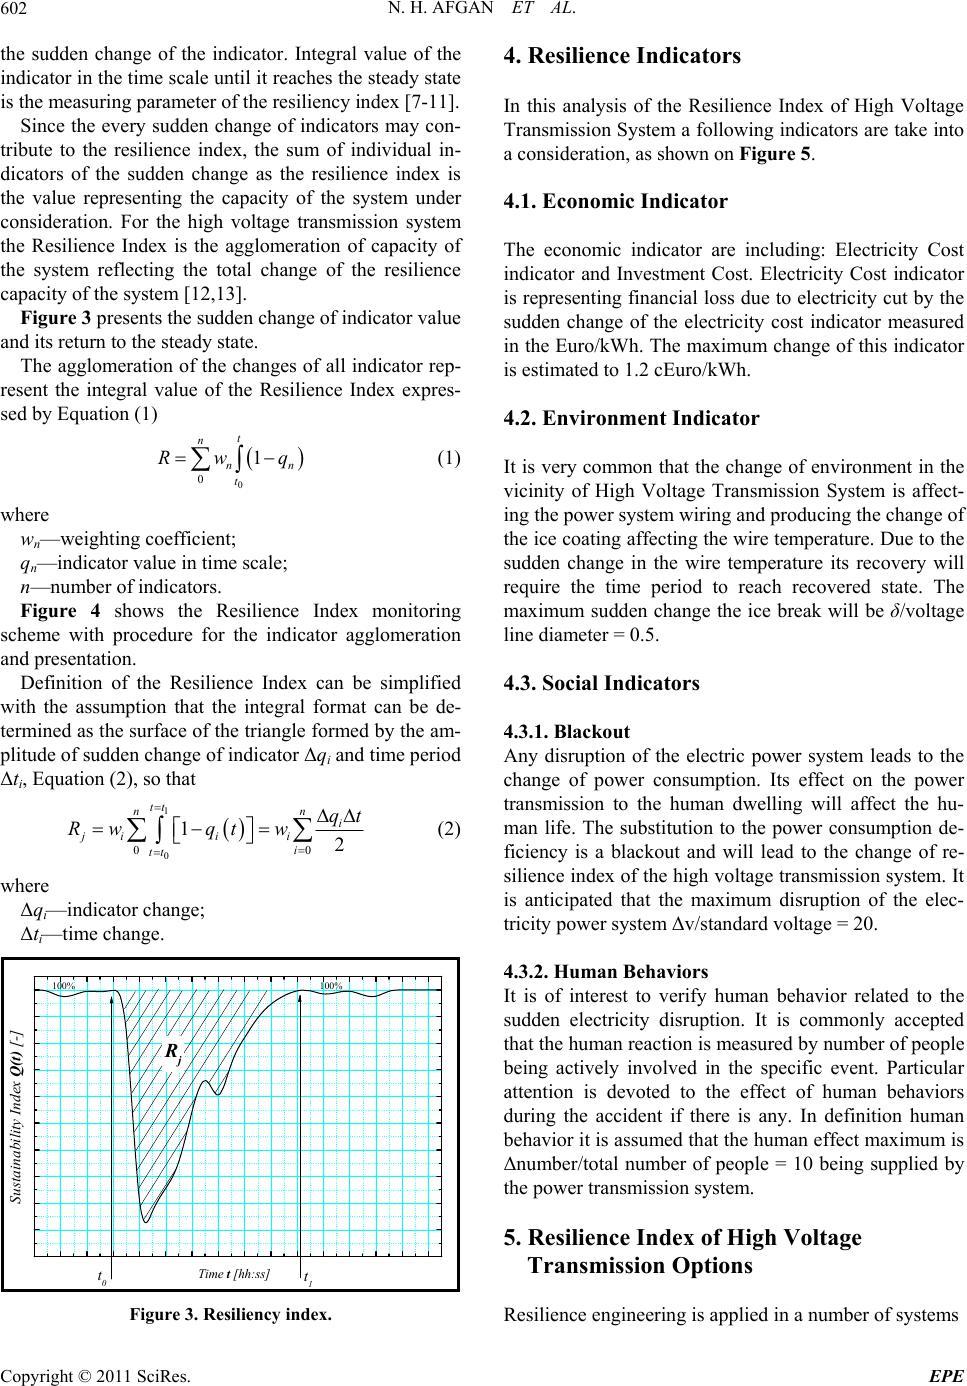 N. H. AFGAN ET AL. 602 n the sudden change of the indicator. Integral value of the indicator in the time scale until it reaches the steady state is the measuring parameter of the resiliency index [7-11]. Since the every sudden change of indicators may con- tribute to the resilience index, the sum of individual in- dicators of the sudden change as the resilience index is the value representing the capacity of the system under consideration. For the high voltage transmission system the Resilience Index is the agglomeration of capacity of the system reflecting the total change of the resilience capacity of the system [12,13]. Figure 3 presents the sudden change of indicator value and its return to the steady state. The agglomeration of the changes of all indicator rep- resent the integral value of the Resilience Index expres- sed by Equation (1) 0 0 1 t n n t Rw q (1) where wn—weighting coefficient; qn—indicator value in time scale; n—number of indicators. Figure 4 shows the Resilience Index monitoring scheme with procedure for the indicator agglomeration and presentation. Definition of the Resilience Index can be simplified with the assumption that the integral format can be de- termined as the surface of the triangle formed by the am- plitude of sudden change of indicator Δqi and time period Δti, Equation (2), so that 1 0 00 12 tt nn i jii i i tt qt Rwqt w (2) where Δqi—indicator change; Δti—time change. t1 100% Sustainability Index Q(t) [-] Time t [hh:ss] 100% t0 Rj Figure 3. Resiliency index. 4. Resilience Indicators In this analysis of the Resilience Index of High Voltage Transmission System a following indicators are take into a consideration, as shown on Figure 5. 4.1. Economic Indicator The economic indicator are including: Electricity Cost indicator and Investment Cost. Electricity Cost indicator is representing financial loss due to electricity cut by the sudden change of the electricity cost indicator measured in the Euro/kWh. The maximum change of this indicator is estimated to 1.2 cEuro/kWh. 4.2. Environment Indicator It is very common that the change of environment in the vicinity of High Voltage Transmission System is affect- ing the power system wiring and producing the change of the ice coating affecting the wire temperature. Due to the sudden change in the wire temperature its recovery will require the time period to reach recovered state. The maximum sudden change the ice break will be δ/voltage line diameter = 0.5. 4.3. Social Indicators 4.3.1. Blackout Any disruption of the electric power system leads to the change of power consumption. Its effect on the power transmission to the human dwelling will affect the hu- man life. The substitution to the power consumption de- ficiency is a blackout and will lead to the change of re- silience index of the high voltage transmission system. It is anticipated that the maximum disruption of the elec- tricity power system Δv/standard voltage = 20. 4.3.2. Human Behaviors It is of interest to verify human behavior related to the sudden electricity disruption. It is commonly accepted that the human reaction is measured by number of people being actively involved in the specific event. Particular attention is devoted to the effect of human behaviors during the accident if there is any. In definition human behavior it is assumed that the human effect maximum is Δnumber/total number of people = 10 being supplied by the power transmission system. 5. Resilience Index of High Voltage Transmission Options R esilience engineering is applied in a number of systems Copyright © 2011 SciRes. EPE 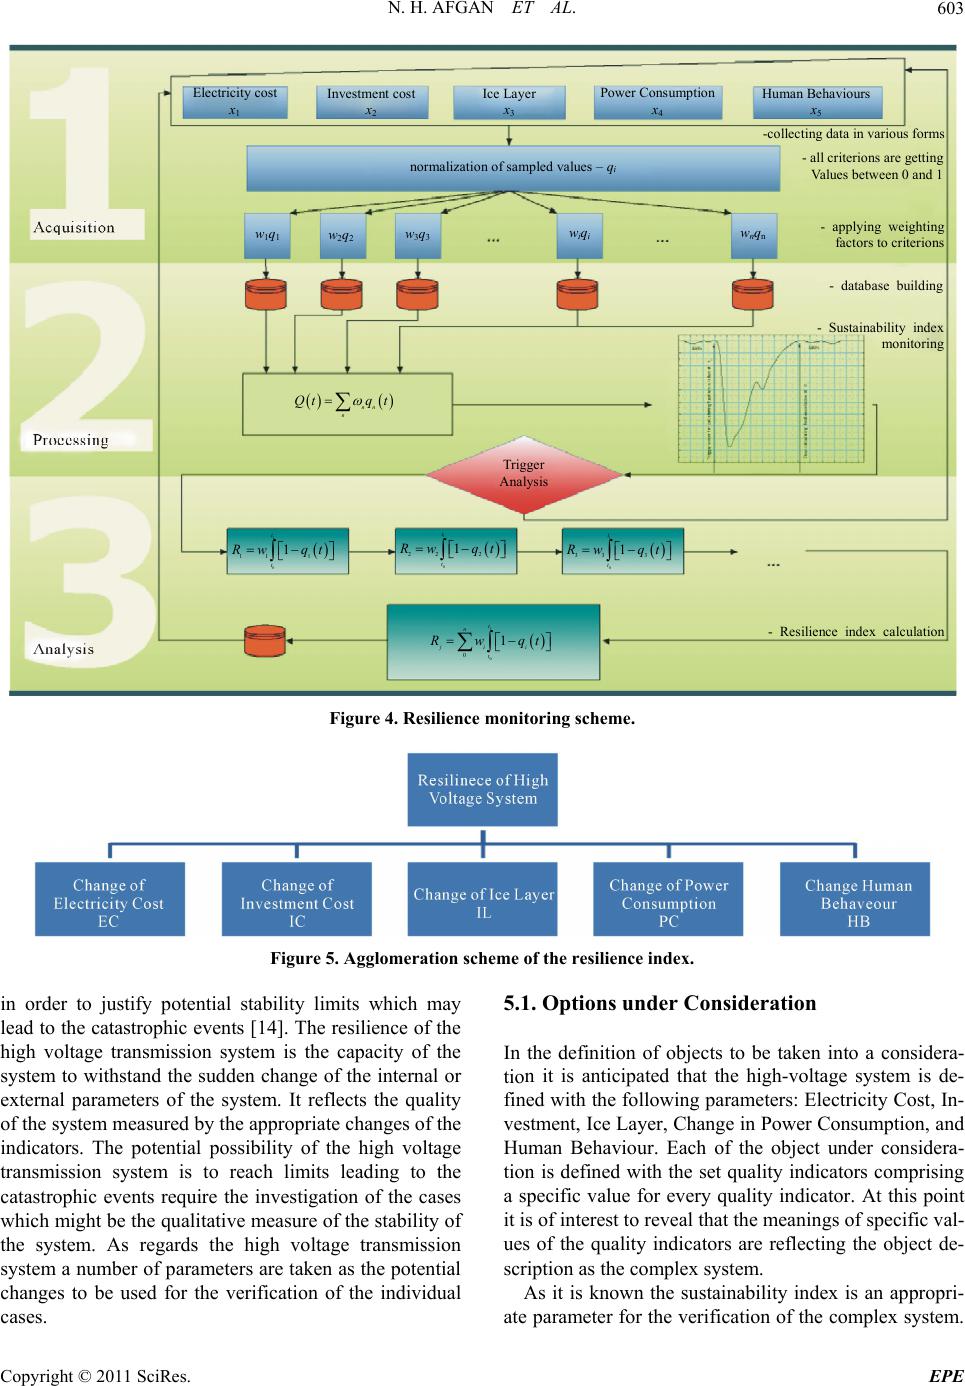 N. H. AFGAN ET AL. Copyright © 2011 SciRes. EPE 603 Electricity cost x 1 Investment cost x 2 Ice Layer x 3 Power Consumption x 4 Human Behaviours x 5 normalization of sampled values – q i -collecting data in various forms - all criterions are getting Values between 0 and 1 - applying weighting factors to criterions - database building - Sustainability index monitoring - Resilience index calculation Trigger Analysis w 1 q 1 w 2 q 2 w 3 q 3 w i q i w n q n nn n Qtq t 1 0 11 1 1 t t Rw qt 1 0 22 2 1 t t Rw qt 1 0 333 1 t t Rw qt 1 0 0 1 t n jii t Rwqt Figure 4. Resilience monitoring scheme. Figure 5. Agglomeration scheme of the resilience index. 5.1. Options under Consideration in order to justify potential stability limits which may lead to the catastrophic events [14]. The resilience of the high voltage transmission system is the capacity of the system to withstand the sudden change of the internal or external parameters of the system. It reflects the quality of the system measured by the appropriate changes of the indicators. The potential possibility of the high voltage transmission system is to reach limits leading to the catastrophic events require the investigation of the cases which might be the qualitative measure of the stability of the system. As regards the high voltage transmission system a number of parameters are taken as the potential changes to be used for the verification of the individual cases. In the definition of objects to be taken into a considera- tion it is anticipated that the high-voltage system is de- fined with the following parameters: Electricity Cost, In- vestment, Ice Layer, Change in Power Consumption, and Human Behaviour. Each of the object under considera- tion is defined with the set quality indicators comprising a specific value for every quality indicator. At this point it is of interest to reveal that the meanings of specific val- ues of the quality indicators are reflecting the object de- scription as the complex system. As it is known the sustainability index is an appropri- ate parameter for the verification of the complex system. 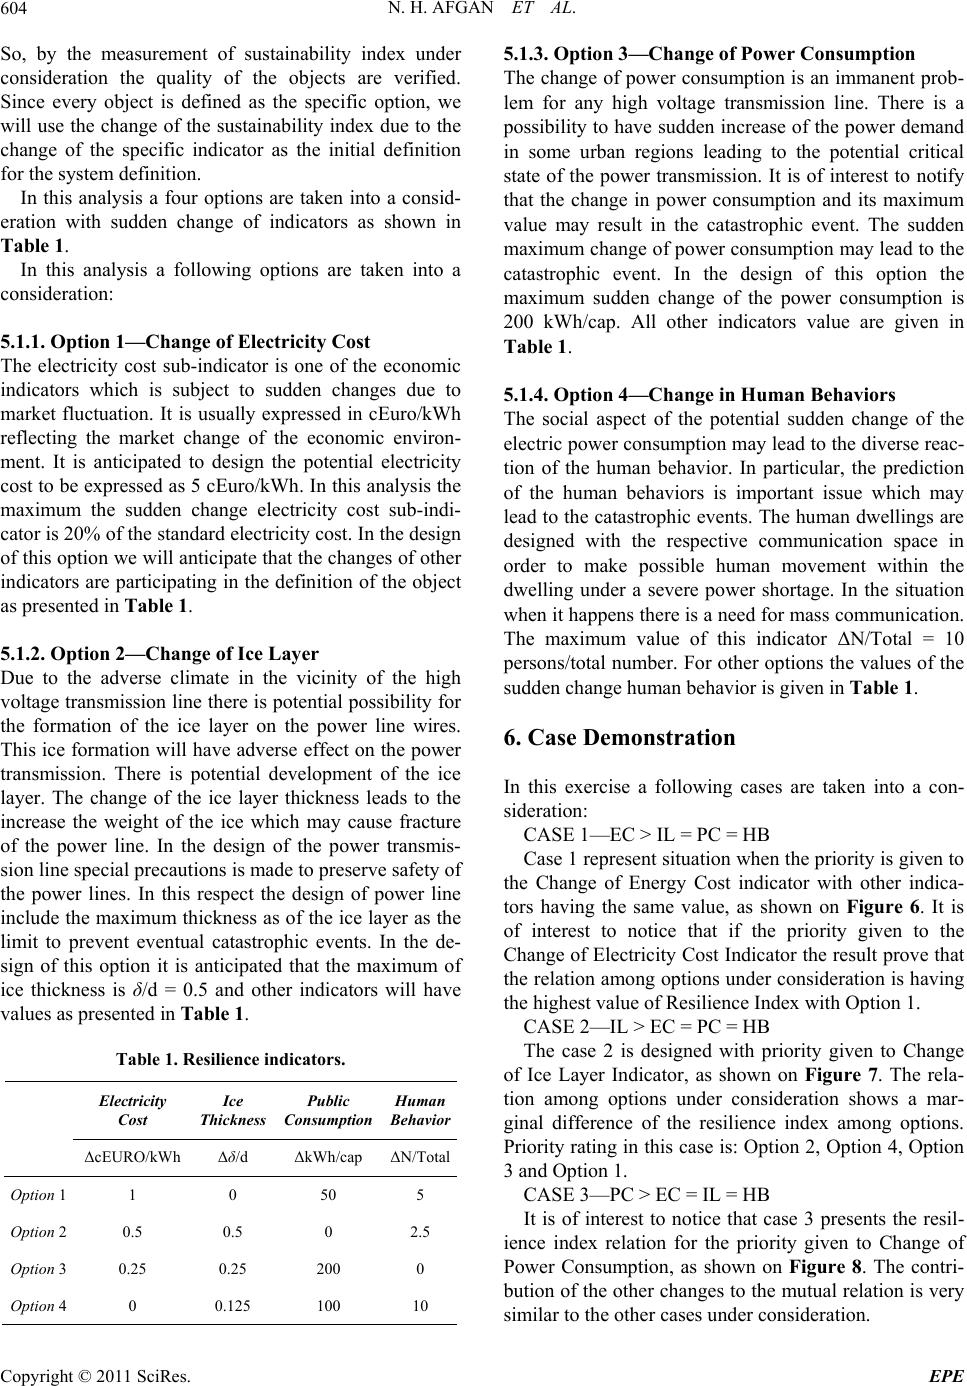 N. H. AFGAN ET AL. 604 So, by the measurement of sustainability index under consideration the quality of the objects are verified. Since every object is defined as the specific option, we will use the change of the sustainability index due to the change of the specific indicator as the initial definition for the system definition. In this analysis a four options are taken into a consid- eration with sudden change of indicators as shown in Table 1. In this analysis a following options are taken into a consideration: 5.1.1. Option 1— C hange of El ec tr i city Cost The electricity cost sub-indicator is one of the economic indicators which is subject to sudden changes due to market fluctuation. It is usually expressed in cEuro/kWh reflecting the market change of the economic environ- ment. It is anticipated to design the potential electricity cost to be expressed as 5 cEuro/kWh. In this analysis the maximum the sudden change electricity cost sub-indi- cator is 20% of the standard electricity cost. In the design of this option we will anticipate that the changes of other indicators are participating in the definition of the object as presented in Table 1. 5.1.2. Option 2—Change of Ic e Layer Due to the adverse climate in the vicinity of the high voltage transmission line there is potential possibility for the formation of the ice layer on the power line wires. This ice formation will have adverse effect on the power transmission. There is potential development of the ice layer. The change of the ice layer thickness leads to the increase the weight of the ice which may cause fracture of the power line. In the design of the power transmis- sion line special precautions is made to preserve safety of the power lines. In this respect the design of power line include the maximum thickness as of the ice layer as the limit to prevent eventual catastrophic events. In the de- sign of this option it is anticipated that the maximum of ice thickness is δ/d = 0.5 and other indicators will have values as presented in Table 1. Table 1. Resilience indicators. Electricity Cost Ice Thickness Public Consumption Human Behavior ΔcEURO/kWh Δδ/d ΔkWh/cap ΔN/Total Option 1 1 0 50 5 Option 2 0.5 0.5 0 2.5 Option 3 0.25 0.25 200 0 Option 4 0 0.125 100 10 5.1.3. Option 3— C hange of Pow er Consumptio n The change of power consumption is an immanent prob- lem for any high voltage transmission line. There is a possibility to have sudden increase of the power demand in some urban regions leading to the potential critical state of the power transmission. It is of interest to notify that the change in power consumption and its maximum value may result in the catastrophic event. The sudden maximum change of power consumption may lead to the catastrophic event. In the design of this option the maximum sudden change of the power consumption is 200 kWh/cap. All other indicators value are given in Table 1. 5.1.4. Option 4— Change in Hum a n Be haviors The social aspect of the potential sudden change of the electric power consumption may lead to the diverse reac- tion of the human behavior. In particular, the prediction of the human behaviors is important issue which may lead to the catastrophic events. The human dwellings are designed with the respective communication space in order to make possible human movement within the dwelling under a severe power shortage. In the situation when it happens there is a need for mass communication. The maximum value of this indicator ΔN/Total = 10 persons/total number. For other options the values of the sudden change human behavior is given in Table 1. 6. Case Demonstration In this exercise a following cases are taken into a con- sideration: CASE 1—EC > IL = PC = HB Case 1 represent situation when the priority is given to the Change of Energy Cost indicator with other indica- tors having the same value, as shown on Figure 6. It is of interest to notice that if the priority given to the Change of Electricity Cost Indicator the result prove that the relation among options under consideration is having the highest value of Resilience Index with Option 1. CASE 2—IL > EC = PC = HB The case 2 is designed with priority given to Change of Ice Layer Indicator, as shown on Figure 7. The rela- tion among options under consideration shows a mar- ginal difference of the resilience index among options. Priority rating in this case is: Option 2, Option 4, Option 3 and Option 1. CASE 3—PC > EC = IL = HB It is of interest to notice that case 3 presents the resil- ience index relation for the priority given to Change of Power Consumption, as shown on Figure 8. The contri- bution of the other changes to the mutual relation is very similar to the other cases under consideration. Copyright © 2011 SciRes. EPE 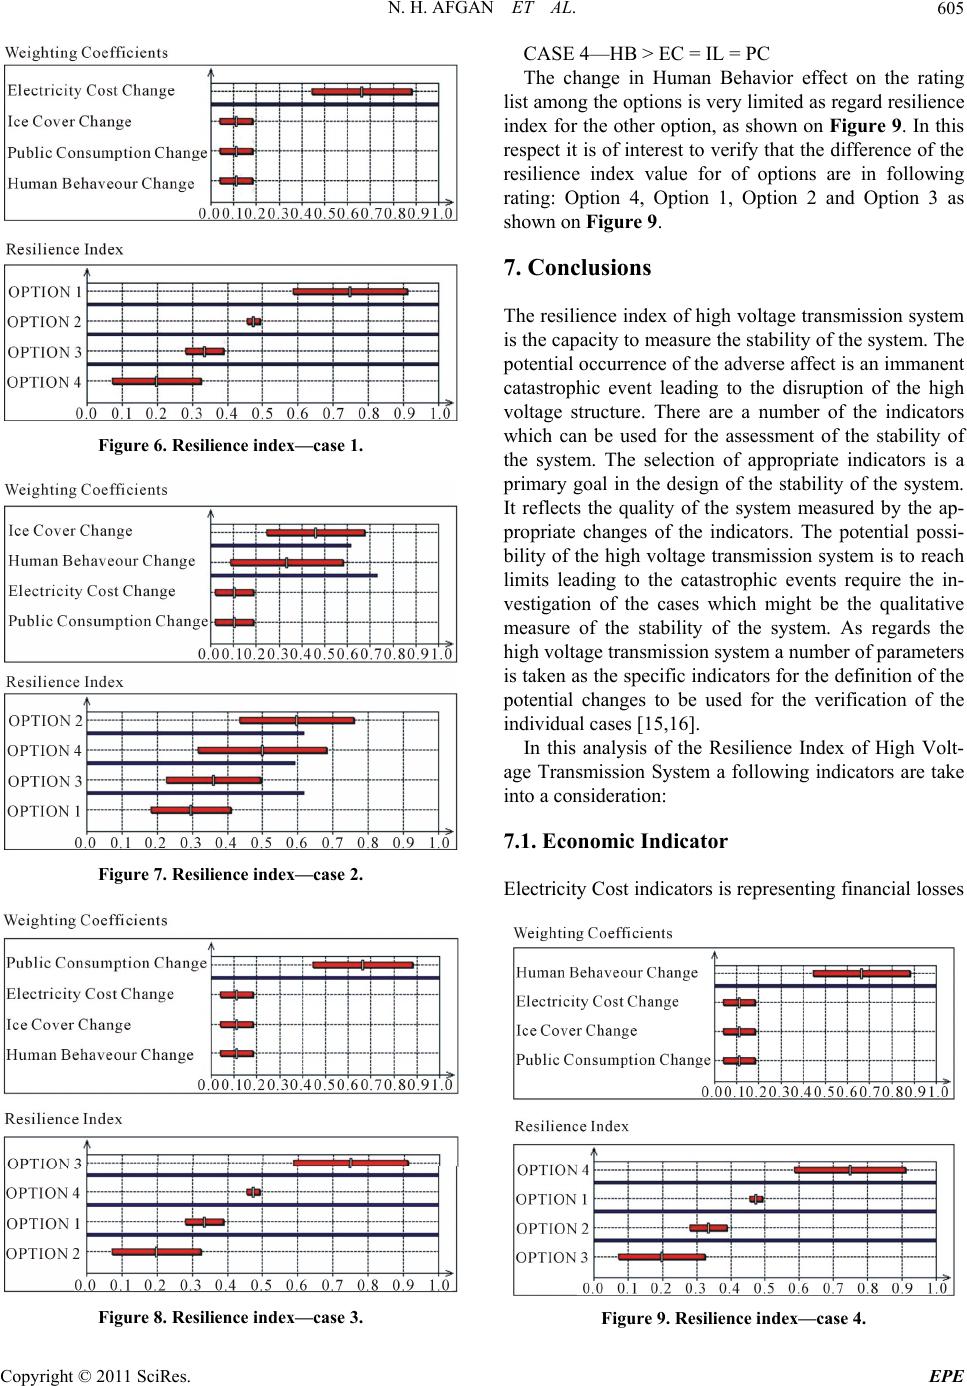 N. H. AFGAN ET AL.605 Figure 6. Resilience index—c ase 1. Figure 7. Resilience index—c ase 2. Figure 8. Resilience index—c ase 3. CASE 4—HB > EC = IL = PC The change in Human Behavior effect on the rating list among the options is very limited as regard resilience index for the other option, as shown on Figure 9. In this respect it is of interest to verify that the difference of the resilience index value for of options are in following rating: Option 4, Option 1, Option 2 and Option 3 as shown on Figure 9. 7. Conclusions The resilience index of high voltage transmission system is the capacity to measure the stability of the system. The potential occurrence of the adverse affect is an immanent catastrophic event leading to the disruption of the high voltage structure. There are a number of the indicators which can be used for the assessment of the stability of the system. The selection of appropriate indicators is a primary goal in the design of the stability of the system. It reflects the quality of the system measured by the ap- propriate changes of the indicators. The potential possi- bility of the high voltage transmission system is to reach limits leading to the catastrophic events require the in- vestigation of the cases which might be the qualitative measure of the stability of the system. As regards the high voltage transmission system a number of parameters is taken as the specific indicators for the definition of the potential changes to be used for the verification of the individual cases [15,16]. In this analysis of the Resilience Index of High Volt- age Transmission System a following indicators are take into a consideration: 7.1. Economic Indicator Electricity Cost indicators is representing financial losses Figure 9. Resilience index—c ase 4. Copyright © 2011 SciRes. EPE 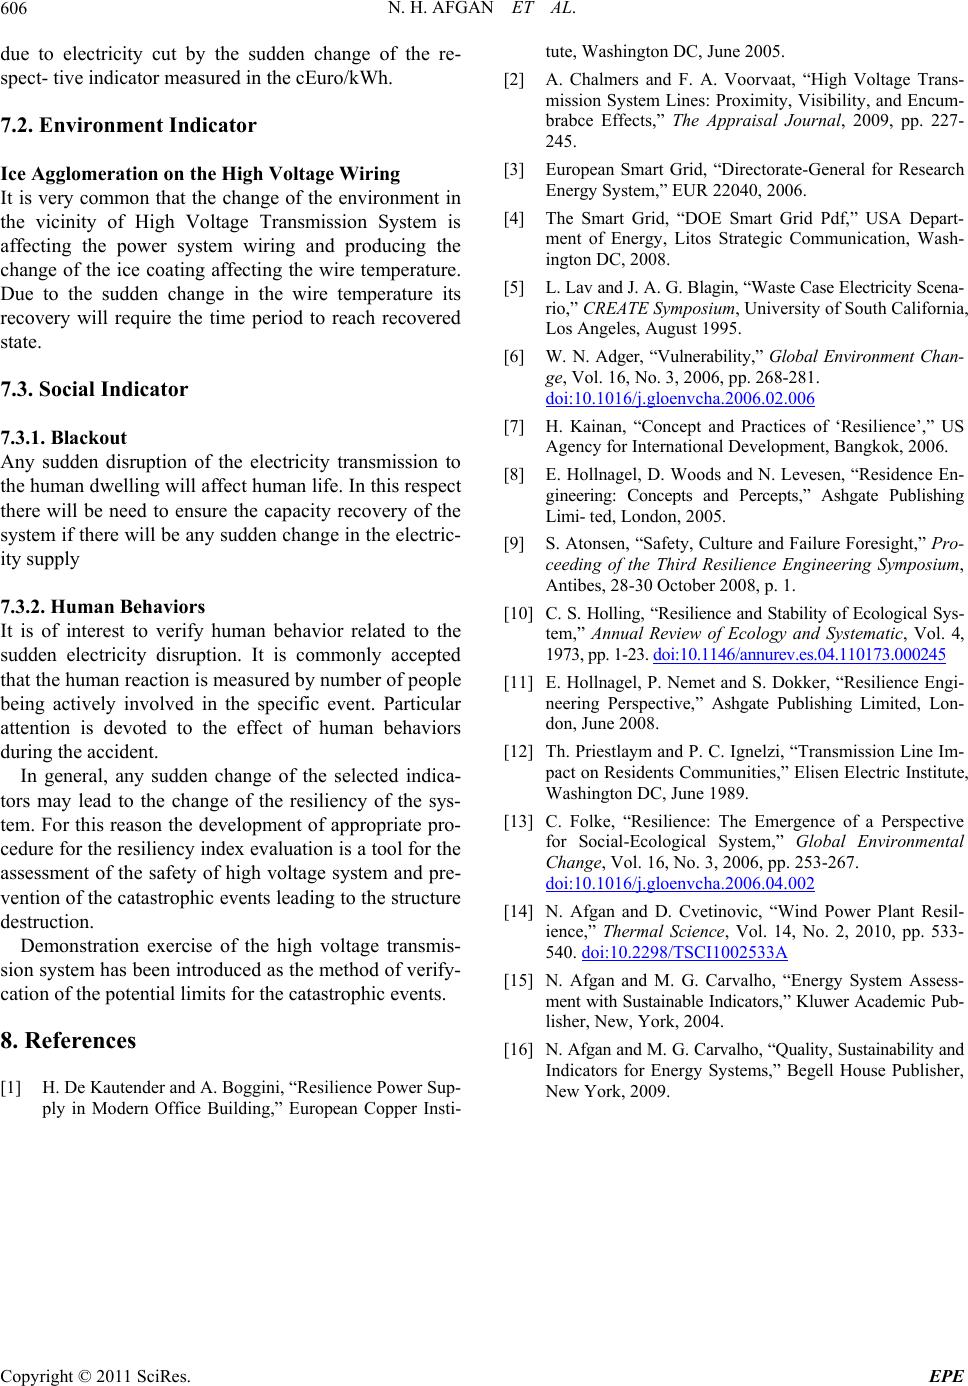 N. H. AFGAN ET AL. Copyright © 2011 SciRes. EPE 606 due to electricity cut by the sudden change of the re- spect- tive indicator measured in the cEuro/kWh. 7.2. Environment Indicator Ice Agglomeration on the High Voltage Wiring It is very common that the change of the environment in the vicinity of High Voltage Transmission System is affecting the power system wiring and producing the change of the ice coating affecting the wire temperature. Due to the sudden change in the wire temperature its recovery will require the time period to reach recovered state. 7.3. Social Indicator 7.3.1. Blackout Any sudden disruption of the electricity transmission to the human dwelling will affect human life. In this respect there will be need to ensure the capacity recovery of the system if there will be any sudden change in the electric- ity supply 7.3.2. Human Behaviors It is of interest to verify human behavior related to the sudden electricity disruption. It is commonly accepted that the human reaction is measured by number of people being actively involved in the specific event. Particular attention is devoted to the effect of human behaviors during the accident. In general, any sudden change of the selected indica- tors may lead to the change of the resiliency of the sys- tem. For this reason the development of appropriate pro- cedure for the resiliency index evaluation is a tool for the assessment of the safety of high voltage system and pre- vention of the catastrophic events leading to the structure destruction. Demonstration exercise of the high voltage transmis- sion system has been introduced as the method of verify- cation of the potential limits for the catastrophic events. 8. References [1] H. De Kautender and A. Boggini, “Resilience Power Sup- ply in Modern Office Building,” European Copper Insti- tute, Washington DC, June 2005. [2] A. Chalmers and F. A. Voorvaat, “High Voltage Trans- mission System Lines: Proximity, Visibility, and Encum- brabce Effects,” The Appraisal Journal, 2009, pp. 227- 245. [3] European Smart Grid, “Directorate-General for Research Energy System,” EUR 22040, 2006. [4] The Smart Grid, “DOE Smart Grid Pdf,” USA Depart- ment of Energy, Litos Strategic Communication, Wash- ington DC, 2008. [5] L. Lav and J. A. G. Blagin, “Waste Case Electricity Scena- rio,” CREATE Symposium, University of South California, Los Angeles, August 1995. [6] W. N. Adger, “Vulnerability,” Global Environment Chan- ge, Vol. 16, No. 3, 2006, pp. 268-281. doi:10.1016/j.gloenvcha.2006.02.006 [7] H. Kainan, “Concept and Practices of ‘Resilience’,” US Agency for International Development, Bangkok, 2006. [8] E. Hollnagel, D. Woods and N. Levesen, “Residence En- gineering: Concepts and Percepts,” Ashgate Publishing Limi- ted, London, 2005. [9] S. Atonsen, “Safety, Culture and Failure Foresight,” Pro- ceeding of the Third Resilience Engineering Symposium, Antibes, 28-30 October 2008, p. 1. [10] C. S. Holling, “Resilience and Stability of Ecological Sys- tem,” Annual Review of Ecology and Systematic, Vol. 4, 1973, pp. 1-23. doi:10.1146/annurev.es.04.110173.000245 [11] E. Hollnagel, P. Nemet and S. Dokker, “Resilience Engi- neering Perspective,” Ashgate Publishing Limited, Lon- don, June 2008. [12] Th. Priestlaym and P. C. Ignelzi, “Transmission Line Im- pact on Residents Communities,” Elisen Electric Institute, Washington DC, June 1989. [13] C. Folke, “Resilience: The Emergence of a Perspective for Social-Ecological System,” Global Environmental Change, Vol. 16, No. 3, 2006, pp. 253-267. doi:10.1016/j.gloenvcha.2006.04.002 [14] N. Afgan and D. Cvetinovic, “Wind Power Plant Resil- ience,” Thermal Science, Vol. 14, No. 2, 2010, pp. 533- 540. doi:10.2298/TSCI1002533A [15] N. Afgan and M. G. Carvalho, “Energy System Assess- ment with Sustainable Indicators,” Kluwer Academic Pub- lisher, New, York, 2004. [16] N. Afgan and M. G. Carvalho, “Quality, Sustainability and Indicators for Energy Systems,” Begell House Publisher, New York, 2009. |