

Paper Menu >>
Journal Menu >>
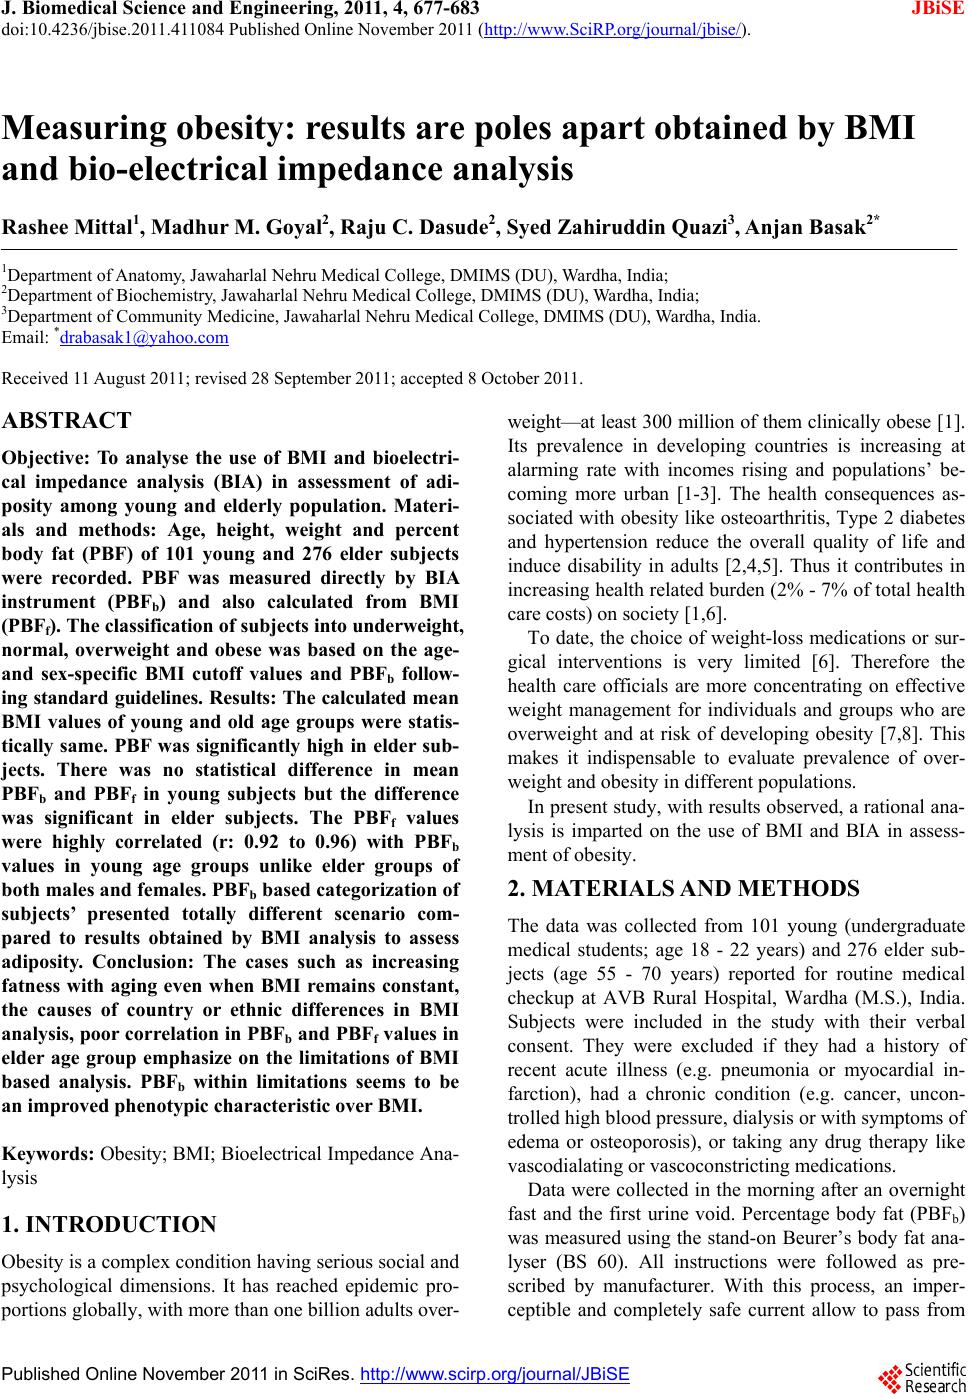 J. Biomedical Science and Engineering, 2011, 4, 677-683 doi:10.4236/jbise.2011.411084 Published Online November 2011 (http://www.SciRP.org/journal/jbise/ JBiSE ). Published Online November 2011 in SciRes. http://www.scirp.org/journal/JBiSE Measuring obesity: results are poles apart obtained by BMI and bio-electrical impedance analysis Rashee Mittal1, Madhur M. Goyal2, Raju C. Dasude2, Syed Zahiruddin Quazi3, Anjan Basak2* 1Department of Anatomy, Jawaharlal Nehru Medical College, DMIMS (DU), Wardha, India; 2Department of Biochemistry, Jawaharlal Nehru Medical College, DMIMS (DU), Wardha, India; 3Department of Community Medicine, Jawaharlal Nehru Medical College, DMIMS (DU), Wardha, India. Email: *[email protected] Received 11 August 2011; revised 28 September 2011; accepted 8 October 2011. ABSTRACT Objective: To analyse the use of BMI and bioelectri- cal impedance analysis (BIA) in assessment of adi- posity among young and elderly population. Materi- als and methods: Age, height, weight and percent body fat (PBF) of 101 young and 276 elder subjects were recorded. PBF was measured directly by BIA instrument (PBFb) and also calculated from BMI (PBFf). The classification of subjects into underweight, normal, overweight and obese was based on the age- and sex-specific BMI cutoff values and PBFb follow- ing standard guidelines. Results: The ca lculated mean BMI values of young and old age groups were statis- tically same. PBF was significantly high in elder sub- jects. There was no statistical difference in mean PBFb and PBFf in young subjects but the difference was significant in elder subjects. The PBFf values were highly correlated (r: 0.92 to 0.96) with PBFb values in young age groups unlike elder groups of both males and females. PBFb based categorization of subjects’ presented totally different scenario com- pared to results obtained by BMI analysis to assess adiposity. Conclusion: The cases such as increasing fatness with aging even when BMI remains constant, the causes of country or ethnic differences in BMI analysis, poor correlation in PBFb and PBFf values in elder age group emphasize on the limitations of BMI based analysis. PBFb within limitations seems to be an improved phenotypic char a cteristi c over BMI. Keywords: Obesity; BMI; Bioelectrical Impedance Ana- lysis 1. INTRODUCTION Obesity is a complex condition having serious social and psychological dimensions. It has reached epidemic pro- portions globally, with more than one billion adults over- weight—at least 300 million of them clinically obese [1]. Its prevalence in developing countries is increasing at alarming rate with incomes rising and populations’ be- coming more urban [1-3]. The health consequences as- sociated with obesity like osteoarthritis, Type 2 diabetes and hypertension reduce the overall quality of life and induce disability in adults [2,4,5]. Thus it contributes in increasing health related burden (2% - 7% of total health care costs) on society [1,6]. To date, the choice of weight-loss medications or sur- gical interventions is very limited [6]. Therefore the health care officials are more concentrating on effective weight management for individuals and groups who are overweight and at risk of developing obesity [7,8]. This makes it indispensable to evaluate prevalence of over- weight and obesity in different populations. In present study, with results observed, a rational ana- lysis is imparted on the use of BMI and BIA in assess- ment of obesity. 2. MATERIALS AND METHODS The data was collected from 101 young (undergraduate medical students; age 18 - 22 years) and 276 elder sub- jects (age 55 - 70 years) reported for routine medical checkup at AVB Rural Hospital, Wardha (M.S.), India. Subjects were included in the study with their verbal consent. They were excluded if they had a history of recent acute illness (e.g. pneumonia or myocardial in- farction), had a chronic condition (e.g. cancer, uncon- trolled high blood pressure, dialysis or with symptoms of edema or osteoporosis), or taking any drug therapy like vascodialating or vascoconstricting medications. Data were collected in the morning after an overnight fast and the first urine void. Percentage body fat (PBFb) was measured using the stand-on Beurer’s body fat ana- lyser (BS 60). All instructions were followed as pre- scribed by manufacturer. With this process, an imper- ceptible and completely safe current allow to pass from 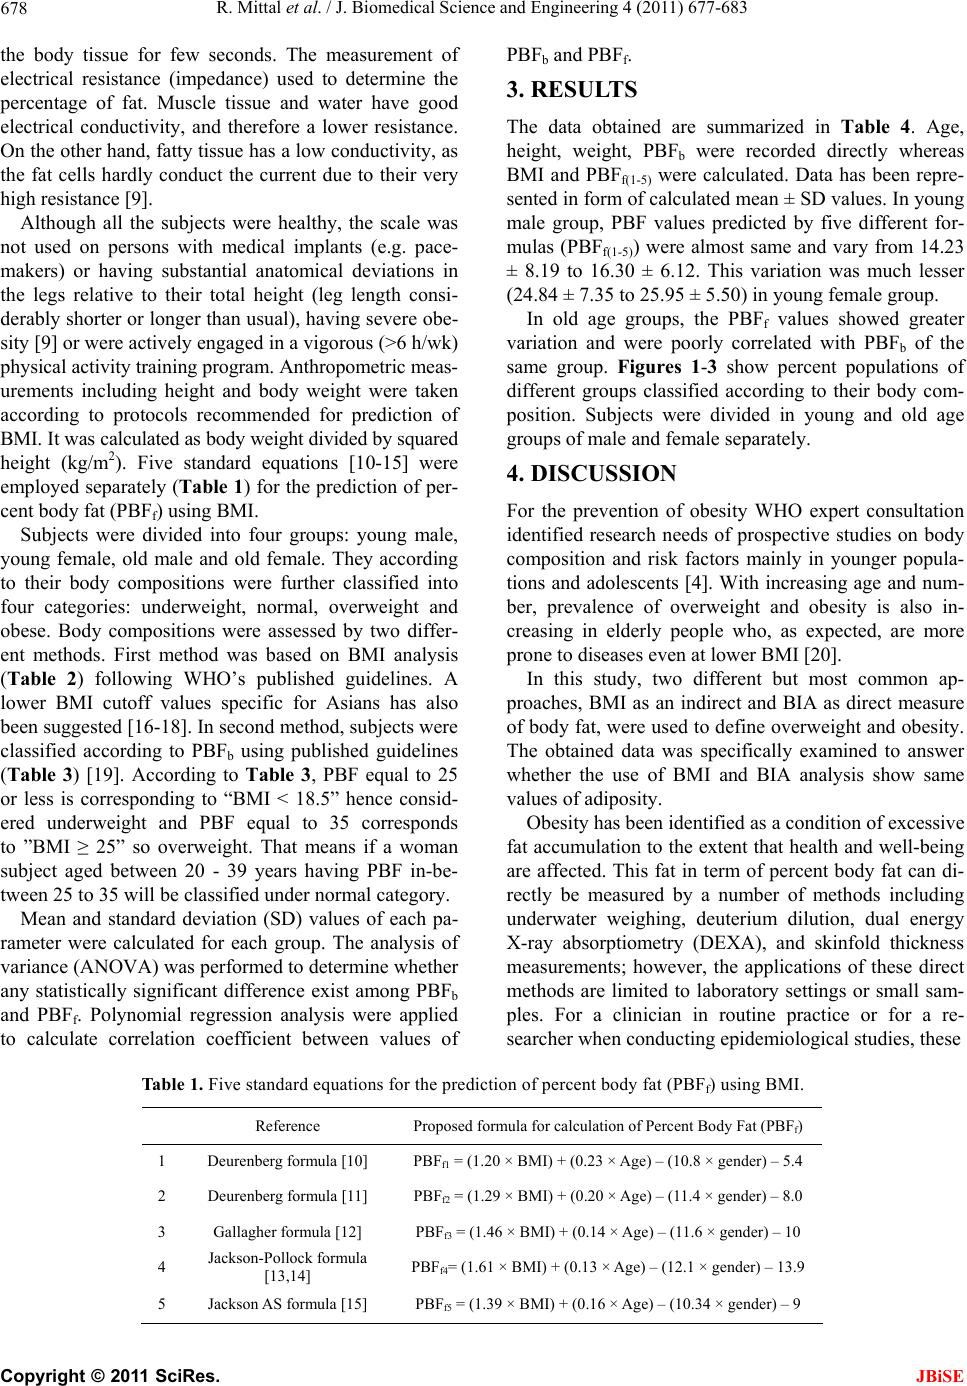 R. Mittal et al. / J. Biomedical Science and Engineering 4 (2011) 677-683 678 the body tissue for few seconds. The measurement of electrical resistance (impedance) used to determine the percentage of fat. Muscle tissue and water have good electrical conductivity, and therefore a lower resistance. On the other hand, fatty tissue has a low conductivity, as the fat cells hardly conduct the current due to their very high resistance [9]. Although all the subjects were healthy, the scale was not used on persons with medical implants (e.g. pace- makers) or having substantial anatomical deviations in the legs relative to their total height (leg length consi- derably shorter or longer than usual), having severe obe- sity [9] or were actively engaged in a vigorous (>6 h/wk) physical activity training program. Anthropometric meas- urements including height and body weight were taken according to protocols recommended for prediction of BMI. It was calculated as body weight divided by squared height (kg/m2). Five standard equations [10-15] were employed separately (Table 1) for the prediction of per- cent body fat (PBFf) using BMI. Subjects were divided into four groups: young male, young female, old male and old female. They according to their body compositions were further classified into four categories: underweight, normal, overweight and obese. Body compositions were assessed by two differ- ent methods. First method was based on BMI analysis (Table 2) following WHO’s published guidelines. A lower BMI cutoff values specific for Asians has also been suggested [16-18]. In second method, subjects were classified according to PBFb using published guidelines (Table 3) [19]. According to Table 3, PBF equal to 25 or less is corresponding to “BMI < 18.5” hence consid- ered underweight and PBF equal to 35 corresponds to ”BMI ≥ 25” so overweight. That means if a woman subject aged between 20 - 39 years having PBF in-be- tween 25 to 35 will be classified under normal category. Mean and standard deviation (SD) values of each pa- rameter were calculated for each group. The analysis of variance (ANOVA) was performed to determine whether any statistically significant difference exist among PBFb and PBFf. Polynomial regression analysis were applied to calculate correlation coefficient between values of PBFb and PBFf. 3. RESULTS The data obtained are summarized in Table 4. Age, height, weight, PBFb were recorded directly whereas BMI and PBFf(1-5) were calculated. Data has been repre- sented in form of calculated mean ± SD values. In young male group, PBF values predicted by five different for- mulas (PBFf(1-5)) were almost same and vary from 14.23 ± 8.19 to 16.30 ± 6.12. This variation was much lesser (24.84 ± 7.35 to 25.95 ± 5.50) in young female group. In old age groups, the PBFf values showed greater variation and were poorly correlated with PBFb of the same group. Figures 1-3 show percent populations of different groups classified according to their body com- position. Subjects were divided in young and old age groups of male and female separately. 4. DISCUSSION For the prevention of obesity WHO expert consultation identified research needs of prospective studies on body composition and risk factors mainly in younger popula- tions and adolescents [4]. With increasing age and num- ber, prevalence of overweight and obesity is also in- creasing in elderly people who, as expected, are more prone to diseases even at lower BMI [20]. In this study, two different but most common ap- proaches, BMI as an indirect and BIA as direct measure of body fat, were used to define overweight and obesity. The obtained data was specifically examined to answer whether the use of BMI and BIA analysis show same values of adiposity. Obesity has been identified as a condition of excessive fat accumulation to the extent that health and well-being are affected. This fat in term of percent body fat can di- rectly be measured by a number of methods including underwater weighing, deuterium dilution, dual energy X-ray absorptiometry (DEXA), and skinfold thickness measurements; however, the applications of these direct methods are limited to laboratory settings or small sam- ples. For a clinician in routine practice or for a re- searcher when conducting epidemiological studies, these Table 1. Five standard equations for the prediction of percent body fat (PBFf) using BMI. Reference Proposed formula for calculation of Percent Body Fat (PBFf) 1 Deurenberg formula [10] PBFf1 = (1.20 × BMI) + (0.23 × Age) – (10.8 × gender) – 5.4 2 Deurenberg formula [11] PBFf2 = (1.29 × BMI) + (0.20 × Age) – (11.4 × gender) – 8.0 3 Gallagher formula [12] PBFf3 = (1.46 × BMI) + (0.14 × Age) – (11.6 × gender) – 10 4 Jackson-Pollock formula [13,14] PBFf4= (1.61 × BMI) + (0.13 × Age) – (12.1 × gender) – 13.9 5 Jackson AS formula [15] PBFf5 = (1.39 × BMI) + (0.16 × Age) – (10.34 × gender) – 9 C opyright © 2011 SciRes. JBiSE 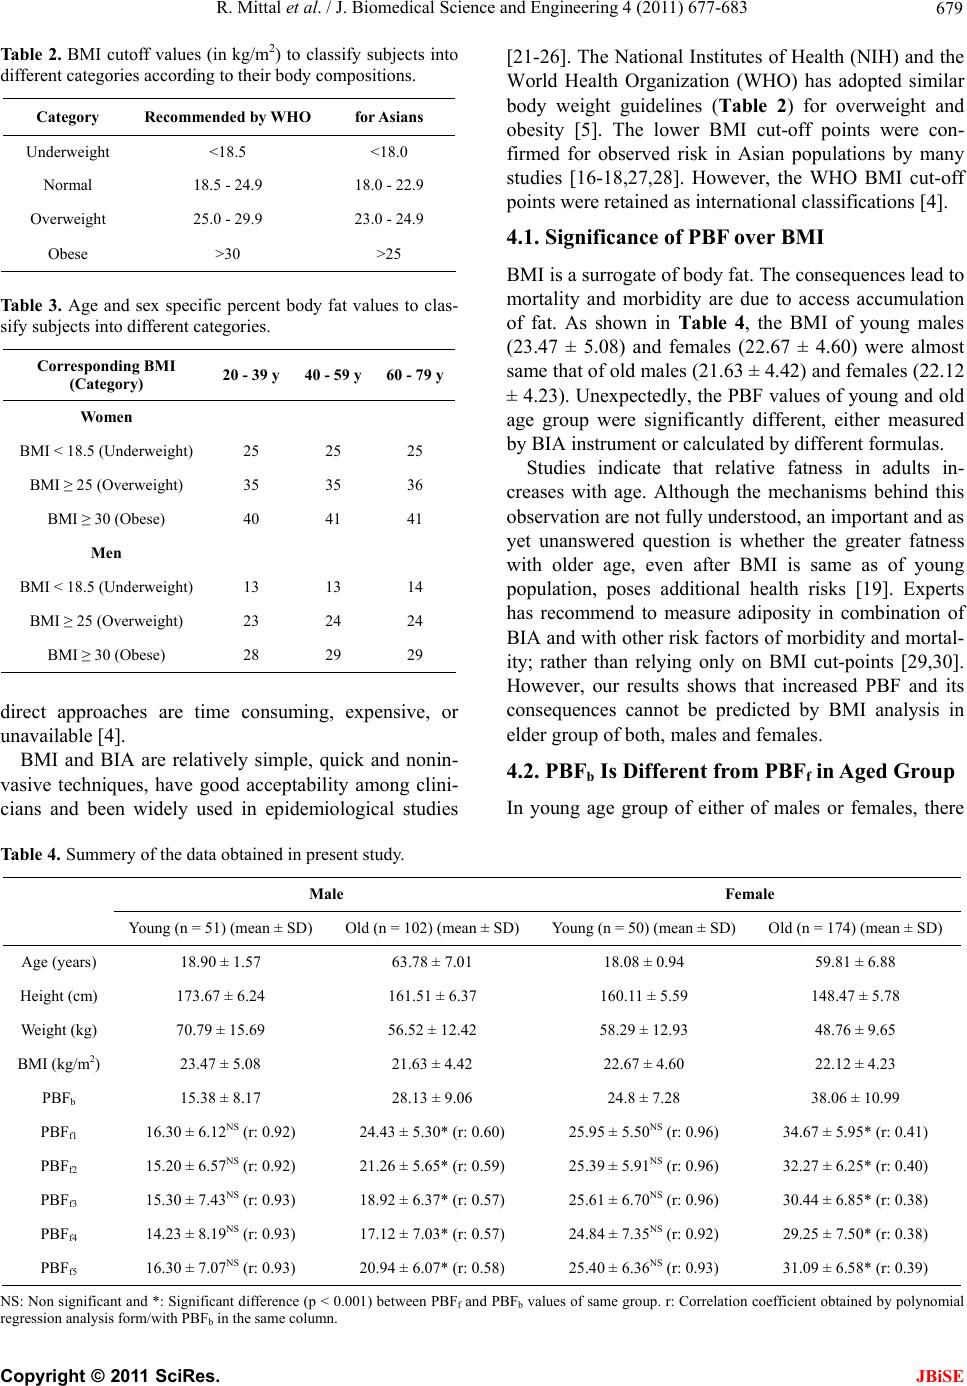 R. Mittal et al. / J. Biomedical Science and Engineering 4 (2011) 677-683 679 Tab le 2. BMI cutoff values (in kg/m2) to classify subjects into different categories according to their body compositions. Category Recommended by WHO for Asians Underweight <18.5 <18.0 Normal 18.5 - 24.9 18.0 - 22.9 Overweight 25.0 - 29.9 23.0 - 24.9 Obese >30 >25 Ta ble 3. Age and sex specific percent body fat values to clas- sify subjects into different categories. Corresponding BMI (Category) 20 - 39 y 40 - 59 y 60 - 79 y Women BMI < 18.5 (Underweight) 25 25 25 BMI ≥ 25 (Overweight) 35 35 36 BMI ≥ 30 (Obese) 40 41 41 Men BMI < 18.5 (Underweight) 13 13 14 BMI ≥ 25 (Overweight) 23 24 24 BMI ≥ 30 (Obese) 28 29 29 direct approaches are time consuming, expensive, or unavailable [4]. BMI and BIA are relatively simple, quick and nonin- vasive techniques, have good acceptability among clini- cians and been widely used in epidemiological studies [21-26]. The National Institutes of Health (NIH) and the World Health Organization (WHO) has adopted similar body weight guidelines (Table 2) for overweight and obesity [5]. The lower BMI cut-off points were con- firmed for observed risk in Asian populations by many studies [16-18,27,28]. However, the WHO BMI cut-off points were retained as international classifications [4]. 4.1. Significance of PBF over BMI BMI is a surrogate of body fat. The consequences lead to mortality and morbidity are due to access accumulation of fat. As shown in Table 4, the BMI of young males (23.47 ± 5.08) and females (22.67 ± 4.60) were almost same that of old males (21.63 ± 4.42) and females (22.12 ± 4.23). Unexpectedly, the PBF values of young and old age group were significantly different, either measured by BIA instrument or calculated by different formulas. Studies indicate that relative fatness in adults in- creases with age. Although the mechanisms behind this observation are not fully understood, an important and as yet unanswered question is whether the greater fatness with older age, even after BMI is same as of young population, poses additional health risks [19]. Experts has recommend to measure adiposity in combination of BIA and with other risk factors of morbidity and mortal- ity; rather than relying only on BMI cut-points [29,30]. However, our results shows that increased PBF and its consequences cannot be predicted by BMI analysis in elder group of both, males and females. 4.2. PBFb Is Different from PBFf in Aged Group In young age group of either of males or females, there Table 4. Summery of the data obtained in present study. Male Female Young (n = 51) (mean ± SD) Old (n = 102) (mean ± SD) Young (n = 50) (mean ± SD) Old (n = 174) (mean ± SD) Age (years) 18.90 ± 1.57 63.78 ± 7.01 18.08 ± 0.94 59.81 ± 6.88 Height (cm) 173.67 ± 6.24 161.51 ± 6.37 160.11 ± 5.59 148.47 ± 5.78 Weight (kg) 70.79 ± 15.69 56.52 ± 12.42 58.29 ± 12.93 48.76 ± 9.65 BMI (kg/m2) 23.47 ± 5.08 21.63 ± 4.42 22.67 ± 4.60 22.12 ± 4.23 PBFb 15.38 ± 8.17 28.13 ± 9.06 24.8 ± 7.28 38.06 ± 10.99 PBFf1 16.30 ± 6.12NS (r: 0.92) 24.43 ± 5.30* (r: 0.60) 25.95 ± 5.50NS (r: 0.96) 34.67 ± 5.95* (r: 0.41) PBFf2 15.20 ± 6.57NS (r: 0.92) 21.26 ± 5.65* (r: 0.59) 25.39 ± 5.91NS (r: 0.96) 32.27 ± 6.25* (r: 0.40) PBFf3 15.30 ± 7.43NS (r: 0.93) 18.92 ± 6.37* (r: 0.57) 25.61 ± 6.70NS (r: 0.96) 30.44 ± 6.85* (r: 0.38) PBFf4 14.23 ± 8.19NS (r: 0.93) 17.12 ± 7.03* (r: 0.57) 24.84 ± 7.35NS (r: 0.92) 29.25 ± 7.50* (r: 0.38) PBFf5 16.30 ± 7.07NS (r: 0.93) 20.94 ± 6.07* (r: 0.58) 25.40 ± 6.36NS (r: 0.93) 31.09 ± 6.58* (r: 0.39) NS: Non significant and *: Significant difference (p < 0.001) between PBFf and PBFb values of same group. r: Correlation coefficient obtained by polynomial regression analysis form/with PBFb in the same column. C opyright © 2011 SciRes. JBiSE 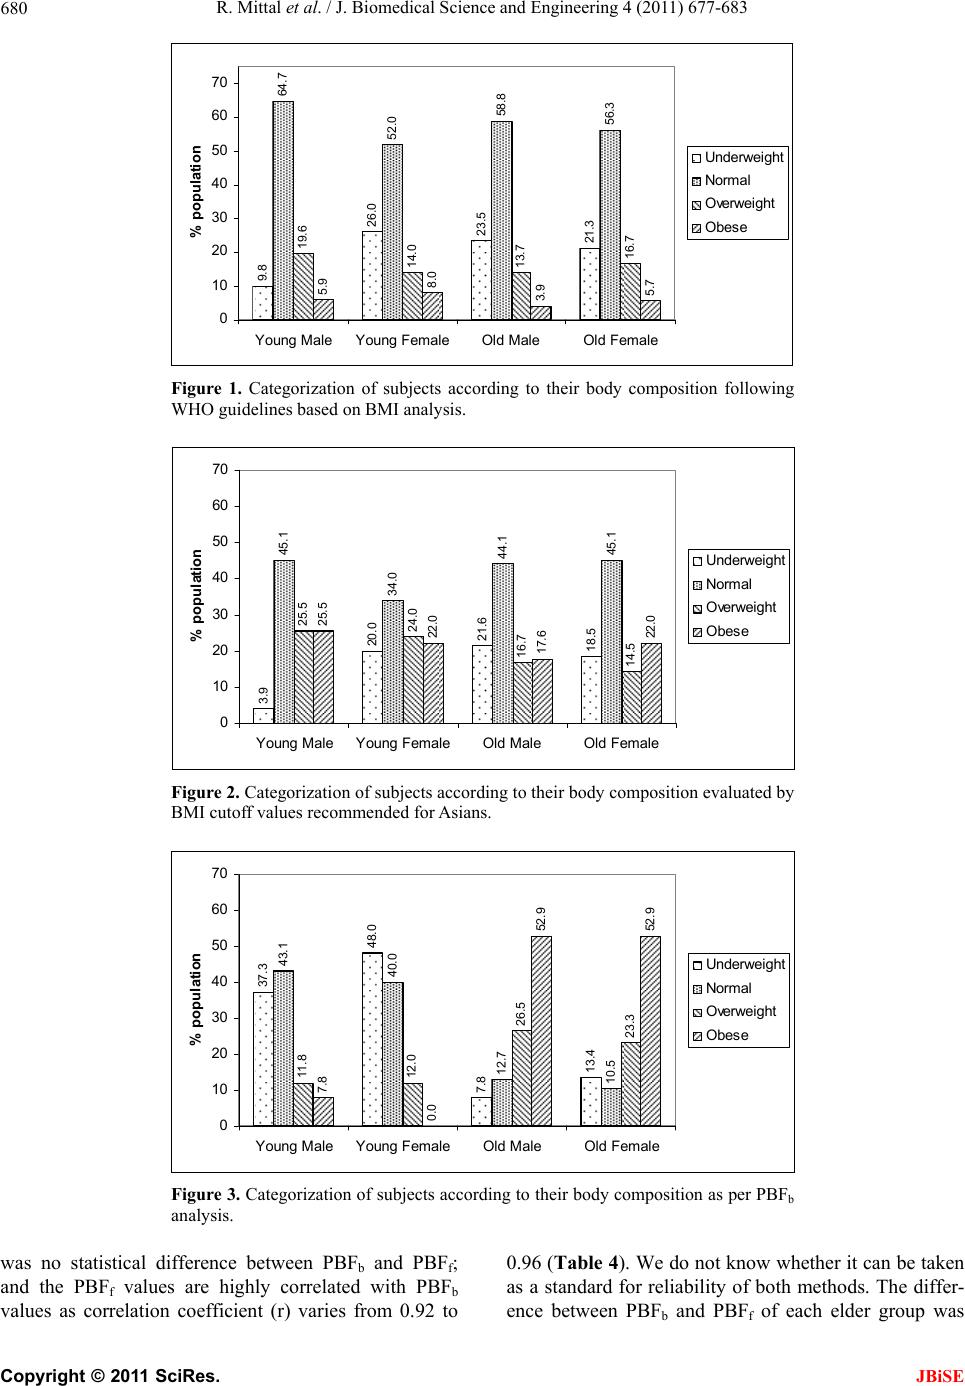 R. Mittal et al. / J. Biomedical Science and Engineering 4 (2011) 677-683 680 9.8 26.0 23.5 21.3 64.7 52.0 58.8 56.3 19.6 14.0 13.7 16.7 5.9 8.0 3.9 5.7 0 10 20 30 40 50 60 70 Y oung M al eYoung Fem al eOl d M al eOld F em al e % p opul ation Underweight Normal Overweight Obese Figure 1. Categorization of subjects according to their body composition following WHO guidelines based on BMI analysis. 3.9 20.0 21.6 18.5 45.1 34.0 44.1 45.1 25.5 24.0 16.7 14.5 25.5 22.0 17.6 22.0 0 10 20 30 40 50 60 70 Y oung Mal eY oung Fem al eOld M aleOld Female % popul ation Underweight Norma l Overwei g ht Obese Figure 2. Categorization of subjects according to their body composition evaluated by BMI cutoff values recommended for Asians. 37.3 48.0 7.8 13.4 43.1 40.0 12.7 10.5 11.8 12.0 26.5 23.3 7.8 0.0 52.9 52.9 0 10 20 30 40 50 60 70 Y oung M aleY oung F em al eOld M al eOld Fem al e % popul ation Underweight Normal Overweight Obese Figure 3. Categorization of subjects according to their body composition as per PBFb analysis. was no statistical difference between PBFb and PBFf; and the PBFf values are highly correlated with PBFb values as correlation coefficient (r) varies from 0.92 to 0.96 (Table 4). We do not know whether it can be taken as a standard for reliability of both methods. The differ- ence between PBFb and PBFf of each elder group was C opyright © 2011 SciRes. JBiSE  R. Mittal et al. / J. Biomedical Science and Engineering 4 (2011) 677-683 681 highly significant and the formula values (PBFf) did not or poorly correlated with PBFb. Perhaps, the formulas were derived on young populations; and elder popula- tions were ignored during the development of standard equations. The BMI scale cannot be generalized for all popula- tions [4]. It was recommended to modify BMI cutoff value for different ethnic groups in relation of risk fac- tors and other consequences associated with obesity [16,31]. It is interesting to see, as present work shows that even in same population BMI could not predict PBF (PBFf) accurately in different (elder) age groups. 4.3. Classification Gives Opposite Results The subjects were classified into four groups as per dif- ferent recommendations (Figures 1-3). The bar dia- grams illustrate that all three approaches give different results. According to Figure 1, about 52% - 65% popu- lation of different groups had normal body composition, less than 20% were overweight and less than 10% were obese. 9.8% young males, 26% young females, 23.5% old males and 21.3% old females were underweight. As per BMI cut off values recommended for Asians [17], percent population having normal body composi- tion was reduced to range of 34% - 45% in all four groups (Figure 2). The number of overweight and obese had increased significantly. It was quite unexpected that PBFb based categoriza- tion present totally different scenario. As shown in Fig- ure 3, among young subjects maximum population was almost equally distributed in underweight and normal category. Less than 12% subjects were overweight and less than 8% were obese. In case of elder subjects, maxi- mum (about 53%) were obese, 23% - 27% were over- weight, upto 14% were underweight and about 13% were under normal category. These results were poles apart with those, were obtained from BMI based analysis. 4.4. Limitations of BIA Studies indicate that PBF measured by BIA is highly correlated with visceral and subcutaneous adipose tissue in both genders, being reasonably effective in discrimi- nating the presence or absence of excess visceral fat alone or associated with overweight/obesity [22]. Still, it is not the gold standard method for estimation of body fat. There are 2 or 3 subtypes also available in BIA analysis whose relative accuracy is again matter of de- bate [31,32]. The optimum situation (having gold stan- dard method) was not possible in the present study and it is likely that in routine practice or any large-scale study clinicians would face similar methodological issues. However, exclusion criteria were designed to cover all possible limitations of BIA analysis [33]. It was recently identified the need of a feasible tool which can differentiate individual with benign obesity from non-benign obese individual [34]. 4.5. Strength of the Study Though our findings are not very much new but evoke an important issue on the use of BMI based analysis in routine clinical practice and in many research reports [35,36]. BMI based analysis is in use without consider- ing age, sex and ethnic variations among subjects. Few reports which declare good correlation of BMI analysis with other methods of body fat evaluation were con- ducted on children or young population [37,38]. It was recently confirmed that the use of BMI as a measure of obesity can introduce misclassification prob- lems [39,40]. Our results make further addition that BMI cutoff values developed for an ethnic group can misclas- sify elder subjects even in the same population. The increase body fat does not drive clinician towards treatment of obesity until and unless presence of any symptomatic disease that may improve with weight loss. However, increased values of body fat may inspire older as well as in younger adults for voluntary weight loss which may help to prevent the adverse health conse- quences of obesity. Accurate body fat measurement is also required in studies on the pharmacokinetics of drugs in humans. We acknowledge the fact that our subjects, by necessity, were a convenient sample and may not be representative of the population from which they were recruited. 5. CONCLUSIONS The cases such as increasing fatness with aging even when BMI remains constant, the causes of country or ethnic differences in BMI analysis, poor correlation in PBFb and PBFf values in elder age group emphasize on the limitations of BMI based analysis. The healthy range of PBF needs to be validated in different populations and other methodological problems are yet to be overcome. There is a requirement of a method with nominal sensi- tivity and specificity which can be opted for routine clinical practice and for population study to evaluate body composition according to adiposity without getting affected with factors like age, sex and ethnicity. Being associated with Clinical Biochemistry, authors expect that it would be a biochemical parameter which can identify and quantify healthy range of adiposity. Till that PBFb can be taken as an improved phenotypic character- istic over BMI when functionality and mortality risk are considered. 6. ACKNOWLEDGEMENTS The financial support by Datta Meghe Institute of Medical Sciences C opyright © 2011 SciRes. JBiSE  R. Mittal et al. / J. Biomedical Science and Engineering 4 (2011) 677-683 682 (Deemed University), Wardha (MS), INDIA, is thankfully acknowl- edged. REFERENCES [1] Obesity and overweight fact sheet, (2003) WHO. http://www.who.int/dietphysicalactivity/publications/fact s/obesity/en/ [2] Goh, V.H., Tain, C.F., Tong, T.Y., et al. (2004) Are BMI and other anthropometric measures appropriate as indices for obesity?—A study in an Asian population. Journal of Lipid Research, 45, 1892-1898. doi:10.1194/jlr.M400159-JLR200 [3] Sood, A., Sundararaj, P., Sharma, S., et al. (2007) BMI and body fat percent: Affluent adolescent girls in Banga- lore city. Indian Pediatrics, 44, 587-591. [4] WHO expert consultation. (2004) Appropriate body-mass index for Asian populations and its implications for pol- icy and intervention strategies. Lancet, 363, 157-63. [5] Clinical guidelines on the identification, evaluation and treatment of overweight and obesity in adults. (1998) The Evidence Report, NIH Publication no. 98-4083 (8), Be- thesda. [6] Aronne, L.J., Brown, W.V. and Isoldi, K.K. (2007) Car- diovascular disease in obesity: A review of related risk factors and risk-reduction strategies. Journal of Clinical Lipidology, 1, 575-582. doi:10.1016/j.jacl.2007.10.005 [7] Tsigos, C., Hainer, V., Basdevant, A., et al. (2008) For the obesity management task force of the european Asso- ciation for the study of obesity. Management of obesity in adults: European clinical practice guidelines. Obesity Facts, 1, 106-116. doi:10.1159/000126822 [8] EASO Secretariat, Society Bulletins (2009) Statement by members of the task force on prevention and public health of the European Association for the Study of Obe- sity (EASO). Obesity Facts, 2, 54-55. [9] Deurenberg, P. (1996) Limitations of the bioelectrical impedance method for the assessment of body fat in se- vere obesity. American Journal of Clinical Nutrition, 64, 4495-4452. [10] Deurenberg, P., Westrate, J.A. and Seidell, J.C. (1991) Body mass index as a measure of body fatness: Age- and sex-specific prediction formulas. British Journal of Nu- trition, 65, 105-114. doi:10.1079/BJN19910073 [11] Deurenberg, P., Yap, M. and van Staveren, W.A. (1998) Body mass index and percent body fat. A meta analysis among different ethnic groups. International Journal of Obesity, 22, 1164-1171. doi:10.1038/sj.ijo.0800741 [12] Gallagher, D., Visser, M., Sepulveda, D., et al. (1996) How useful is body mass index for comparison of body fatness across age, sex and ethnic groups. American Journal of Epidemiology, 143, 228-239. [13] Jackson, A.S., Pollock, M.L. and Ward, A. (1980) Gener- alized equations for predicting body density of women. Medicine & Science in Sports & Exercise, 12, 175-182. doi:10.1249/00005768-198023000-00009 [14] Jackson, A.S. (1984) Research design and analysis of data procedures for predicting body density. Medicine & Science in Sports & Exercise, 16, 616-620. doi:10.1249/00005768-198412000-00018 [15] Jackson, A.S., Stanforth, P.R. and Gagnon, J. (2002) The effect of sex, age and race on estimating percentage body fat from body mass index: The heritage family study. In- ternational Journal of Obesity and Related Metabolic Disorders, 26, 789-96. [16] Snehalatha, C., Viswanathan, V. and Ramachandran, A. (2003) Cutoff values for normal anthropometric variables in Asian Indian adults. Diabetes Care, 26, 1380-1384. doi:10.2337/diacare.26.5.1380 [17] Misra, A., Pandey, R.M., Sinha, S., et al. (2003) Receiver operating characteristics curve analysis of body fat & body mass index in dyslipidaemic Asian Indians. Indian Journal of Medical Research, 117, 170-179. [18] Misra, A. (2003) Revisions of cutoffs of body mass index to define overweight and obesity are needed for the Asian-ethnic groups. International Journal of Obesity, 27, 1294-1296. doi:10.1038/sj.ijo.0802412 [19] Gallagher, D., Heymsfield, S.B., Heo, M., et al. (2000) Healthy percentage body fat ranges: An approach for de- veloping guidelines based on body mass index. American Journal of Clinical Nutrition, 72, 694-701. [20] Kawamoto, R., Ohtsuka, N., Ninomiya, D. and Naka- mura, S. (2008) Association of obesity and visceral fat distribution with intima-media thickness of carotid arter- ies in middle-aged and older persons. Internal Medicine, 47, 143-149. doi:10.2169/internalmedicine.47.0478 [21] Lee, K., Lee, S., Kim, S.Y. et al. (2007) Percent body fat cutoff values for classifying overweight and obesity recommended by the International Obesity Task Force (IOTF) in Korean children. Asia Pacific Journal of Clinical Nutrition, 16, 649-655. [22] Fernandes, R.A., Rosa, C.S.C., Buonani, C., et al. (2007) The use of bioelectrical impedance to detect excess vis- ceral and subcutaneous fat. Journal de Pediatrica, 83, 529-534. doi:10.2223/JPED.1722 [23] Lohman, T.G., Caballero, B., Himes, J.H. et al. (1999) Body composition assessment in American Indian chil- dren. American Journal of Clinical Nutrition, 69, 764S- 766S. [24] Sung, R.Y.T., Lau, P., Yu, C.W. et al. (2001) Measure- ment of body fat using leg to leg bioimpedance. Archives of Disease in Childhood, 85, 263-267. doi:10.1136/adc.85.3.263 [25] Caballero, B., Himes, J.H., Lohman, T., et al. (2003) for the Pathways Study Research Group. Body composition and overweight prevalence in 1704 schoolchildren from 7 American Indian communities. American Journal of Clinical Nutrition, 78, 308-312. [26] Bioelectrical Impedance Analysis in Body Composition Measurement (1994). National Institutes of Health Tech- nology Assessment Conference Statement, 12-14 Dece- mber, 1-35. [27] Ko, G.T.C., Tang, J., Chan, J.C.N., et al. (2001). Lower BMI cut-off value to define obesity in Hong Kong Chi- nese: An analysis based on body fat assessment by bio- electrical impedance. British Journal of Nutrition, 85, 239-242. doi:10.1079/BJN2000251 [28] Gallagher, D. (2004) Overweight and obesity BMI cut- offs and their relation to metabolic disorders in Kore- ans/Asians. Obesity Researc h, 12, 440-441. [29] Bhat, D.S., Yajnik, C.S., Sayyad, M.G., et al. (2005) Body fat measurement in Indian men: comparison of three methods based on a two-compartment model. In- C opyright © 2011 SciRes. JBiSE  R. Mittal et al. / J. Biomedical Science and Engineering 4 (2011) 677-683 Copyright © 2011 SciRes. 683 JBiSE ternational Journal of Obesity, 29, 842-848. doi:10.1038/sj.ijo.0802953 [30] Widhalm, K., Schoenegger, K., Huemer, C. and Auterith, A. (2001) Does the BMI reflect body fat in obese chil- dren and adolescents? A study using the TOBEC method. International Journal of Obesity, 25, 2790-285. [31] Dehghan, M. and Merchant, A.T. (2008) Is bioelectrical impedance accurate for use in large epidemiological studies? Nutrition Journal, 7, 26-32. doi:10.1186/1475-2891-7-26 [32] Westphala, A.B., Latera, W., Hitzea, B., et al. (2008) Accuracy of bioelectrical impedance consumer devices for measurement of body composition in comparison to whole body magnetic resonance imaging and dual X-ray absorptiometry. Obesity Facts, 1, 319-324. [33] Kyle, U.G., Bosaeus, I., De Lorenzo, A.D., et al. (2004) ESPEN. Bioelectrical impedance analysis-part II: Utili- zation in clinical practice. Clinical Nutrition, 23, 1430- 1453. doi:10.1016/j.clnu.2004.09.012 [34] Mullera, M.J. and Hebebrandb, J. (2008) Should we really treat every obese individual? Obesity Facts, 1, 287- 291. [35] Bharati, D.R., Deshmukh, P.R. and Garg, B.S. (2008) Correlates of overweight & obesity among school going children of Wardha city, Central India. Indian Journal of Medical Research., 127, 539-543. [36] Lejnieks, A., Kalvelis, A., Bahs, G., et al. (2008) Correla- tion of obesity indicators with other cardiovascular risk factors. Journal of Clinical Lipidology, 2, S42-S43. doi:10.1016/j.jacl.2008.08.096 [37] Tyrrell, V.J., Richards, G.E., Hofman, P., et al. (2001) Obesity in Auckland school children: A comparison of the body mass index and percentage body fat as the di- agnostic criterion. International Journal of Obesity, 25, 164- 169. doi:10.1038/sj.ijo.0801532 [38] Sampei, M.A., Novo, N.F., Juliano, Y. and Sigulem, D.M. (2001) Comparison of the body mass index to other methods of body fat evaluation in ethnic Japanese and Caucasian adolescent girls. International Journal of Obesity, 25, 400-408. doi:10.1038/sj.ijo.0801558 [39] Rothman, K.J. (2008) BMI-related errors in the meas- urement of obesity. International Journal of Obesity, 32, S56-S59. doi:10.1038/ijo.2008.87 [40] Nikolaou, V., Tsiafoutis, I., Crinos, X., et al. (2008) Meta- bolic syndrome: Correlation of BMI and central type obesity. Journal of Clinical Lipidology, 2, S101. doi:10.1016/j.jacl.2008.08.221 |