

Paper Menu >>
Journal Menu >>
 Materials Science s a nd Applications, 2011, 2, 1556-1563 doi:10.4236/msa.2011.211208 Published Online November 2011 (http://www.SciRP.org/journal/msa) Copyright © 2011 SciRes. MSA Influence of Degree of Cold-Drawing on the Mechanical Properties of Low Carbon Steel Nurudeen A. Raji, Oluleke O. Oluwole Department of Mechanical Engineering, University of Ibadan, Ibadan, Nigeria. Email: [email protected], [email protected] Received July 27th, 2011; revised September 13th, 2011; accepted September 22nd, 2011. ABSTRACT Low carbon steel metal is used for the manufacture of nails. Steel wire with <0.3% C content is cold-drawn through a series of drawing dies to reduce the diameter of the wire to the required diameter of the nails. A 0.12%w C steel wire cold drawn progressively by 20%, 25%, 40% and 50% was investigated. The influence of the degree of cold drawing on the mechanical properties of the carbon steel material were studied using the tensile test, impact test and hardness test experiments in order to replicate the service condition of the nails. The tensile test was done on a Montanso® tensome- ter to investigate the yield strength and the tensile strength of the material as the degree of deformation increases. An Izod test was used to determine the impact toughness of the steel using the Hounsfield impact machine and the hardness numbers were obtained for the different degrees of drawn deformation of the steel on the Brinnel tester. The study used the stress-strain relationship of the tensile test experiment to study the effect of the degree of cold-drawing deformation on the yield strength and tensile strength properties of the low carbon steel. The yield strength of the material was ob- served to reduce with increasing degree of cold-drawing, an indication of reduction in the ductility and the tensile strength of the material reduced with increasing degree of cold-drawn deformation. The ability of the material to resist impact loads when nails are hammered reduced with increasing degree of drawn deformation as a result of strain hardening of the material after the drawing operation. However the resilience of the material to further cold drawn deformation increased with increasing degree of deformation as evident in the Brinnel hardness number which in- creases with the degree of drawing deformation. This is an indication of the material’s approach to brittleness as the degree of drawn deformation increases. Keywords: Cold-Drawn, Deformation, Stress-Strain, Toughness, Yield Strength, Tensile Strength 1. Introduction The mechanical properties of a material are those related to its ability to withstand external mechanical forces. Metals can undergo substantial permanent deformation. This characteristic property of materials makes it feasible to shaping. However, it imposes some limitations on the engineering usefulness of such materials. Permanent de- formation is due to process of shear where particles change their neighbors. Nail manufacture from low car- bon steels involve cold drawing deformation resulting in plastic flow of the material. In drawing deformation, the metal is strain hardened that is strength and hardness increases with the degree of cold work whilst ductility and impact values are lowered and unstable defect struc- tures are retained after deformation [1]. This drawing process is considered to be one of the most effective and flexible methods to improve surface finish, to obtain pre- cise dimension and to obtain the specified mechanical properties of a product [2]. The structural changes which occur during the cold deformation of metals include the gradual stretching of the grains in the direction of prin- cipal deformation and directional arrangement of the crystallographic lattice [3,4]. The effect of such cold work on the properties of polycrystalline structures have been studied extensively [5-18]. The cold work process of wire drawing consists of reducing the cross-section of a wire by pulling the wire through series of conical dies [19]. Metal wire drawing technology has been widely used to manufacture fine wires [20,21]. When the defor- mation amount is very significant, the wire generates microstructure heterogeneities that may exhibit large orientation gradients and stored energies [22]. Also the microstructure presents a morphological texture where the grains are lengthened along the wire drawing axis [3,11,12]. Microstructure changes occurring during wire 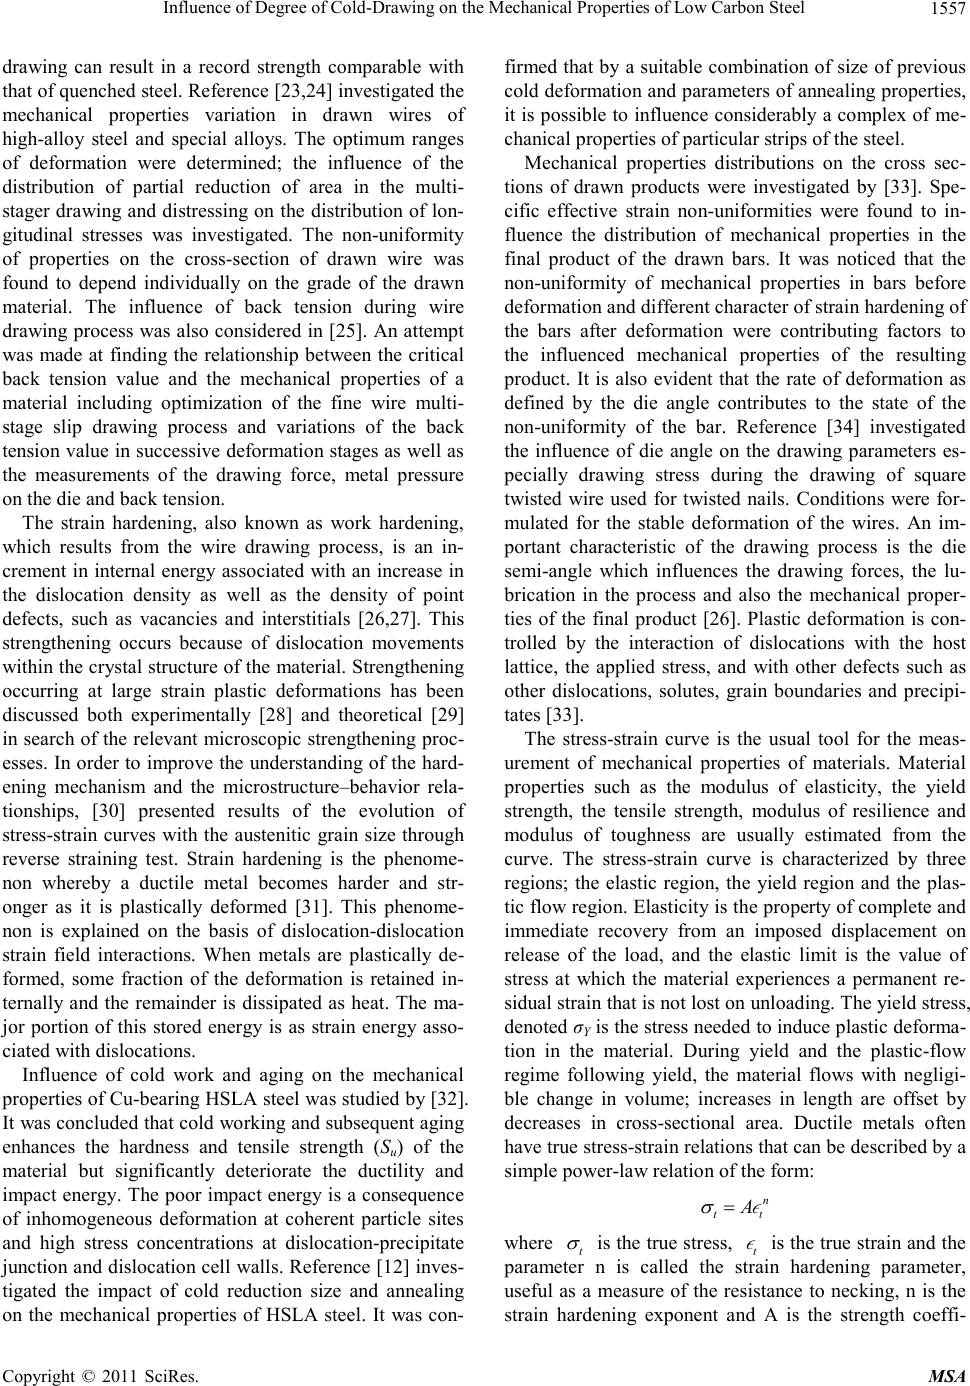 Influence of Degree of Cold-Drawing on the Mechanical Properties of Low Carbon Steel1557 drawing can result in a record strength comparable with that of quenched steel. Reference [23,24] investigated the mechanical properties variation in drawn wires of high-alloy steel and special alloys. The optimum ranges of deformation were determined; the influence of the distribution of partial reduction of area in the multi- stager drawing and distressing on the distribution of lon- gitudinal stresses was investigated. The non-uniformity of properties on the cross-section of drawn wire was found to depend individually on the grade of the drawn material. The influence of back tension during wire drawing process was also considered in [25]. An attempt was made at finding the relationship between the critical back tension value and the mechanical properties of a material including optimization of the fine wire multi- stage slip drawing process and variations of the back tension value in successive deformation stages as well as the measurements of the drawing force, metal pressure on the die and back tension. The strain hardening, also known as work hardening, which results from the wire drawing process, is an in- crement in internal energy associated with an increase in the dislocation density as well as the density of point defects, such as vacancies and interstitials [26,27]. This strengthening occurs because of dislocation movements within the crystal structure of the material. Strengthening occurring at large strain plastic deformations has been discussed both experimentally [28] and theoretical [29] in search of the relevant microscopic strengthening proc- esses. In order to improve the understanding of the hard- ening mechanism and the microstructure–behavior rela- tionships, [30] presented results of the evolution of stress-strain curves with the austenitic grain size through reverse straining test. Strain hardening is the phenome- non whereby a ductile metal becomes harder and str- onger as it is plastically deformed [31]. This phenome- non is explained on the basis of dislocation-dislocation strain field interactions. When metals are plastically de- formed, some fraction of the deformation is retained in- ternally and the remainder is dissipated as heat. The ma- jor portion of this stored energy is as strain energy asso- ciated with dislocations. Influence of cold work and aging on the mechanical properties of Cu-bearing HSLA steel was studied by [32]. It was concluded that cold working and subsequent aging enhances the hardness and tensile strength (Su) of the material but significantly deteriorate the ductility and impact energy. The poor impact energy is a consequence of inhomogeneous deformation at coherent particle sites and high stress concentrations at dislocation-precipitate junction and dislocation cell walls. Reference [12] inves- tigated the impact of cold reduction size and annealing on the mechanical properties of HSLA steel. It was con- firmed that by a suitable combination of size of previous cold deformation and parameters of annealing properties, it is possible to influence considerably a complex of me- chanical properties of particular strips of the steel. Mechanical properties distributions on the cross sec- tions of drawn products were investigated by [33]. Spe- cific effective strain non-uniformities were found to in- fluence the distribution of mechanical properties in the final product of the drawn bars. It was noticed that the non-uniformity of mechanical properties in bars before deformation and different character of strain hardening of the bars after deformation were contributing factors to the influenced mechanical properties of the resulting product. It is also evident that the rate of deformation as defined by the die angle contributes to the state of the non-uniformity of the bar. Reference [34] investigated the influence of die angle on the drawing parameters es- pecially drawing stress during the drawing of square twisted wire used for twisted nails. Conditions were for- mulated for the stable deformation of the wires. An im- portant characteristic of the drawing process is the die semi-angle which influences the drawing forces, the lu- brication in the process and also the mechanical proper- ties of the final product [26]. Plastic deformation is con- trolled by the interaction of dislocations with the host lattice, the applied stress, and with other defects such as other dislocations, solutes, grain boundaries and precipi- tates [33]. The stress-strain curve is the usual tool for the meas- urement of mechanical properties of materials. Material properties such as the modulus of elasticity, the yield strength, the tensile strength, modulus of resilience and modulus of toughness are usually estimated from the curve. The stress-strain curve is characterized by three regions; the elastic region, the yield region and the plas- tic flow region. Elasticity is the property of complete and immediate recovery from an imposed displacement on release of the load, and the elastic limit is the value of stress at which the material experiences a permanent re- sidual strain that is not lost on unloading. The yield stress, denoted σY is the stress needed to induce plastic deforma- tion in the material. During yield and the plastic-flow regime following yield, the material flows with negligi- ble change in volume; increases in length are offset by decreases in cross-sectional area. Ductile metals often have true stress-strain relations that can be described by a simple power-law relation of the form: n tt A where t is the true stress, t is the true strain and the parameter n is called the strain hardening parameter, useful as a measure of the resistance to necking, n is the strain hardening exponent and A is the strength coeffi- Copyright © 2011 SciRes. MSA 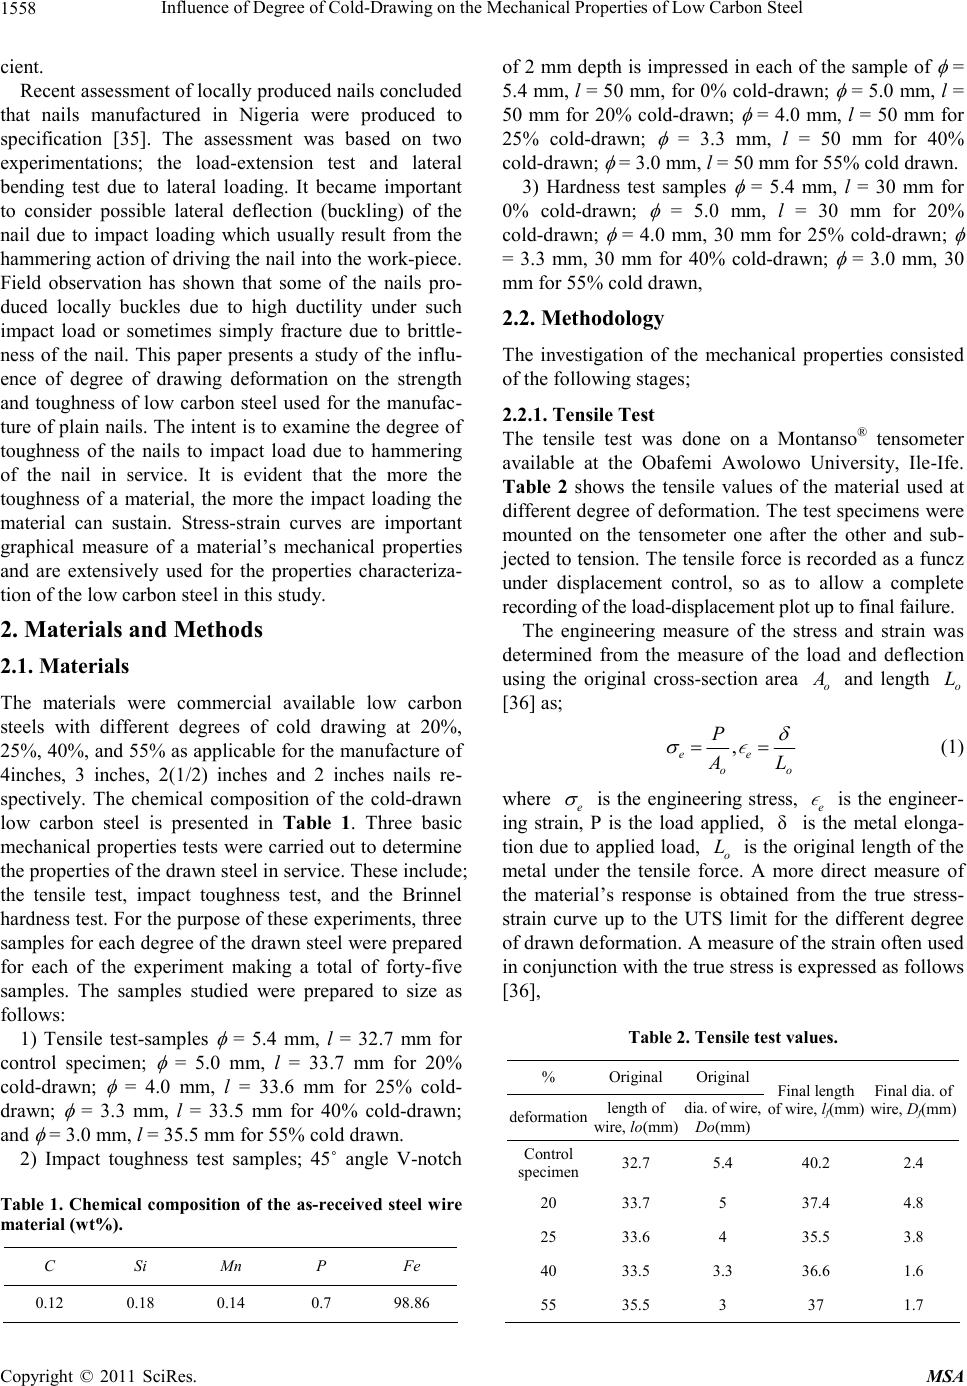 Influence of Degree of Cold-Drawing on the Mechanical Properties of Low Carbon Steel 1558 cient. Recent assessment of locally produced nails concluded that nails manufactured in Nigeria were produced to specification [35]. The assessment was based on two experimentations; the load-extension test and lateral bending test due to lateral loading. It became important to consider possible lateral deflection (buckling) of the nail due to impact loading which usually result from the hammering action of driving the nail into the work-piece. Field observation has shown that some of the nails pro- duced locally buckles due to high ductility under such impact load or sometimes simply fracture due to brittle- ness of the nail. This paper presents a study of the influ- ence of degree of drawing deformation on the strength and toughness of low carbon steel used for the manufac- ture of plain nails. The intent is to examine the degree of toughness of the nails to impact load due to hammering of the nail in service. It is evident that the more the toughness of a material, the more the impact loading the material can sustain. Stress-strain curves are important graphical measure of a material’s mechanical properties and are extensively used for the properties characteriza- tion of the low carbon steel in this study. 2. Materials and Methods 2.1. Materials The materials were commercial available low carbon steels with different degrees of cold drawing at 20%, 25%, 40%, and 55% as applicable for the manufacture of 4inches, 3 inches, 2(1/2) inches and 2 inches nails re- spectively. The chemical composition of the cold-drawn low carbon steel is presented in Table 1. Three basic mechanical properties tests were carried out to determine the properties of the drawn steel in service. These include; the tensile test, impact toughness test, and the Brinnel hardness test. For the purpose of these experiments, three samples for each degree of the drawn steel were prepared for each of the experiment making a total of forty-five samples. The samples studied were prepared to size as follows: 1) Tensile test-samples = 5.4 mm, l = 32.7 mm for control specimen; = 5.0 mm, l = 33.7 mm for 20% cold-drawn; = 4.0 mm, l = 33.6 mm for 25% cold- drawn; = 3.3 mm, l = 33.5 mm for 40% cold-drawn; and = 3.0 mm, l = 35.5 mm for 55% cold drawn. 2) Impact toughness test samples; 45˚ angle V-notch Table 1. Chemical composition of the as-received steel w ire material (wt%). C Si Mn P Fe 0.12 0.18 0.14 0.7 98.86 of 2 mm depth is impressed in each of the sample of = 5.4 mm, l = 50 mm, for 0% cold-drawn; = 5.0 mm, l = 50 mm for 20% cold-drawn; = 4.0 mm, l = 50 mm for 25% cold-drawn; = 3.3 mm, l = 50 mm for 40% cold-drawn; = 3.0 mm, l = 50 mm for 55% cold drawn. 3) Hardness test samples = 5.4 mm, l = 30 mm for 0% cold-drawn; = 5.0 mm, l = 30 mm for 20% cold-drawn; = 4.0 mm, 30 mm for 25% cold-drawn; = 3.3 mm, 30 mm for 40% cold-drawn; = 3.0 mm, 30 mm for 55% cold drawn, 2.2. Methodology The investigation of the mechanical properties consisted of the following stages; 2.2.1. Tensile Test The tensile test was done on a Montanso® tensometer available at the Obafemi Awolowo University, Ile-Ife. Table 2 shows the tensile values of the material used at different degree of deformation. The test specimens were mounted on the tensometer one after the other and sub- jected to tension. The tensile force is recorded as a funcz under displacement control, so as to allow a complete recording of the load-displacement plot up to final failure. The engineering measure of the stress and strain was determined from the measure of the load and deflection using the original cross-section area o A and length o L [36] as; , ee oo P A L (1) where e is the engineering stress, e is the engineer- ing strain, P is the load applied, is the metal elonga- tion due to applied load, o δ L is the original length of the metal under the tensile force. A more direct measure of the material’s response is obtained from the true stress- strain curve up to the UTS limit for the different degree of drawn deformation. A measure of the strain often used in conjunction with the true stress is expressed as follows [36], Table 2. Tensile test value s. % Original Original deformation length of wire, lo(mm) dia. of wire, Do(mm) Final length of wire, lf(mm) Final dia. of wire, Df(mm) Control specimen 32.7 5.4 40.2 2.4 20 33.7 5 37.4 4.8 25 33.6 4 35.5 3.8 40 33.5 3.3 36.6 1.6 55 35.5 3 37 1.7 Copyright © 2011 SciRes. MSA 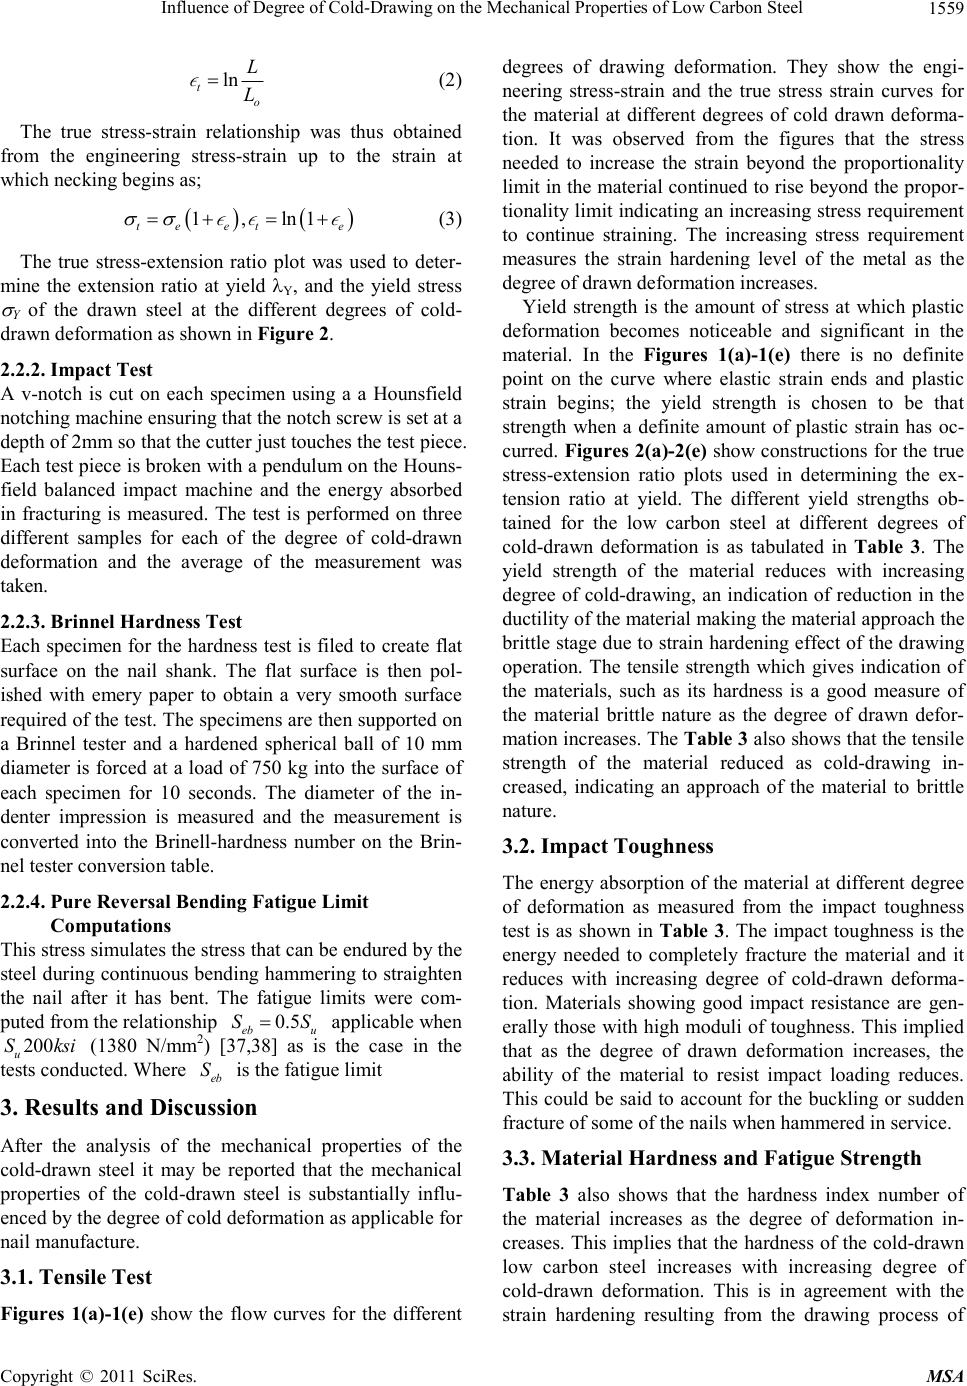 Influence of Degree of Cold-Drawing on the Mechanical Properties of Low Carbon Steel1559 ln t o L L (2) The true stress-strain relationship was thus obtained from the engineering stress-strain up to the strain at which necking begins as; 1,ln1 te ete S i (3) The true stress-extension ratio plot was used to deter- mine the extension ratio at yield Y, and the yield stress Y of the drawn steel at the different degrees of cold- drawn deformation as shown in Figure 2. 2.2.2. Impact Test A v-notch is cut on each specimen using a a Hounsfield notching machine ensuring that the notch screw is set at a depth of 2mm so that the cutter just touches the test piece. Each test piece is broken with a pendulum on the Houns- field balanced impact machine and the energy absorbed in fracturing is measured. The test is performed on three different samples for each of the degree of cold-drawn deformation and the average of the measurement was taken. 2.2.3. Brinnel Hardness Test Each specimen for the hardness test is filed to create flat surface on the nail shank. The flat surface is then pol- ished with emery paper to obtain a very smooth surface required of the test. The specimens are then supported on a Brinnel tester and a hardened spherical ball of 10 mm diameter is forced at a load of 750 kg into the surface of each specimen for 10 seconds. The diameter of the in- denter impression is measured and the measurement is converted into the Brinell-hardness number on the Brin- nel tester conversion table. 2.2.4. Pure Reversal Bending Fatigue Limit Computations This stress simulates the stress that can be endured by the steel during continuous bending hammering to straighten the nail after it has bent. The fatigue limits were com- puted from the relationship applicable when (1380 N/mm2) [37,38] as is the case in the tests conducted. Where is the fatigue limit 0.5 eb u S 200 u Sks eb S 3. Results and Discussion After the analysis of the mechanical properties of the cold-drawn steel it may be reported that the mechanical properties of the cold-drawn steel is substantially influ- enced by the degree of cold deformation as applicable for nail manufacture. 3.1. Tensile Test Figures 1(a)-1(e) show the flow curves for the different degrees of drawing deformation. They show the engi- neering stress-strain and the true stress strain curves for the material at different degrees of cold drawn deforma- tion. It was observed from the figures that the stress needed to increase the strain beyond the proportionality limit in the material continued to rise beyond the propor- tionality limit indicating an increasing stress requirement to continue straining. The increasing stress requirement measures the strain hardening level of the metal as the degree of drawn deformation increases. Yield strength is the amount of stress at which plastic deformation becomes noticeable and significant in the material. In the Figures 1(a)-1(e) there is no definite point on the curve where elastic strain ends and plastic strain begins; the yield strength is chosen to be that strength when a definite amount of plastic strain has oc- curred. Figures 2(a)-2(e) show constructions for the true stress-extension ratio plots used in determining the ex- tension ratio at yield. The different yield strengths ob- tained for the low carbon steel at different degrees of cold-drawn deformation is as tabulated in Table 3. The yield strength of the material reduces with increasing degree of cold-drawing, an indication of reduction in the ductility of the material making the material approach the brittle stage due to strain hardening effect of the drawing operation. The tensile strength which gives indication of the materials, such as its hardness is a good measure of the material brittle nature as the degree of drawn defor- mation increases. The Table 3 also shows that the tensile strength of the material reduced as cold-drawing in- creased, indicating an approach of the material to brittle nature. 3.2. Impact Toughness The energy absorption of the material at different degree of deformation as measured from the impact toughness test is as shown in Table 3. The impact toughness is the energy needed to completely fracture the material and it reduces with increasing degree of cold-drawn deforma- tion. Materials showing good impact resistance are gen- erally those with high moduli of toughness. This implied that as the degree of drawn deformation increases, the ability of the material to resist impact loading reduces. This could be said to account for the buckling or sudden fracture of some of the nails when hammered in service. 3.3. Material Hardness and Fatigue Strength Table 3 also shows that the hardness index number of the material increases as the degree of deformation in- creases. This implies that the hardness of the cold-drawn low carbon steel increases with increasing degree of cold-drawn deformation. This is in agreement with the strain hardening resulting frm the drawing process of o Copyright © 2011 SciRes. MSA 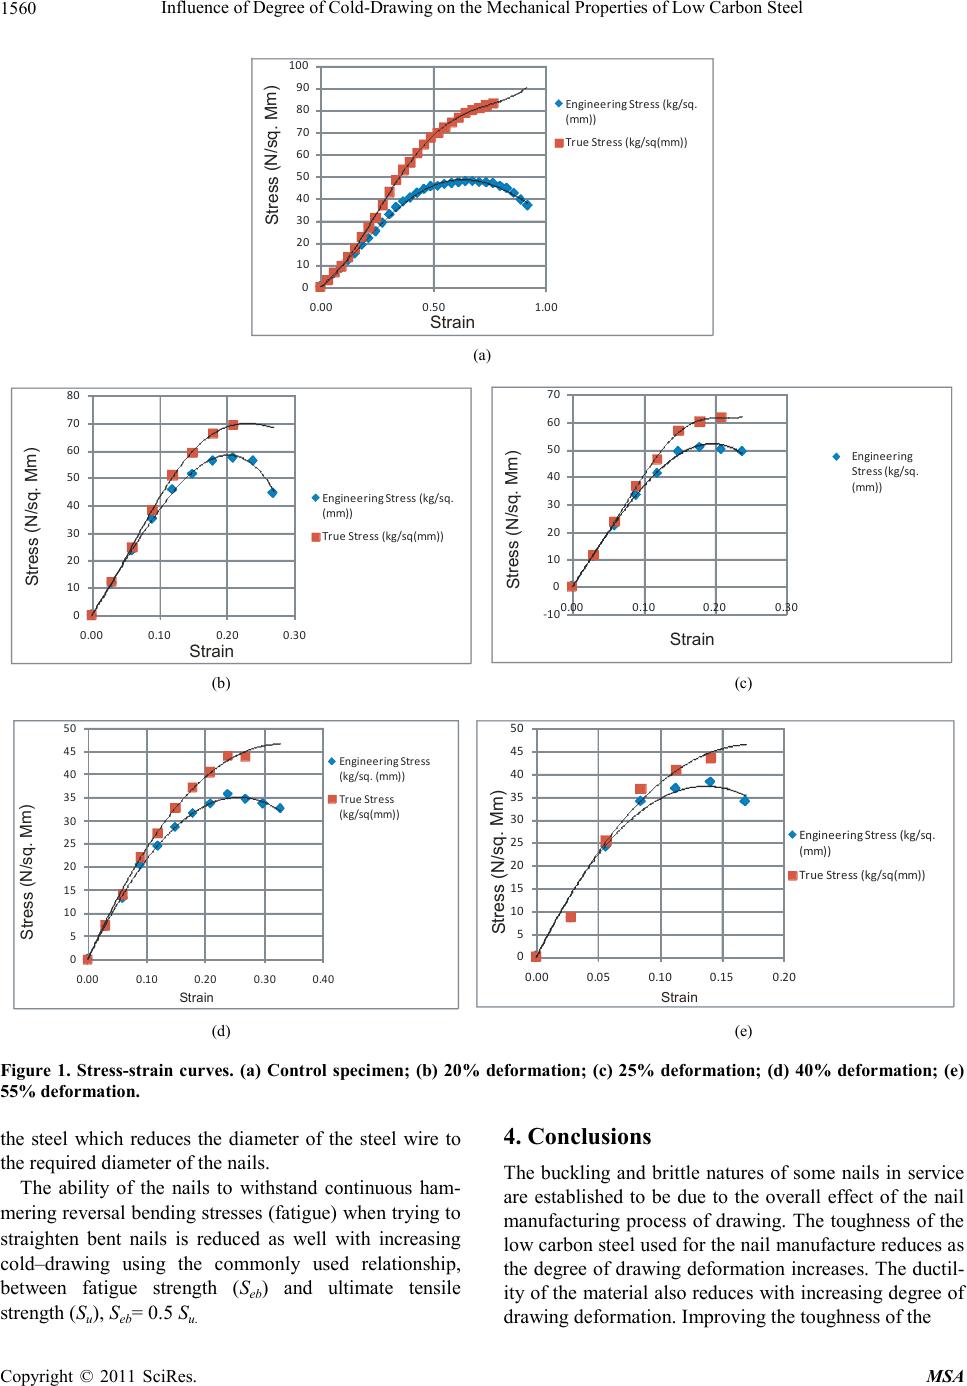 Influence of Degree of Cold-Drawing on the Mechanical Properties of Low Carbon Steel Copyright © 2011 SciRes. MSA 1560 0 10 20 30 40 50 60 70 80 90 100 0.00 0.50 1.00 EngineeringStress(kg/sq. (mm)) True Stress (kg/sq(mm)) Stress (N/sq. Mm) Strain (a) 0 10 20 30 40 50 60 70 80 0.000.100.20 0.30 EngineeringStress(kg/sq. (mm)) True Stress (kg/sq(mm)) Stress (N/sq. Mm) Strain ‐10 0 10 20 30 40 50 60 70 0.000.10 0.200.30 Engineering Stress (kg/sq. (mm)) Strain Stress (N/sq. Mm) (b) (c) 0 5 10 15 20 25 30 35 40 45 50 0.000.10 0.200.30 0.40 EngineeringStress (kg/sq. (mm)) True Stress (kg/sq(mm)) Strain Stress (N/sq. Mm) 0 5 10 15 20 25 30 35 40 45 50 0.00 0.05 0.10 0.150.20 EngineeringStress(kg/sq. (mm)) True Stress (kg/sq(mm)) Stress (N/sq. Mm) Strain (d) (e) Figure 1. Stress-strain curves. (a) Control specimen; (b) 20% deformation; (c) 25% deformation; (d) 40% deformation; (e) 55% deformation. 4. Conclusions the steel which reduces the diameter of the steel wire to the required diameter of the nails. The buckling and brittle natures of some nails in service are established to be due to the overall effect of the nail manufacturing process of drawing. The toughness of the low carbon steel used for the nail manufacture reduces as the degree of drawing deformation increases. The ductil- ity of the material also reduces with increasing degree of rawing deformation. Improving the toughness of the The ability of the nails to withstand continuous ham- mering reversal bending stresses (fatigue) when trying to straighten bent nails is reduced as well with increasing cold–drawing using the commonly used relationship, between fatigue strength (Seb) and ultimate tensile strength (Su), Seb= 0.5 Su. d 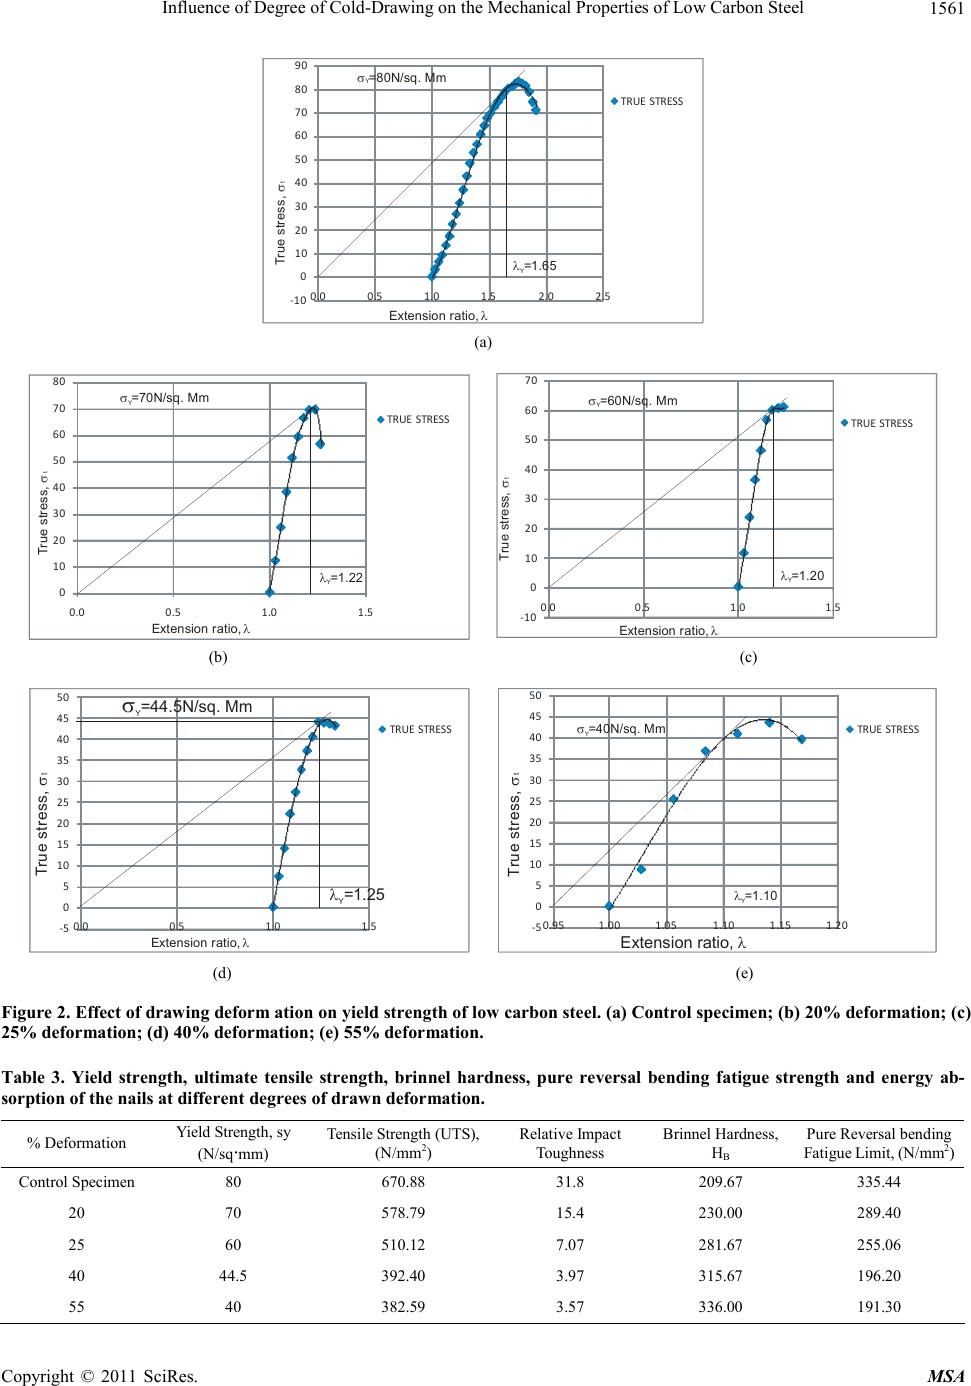 Influence of Degree of Cold-Drawing on the Mechanical Properties of Low Carbon Steel1561 ‐10 0 10 20 30 40 50 60 70 80 90 0.0 0.5 1.0 1.52.0 2.5 TRUE STRESS Extension r a tio, True stress, t O Y =1.65 o Y =80N/sq. Mm (a) 0 10 20 30 40 50 60 70 80 0.0 0.5 1.0 1.5 TRUE STRESS O Y =1.22 Extension ratio, True stre ss, t O Y =70N/sq. Mm ‐10 0 10 20 30 40 50 60 70 0.00.5 1.0 1.5 TRUE STRESS O Y =60N/sq. Mm Extension ratio, True stre ss, t O Y =1 .20 (b) (c) ‐5 0 5 10 15 20 25 30 35 40 45 50 0.0 0.5 1.01.5 TRUE STRESS Extension ratio, True stress, t OY=1. 2 5 O Y=44.5N/sq. Mm ‐5 0 5 10 15 20 25 30 35 40 45 50 0.951.00 1.051.10 1.15 1.20 TRUE STRESS Extension ratio, True stress, t O Y =1.1 0 O Y =40N/sq. Mm (d) (e) Fig ure 2. Eff ect of draw i ng defor m ati on on yi eld st re ngt h of l ow carbon steel. (a) Control specimen; (b) 20% deformation; (c) 25% deformation; (d) 40% deformation; (e) 55% deformation. Table 3. Yield strength, ultimate tensile strength, brinnel hardness, pure reversal bending fatigue strength and energy ab- sorption of the nails at different degrees of drawn deformation. % Deformation Yield Strength, sy (N/sq·mm) Tensile Strength (UTS), (N/mm2) Relative Impact Toughness Brinnel Hardness, HB Pure Reversal bending Fatigue Limit, (N/mm2) Control Specimen 80 670.88 31.8 209.67 335.44 20 70 578.79 15.4 230.00 289.40 25 60 510.12 7.07 281.67 255.06 40 44.5 392.40 3.97 315.67 196.20 55 40 382.59 3.57 336.00 191.30 Copyright © 2011 SciRes. MSA 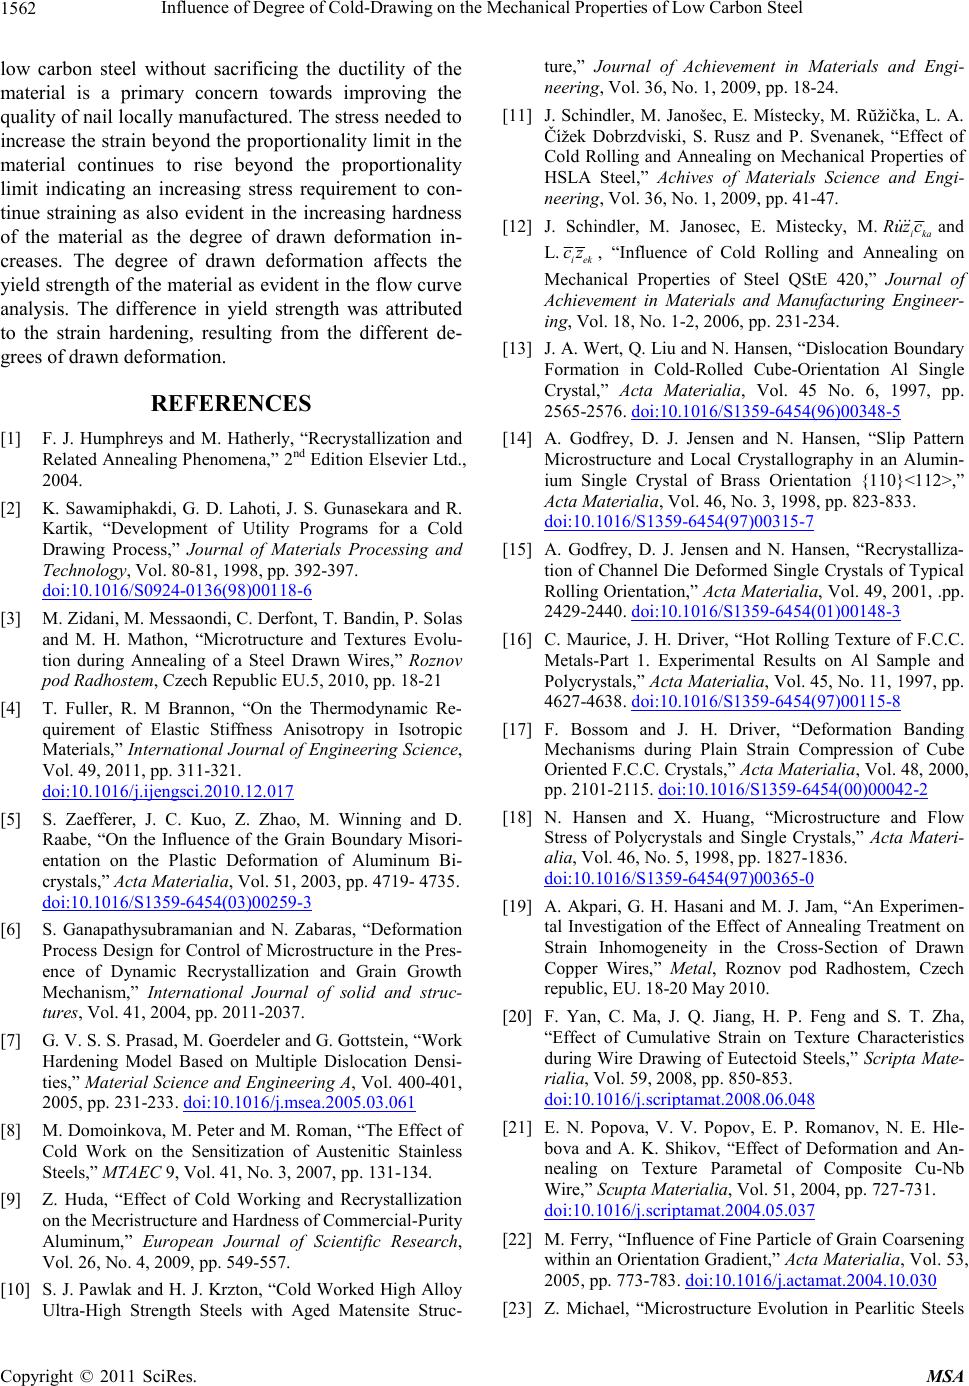 Influence of Degree of Cold-Drawing on the Mechanical Properties of Low Carbon Steel 1562 low carbon steel without sacrificing the ductility of the material is a primary concern towards improving the quality of nail locally manufactured. The stress needed to increase the strain beyond the proportionality limit in the material continues to rise beyond the proportionality limit indicating an increasing stress requirement to con- tinue straining as also evident in the increasing hardness of the material as the degree of drawn deformation in- creases. The degree of drawn deformation affects the yield strength of the material as evident in the flow curve analysis. The difference in yield strength was attributed to the strain hardening, resulting from the different de- grees of drawn deformation. REFERENCES [1] F. J. Humphreys and M. Hatherly, “Recrystallization and Related Annealing Phenomena,” 2nd Edition Elsevier Ltd., 2004. [2] K. Sawamiphakdi, G. D. Lahoti, J. S. Gunasekara and R. Kartik, “Development of Utility Programs for a Cold Drawing Process,” Journal of Materials Processing and Technology, Vol. 80-81, 1998, pp. 392-397. doi:10.1016/S0924-0136(98)00118-6 [3] M. Zidani, M. Messaondi, C. Derfont, T. Bandin, P. Solas and M. H. Mathon, “Microtructure and Textures Evolu- tion during Annealing of a Steel Drawn Wires,” Roznov pod Radhostem, Czech Republic EU.5, 2010, pp. 18-21 [4] T. Fuller, R. M Brannon, “On the Thermodynamic Re- quirement of Elastic Stiffness Anisotropy in Isotropic Materials,” International Journal of Engineering Science, Vol. 49, 2011, pp. 311-321. doi:10.1016/j.ijengsci.2010.12.017 [5] S. Zaefferer, J. C. Kuo, Z. Zhao, M. Winning and D. Raabe, “On the Influence of the Grain Boundary Misori- entation on the Plastic Deformation of Aluminum Bi- crystals,” Acta Materialia, Vol. 51, 2003, pp. 4719- 4735. doi:10.1016/S1359-6454(03)00259-3 [6] S. Ganapathysubramanian and N. Zabaras, “Deformation Process Design for Control of Microstructure in the Pres- ence of Dynamic Recrystallization and Grain Growth Mechan ism,” International Journal of solid and struc- tures, Vol. 41, 2004, pp. 2011-2037. [7] G. V. S. S. Prasad, M. Goerdeler and G. Gottstein, “Work Hardening Model Based on Multiple Dislocation Densi- ties,” Material Science and Engineering A, Vol. 400-401, 2005, pp. 231-233. doi:10.1016/j.msea.2005.03.061 [8] M. Domoinkova, M. Peter and M. Roman, “The Effect of Cold Work on the Sensitization of Austenitic Stainless Steels,” MTAEC 9, Vol. 41, No. 3, 2007, pp. 131-134. [9] Z. Huda, “Effect of Cold Working and Recrystallization on the Mecristructure and Hardness of Commercial-Purity Aluminum,” European Journal of Scientific Research, Vol. 26, No. 4, 2009, pp. 549-557. [10] S. J. Pawlak and H. J. Krzton, “Cold Worked High Alloy Ultra-High Strength Steels with Aged Matensite Struc- ture,” Journal of Achievement in Materials and Engi- neering , Vol. 36, No. 1, 2009, pp. 18-24. [11] J. Schindler, M. Janošec, E. Místecky, M. Rŭžička, L. A. Čížek Dobrzdviski, S. Rusz and P. Svenanek, “Effect of Cold Rolling and Annealing on Mechanical Properties of HSLA Steel,” Achives of Materials Science and Engi- neering , Vol. 36, No. 1, 2009, pp. 41-47. [12] J. Schindler, M. Janosec, E. Mistecky, M.ika R uz c and L. iek cz , “Influence of Cold Rolling and Annealing on Mechanical Properties of Steel QStE 420,” Journal of Achievement in Materials and Manufacturing Engineer- ing, Vol. 18, No. 1-2, 2006, pp. 231-234. [13] J. A. Wert, Q. Liu and N. Hansen, “Dislocation Boundary Formation in Cold-Rolled Cube-Orientation Al Single Crystal,” Acta Materialia, Vol. 45 No. 6, 1997, pp. 2565-2576. doi:10.1016/S1359-6454(96)00348-5 [14] A. Godfrey, D. J. Jensen and N. Hansen, “Slip Pattern Microstructure and Local Crystallography in an Alumin- ium Single Crystal of Brass Orientation {110}<112>,” Acta Materialia, Vol. 46, No. 3, 1998, pp. 823-833. doi:10.1016/S1359-6454(97)00315-7 [15] A. Godfrey, D. J. Jensen and N. Hansen, “Recrystalliza- tion of Channel Die Deformed Single Crystals of Typical Rolling Orientation,” Acta Materialia, Vol. 49, 2001, .pp. 2429-2440. doi:10.1016/S1359-6454(01)00148-3 [16] C. Maurice, J. H. Driver, “Hot Rolling Texture of F.C.C. Metals-Part 1. Experimental Results on Al Sample and Polycrystals,” Acta Materialia, Vol. 45, No. 11, 1997, pp. 4627-4638. doi:10.1016/S1359-6454(97)00115-8 [17] F. Bossom and J. H. Driver, “Deformation Banding Mechanisms during Plain Strain Compression of Cube Oriented F.C.C. Crystals,” Acta Materialia, Vol. 48, 2000, pp. 2101-2115. doi :10. 10 16 / S 13 59 -64 54 ( 00 )00 04 2 -2 [18] N. Hansen and X. Huang, “Microstructure and Flow Stress of Polycrystals and Single Crystals,” Acta Materi- alia, Vol. 46, No. 5, 1998, pp. 1827-1836. doi:10.1016/S1359-6454(97)00365-0 [19] A. Akpari, G. H. Hasani and M. J. Jam, “An Experimen- tal Investigation of the Effect of Annealing Treatment on Strain Inhomogeneity in the Cross-Section of Drawn Copper Wires,” Metal , Roznov pod Radhostem, Czech republic, EU. 18-20 May 2010. [20] F. Yan, C. Ma, J. Q. Jiang, H. P. Feng and S. T. Zha, “Effect of Cumulative Strain on Texture Characteristics during Wire Drawing of Eutectoid Steels,” Scripta Mate- rialia, Vol. 59, 2008, pp. 850-853. doi:10.1016/j.scriptamat.2008.06.048 [21] E. N. Popova, V. V. Popov, E. P. Romanov, N. E. Hle- bova and A. K. Shikov, “Effect of Deformation and An- nealing on Texture Parametal of Composite Cu-Nb Wire,” Scupta Materialia, Vol. 51, 2004, pp. 727-731. doi:10.1016/j.scriptamat.2004.05.037 [22] M. Ferry, “Influence of Fine Particle of Grain Coarsening within an Orientation Gradient,” Acta Materialia, Vol. 53, 2005, pp. 773-783. doi:10.1016/j.actamat.2004.10.030 [23] Z. Michael, “Microstructure Evolution in Pearlitic Steels Copyright © 2011 SciRes. MSA  Influence of Degree of Cold-Drawing on the Mechanical Properties of Low Carbon Steel1563 during Wire Drawing,” Acta Materialia, Vol. 50, 2002, pp. 4431-4447. doi :10. 10 16 / S 13 59 -64 54 ( 02 )00 28 1 -1 [24] A. Skolyszewski, J. Luksza and M. Packo, “Some Prob- lems of Multi-Stage Fine Wire Drawing of High-Alloy Steels and Special Alloys,” Journal of Material Process- ing Technology, Vol. 60, 1996, pp. 155-160. do i:1 0. 10 16 /09 24 - 01 36 (96 ) 02 32 1-7 [25] A. Skolyszewski and M. Packo, “Back Tension Value in the Fine Wire Drawing Process,” Journal of Material Processing Technology, Vol. 80-81, 1998, pp. 380-387. doi:10.1016/S0924-0136(98)00116-2 [26] A. L. R. de Castro, H. B. Campos and P. R. Cetlin, “In- fluence of Die Semi-Angle on Mechanical Properties of Single and Multiple Pass Drawn Copper,” Journal of Materials Process and Technology, Vol. 60, 1996, pp. 179-182. doi:10.1016/0924-0136(96)02325-4 [27] D. G. Cram, H. S. Zurob, Y. J. M. Brechet and C. R. Hutchinsm, “Modeling Discontinuous Dynamic Recrys- tallization Using a Physically Based Model for Nuclea- tion,” Acta. Materialia, Vol. 57, 2009, pp. 5218-5228. doi:10.1016/j.actamat.2009.07.024 [28] P. Les, H. P. Stuewe and M. Zehetbauer, “Hardening and Strain Rate Sensitivity in Stage IV of Deformation in F.C.C. and B.C.C. Metals,” Materials Science and Engi- neering , Vol. A234-236, 1997, pp. 453-455. [29] Y. Estrin, L. S. Tóth, A. Molinari and Y. Bréchet, “A Dislocation-Based Model for All Hardening Stages in Large Strain Deformation,” Acta Materialia, Vol. 46, No. 15, 1998, pp. 5509-5522. doi:10.1016/S1359-6454(98)00196-7 [30] O. Bouaziz, S. Allain and C. Scott, “Effect of Grain and Twin Boundaries on the Hardering Mechanisms of Twin- ning-Induced Plasticity Steels,” Scripta Materialia, Vol. 58, 2008, pp. 484-487. doi:10.1016/j.scriptamat.2007.10.050 [31] R. E. Smallman and R. J. Bishop, “Modern Physical Met- allurgy and Materials Engineering Science, Process, Ap- plications,” 6th Edition, Butterworth-Heinemann, London, 1999. [32] S. Panwar, D. B. Goel and O. P. Pandey, “Effect Interfa- cial of Cold Work and Aging on Mechanical Properties of Surface Energy Copper Bearing HSLA-100 Steel,” Bulle- tin Material Science, Vol. 28, No. 3, 2005, pp. 259-265. doi:10.1007/BF02711258 [33] J. Luksza, J. Majta, M. Burdek, M. Ruminski, “Modeling and Measurement of Mechanical Behavior in Multi-Pass Drawing Process,” Journal of Materials and Processing Technology, Vol. 80-81, 1998, pp. 398-405. doi:10.1016/S0924-0136(98)00119-8 [34] F. Knap, “Drawing of Square Twisted Wire,” Journal of Material Processing Technology, Vol. 60, 1996, pp. 167-170. doi:10.1016/0924-0136(96)02323-0 [35] O. O. Isimijola, “Assessment of Locally Produced Nails,” M.Sc Project work of University of Ibadan, Ibadan, 2010. [36] K. L. Murty, 2011 ‘Tension Test’ http://www4.ncsu.edu/~murty/MAT450/NOTES/tandhtes ts.pdf (considere construction and other factors-resilience, etc) [37] EPI Inc. 2011 “Metal Fatigue-Why Metal Parts Fail From Repeatedly-Applied Loads,” http ://webcache. goo gleu sercon ten t.co m/sear ch?q =cache: mqdpB8n3EJoJ:www.epieng.com/mechanical_engineer- ing_basics/fatigue_in_metals.htm+fatigue+uts+ratio&cd= 10&hl=en&ct=clnk&gl=ng&source=www.google.com.ng [38] Matweb 2011 “Unit of measure converter.” http://www.matweb.com/tools/unitconverter.aspx Copyright © 2011 SciRes. MSA |