

Paper Menu >>
Journal Menu >>
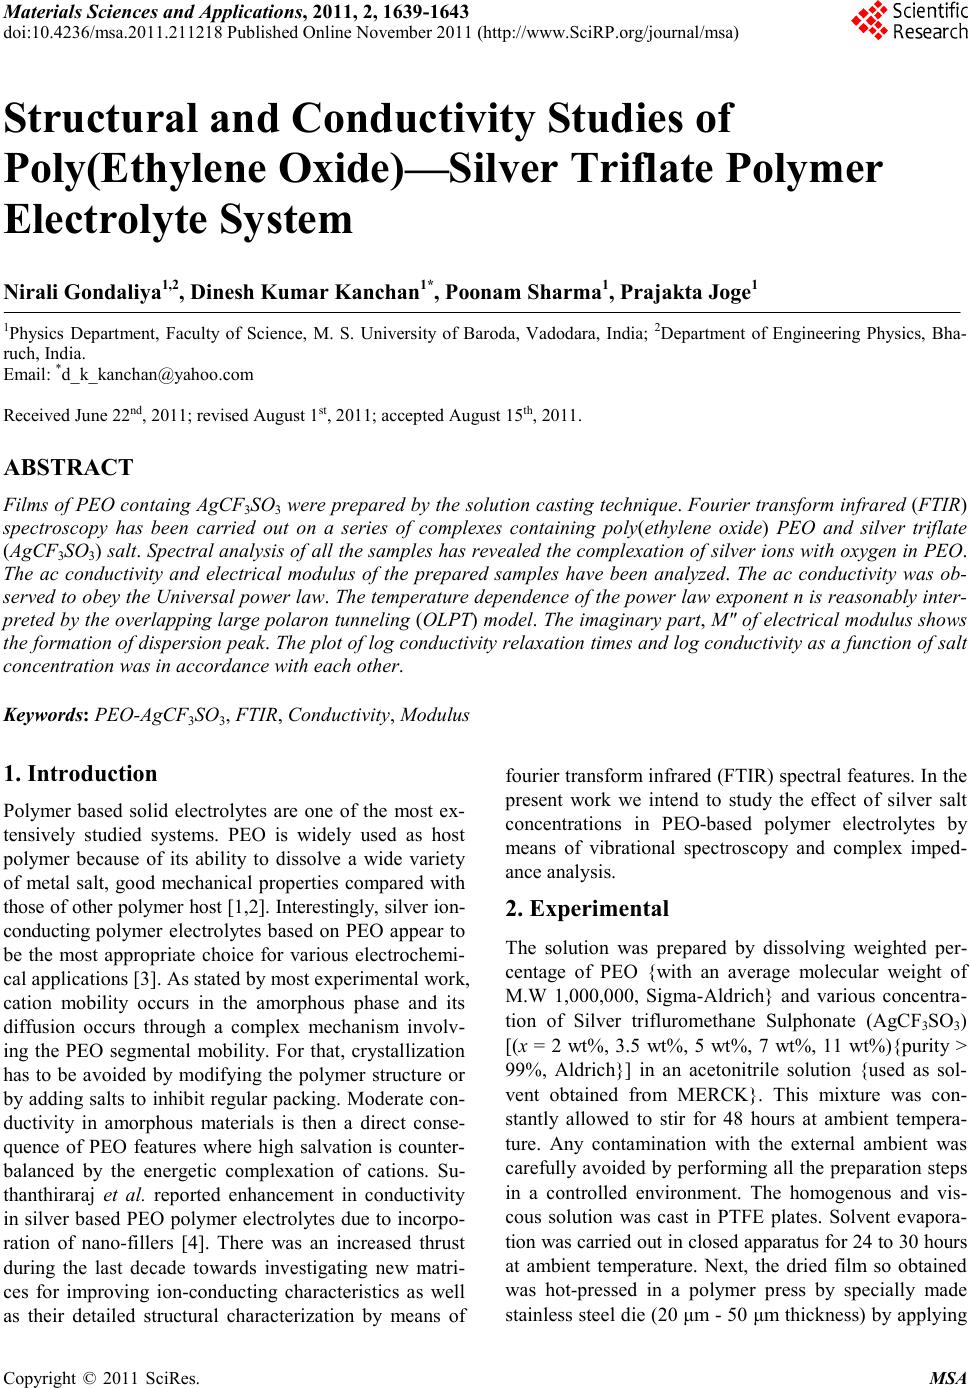 Materials Sciences and Applications, 2011, 2, 1639-1643 doi:10.4236/msa.2011.211218 Published Online November 2011 (http://www.SciRP.org/journal/msa) Copyright © 2011 SciRes. MSA 1639 Structural and Conductivity Studies of Poly(Ethylene Oxide)—Silver Triflate Polymer Electrolyte System Nirali Gondaliya1,2, Dinesh Kumar Kanchan1*, Poonam Sharma1, Prajakta Joge1 1Physics Department, Faculty of Science, M. S. University of Baroda, Vadodara, India; 2Department of Engineering Physics, Bha- ruch, India. Email: *[email protected] Received June 22nd, 2011; revised August 1st, 2011; accepted August 15th, 2011. ABSTRACT Films of PEO containg AgCF3SO3 were prepared by the solution casting technique. Fourier transform infrared (FTIR) spectroscopy has been carried out on a series of complexes containing poly(ethylene oxide) PEO and silver triflate (AgCF3SO3) salt. Spectral analysis of all the samples has revealed the complexation of silver ions with oxygen in PEO. The ac conductivity and electrical modulus of the prepared samples have been analyzed. The ac conductivity was ob- served to obey the Universal power law. The temperature dependence of the power law exponent n is reasonably inter- preted by the overlapping large polaron tunneling (OLPT) model. The imaginary part, M" of electrical modulus shows the formation of dispersion peak. The plot of log conductivity relaxation times and log conductivity as a function of salt concentration was in accordance with each other. Keywords: PEO-AgCF3SO3, FTIR, Conductivity, Modulus 1. Introduction Polymer based solid electrolytes are one of the most ex- tensively studied systems. PEO is widely used as host polymer because of its ability to dissolve a wide variety of metal salt, good mechanical properties compared with those of other polymer host [1,2]. Interestingly, silver ion- conducting polymer electrolytes based on PEO appear to be the most appropriate choice for various electrochemi- cal applications [3]. As stated by most experimental work, cation mobility occurs in the amorphous phase and its diffusion occurs through a complex mechanism involv- ing the PEO segmental mobility. For that, crystallization has to be avoided by modifying the polymer structure or by adding salts to inhibit regular packing. Moderate con- ductivity in amorphous materials is then a direct conse- quence of PEO features where high salvation is counter- balanced by the energetic complexation of cations. Su- thanthiraraj et al. reported enhancement in conductivity in silver based PEO polymer electrolytes due to incorpo- ration of nano-fillers [4]. There was an increased thrust during the last decade towards investigating new matri- ces for improving ion-conducting characteristics as well as their detailed structural characterization by means of fourier transform infrared (FTIR) spectral features. In the present work we intend to study the effect of silver salt concentrations in PEO-based polymer electrolytes by means of vibrational spectroscopy and complex imped- ance analysis. 2. Experimental The solution was prepared by dissolving weighted per- centage of PEO {with an average molecular weight of M.W 1,000,000, Sigma-Aldrich} and various concentra- tion of Silver trifluromethane Sulphonate (AgCF3SO3) [(x = 2 wt%, 3.5 wt%, 5 wt%, 7 wt%, 11 wt%){purity > 99%, Aldrich}] in an acetonitrile solution {used as sol- vent obtained from MERCK}. This mixture was con- stantly allowed to stir for 48 hours at ambient tempera- ture. Any contamination with the external ambient was carefully avoided by performing all the preparation steps in a controlled environment. The homogenous and vis- cous solution was cast in PTFE plates. Solvent evapora- tion was carried out in closed apparatus for 24 to 30 hours at ambient temperature. Next, the dried film so obtained was hot-pressed in a polymer press by specially made stainless steel die (20 μm - 50 μm thickness) by applying 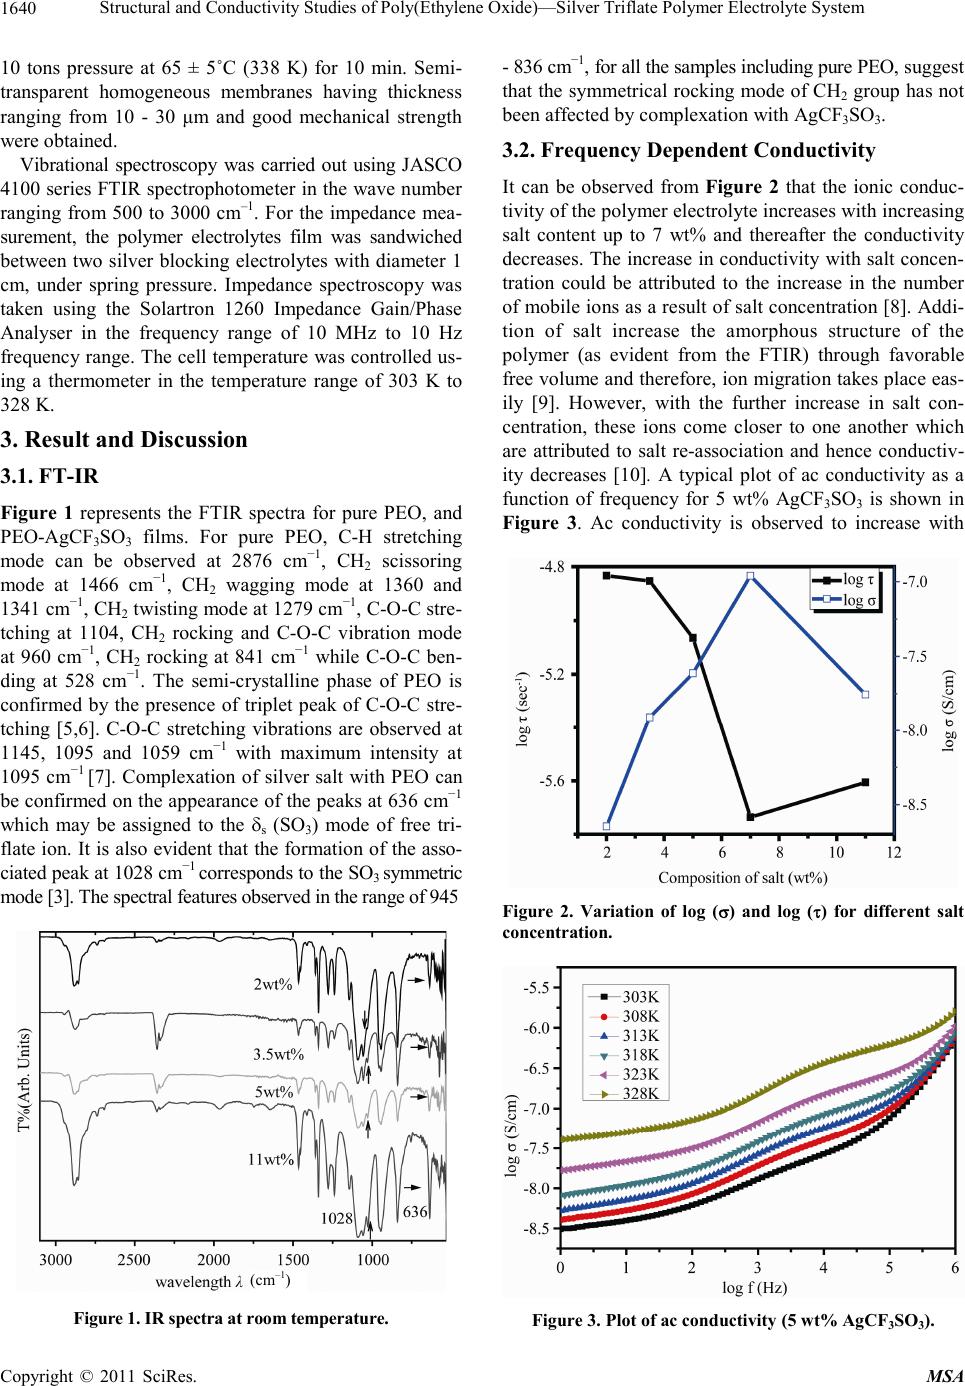 Structural and Conductivity Studies of Poly(Ethylene Oxide)—Silver Triflate Polymer Electrolyte System 1640 10 tons pressure at 65 ± 5˚C (338 K) for 10 min. Semi- transparent homogeneous membranes having thickness ranging from 10 - 30 μm and good mechanical strength were obtained. Vibrational spectroscopy was carried out using JASCO 4100 series FTIR spectrophotometer in the wave number ranging from 500 to 3000 cm–1. For the impedance mea- surement, the polymer electrolytes film was sandwiched between two silver blocking electrolytes with diameter 1 cm, under spring pressure. Impedance spectroscopy was taken using the Solartron 1260 Impedance Gain/Phase Analyser in the frequency range of 10 MHz to 10 Hz frequency range. The cell temperature was controlled us- ing a thermometer in the temperature range of 303 K to 328 K. 3. Result and Discussion 3.1. FT-IR Figure 1 represents the FTIR spectra for pure PEO, and PEO-AgCF3SO3 films. For pure PEO, C-H stretching mode can be observed at 2876 cm−1, CH2 scissoring mode at 1466 cm−1, CH2 wagging mode at 1360 and 1341 cm−1, CH2 twisting mode at 1279 cm−1, C-O-C stre- tching at 1104, CH2 rocking and C-O-C vibration mode at 960 cm−1, CH2 rocking at 841 cm−1 while C-O-C ben- ding at 528 cm−1. The semi-crystalline phase of PEO is confirmed by the presence of triplet peak of C-O-C stre- tching [5,6]. C-O-C stretching vibrations are observed at 1145, 1095 and 1059 cm−1 with maximum intensity at 1095 cm−1 [7]. Complexation of silver salt with PEO can be confirmed on the appearance of the peaks at 636 cm−1 which may be assigned to the s (SO3) mode of free tri- flate ion. It is also evident that the formation of the asso- ciated peak at 1028 cm−1 corresponds to the SO3 symmetric mode [3]. The spectral features observed in the range of 945 (cm – 1 ) Figure 1. IR spectra at room temperature. - 836 cm−1, for all the samples including pure PEO, suggest that the symmetrical rocking mode of CH2 group has not been affected by complexation with AgCF3SO3. 3.2. Frequency Dependent Conductivity It can be observed from Figure 2 that the ionic conduc- tivity of the polymer electrolyte increases with increasing salt content up to 7 wt% and thereafter the conductivity decreases. The increase in conductivity with salt concen- tration could be attributed to the increase in the number of mobile ions as a result of salt concentration [8]. Addi- tion of salt increase the amorphous structure of the polymer (as evident from the FTIR) through favorable free volume and therefore, ion migration takes place eas- ily [9]. However, with the further increase in salt con- centration, these ions come closer to one another which are attributed to salt re-association and hence conductiv- ity decreases [10]. A typical plot of ac conductivity as a function of frequency for 5 wt% AgCF3SO3 is shown in Figure 3. Ac conductivity is observed to increase with Figure 2. Variation of log () and log () for different salt concentration. Figure 3. Plot of ac conductivity (5 wt% AgCF3SO3). Copyright © 2011 SciRes. MSA 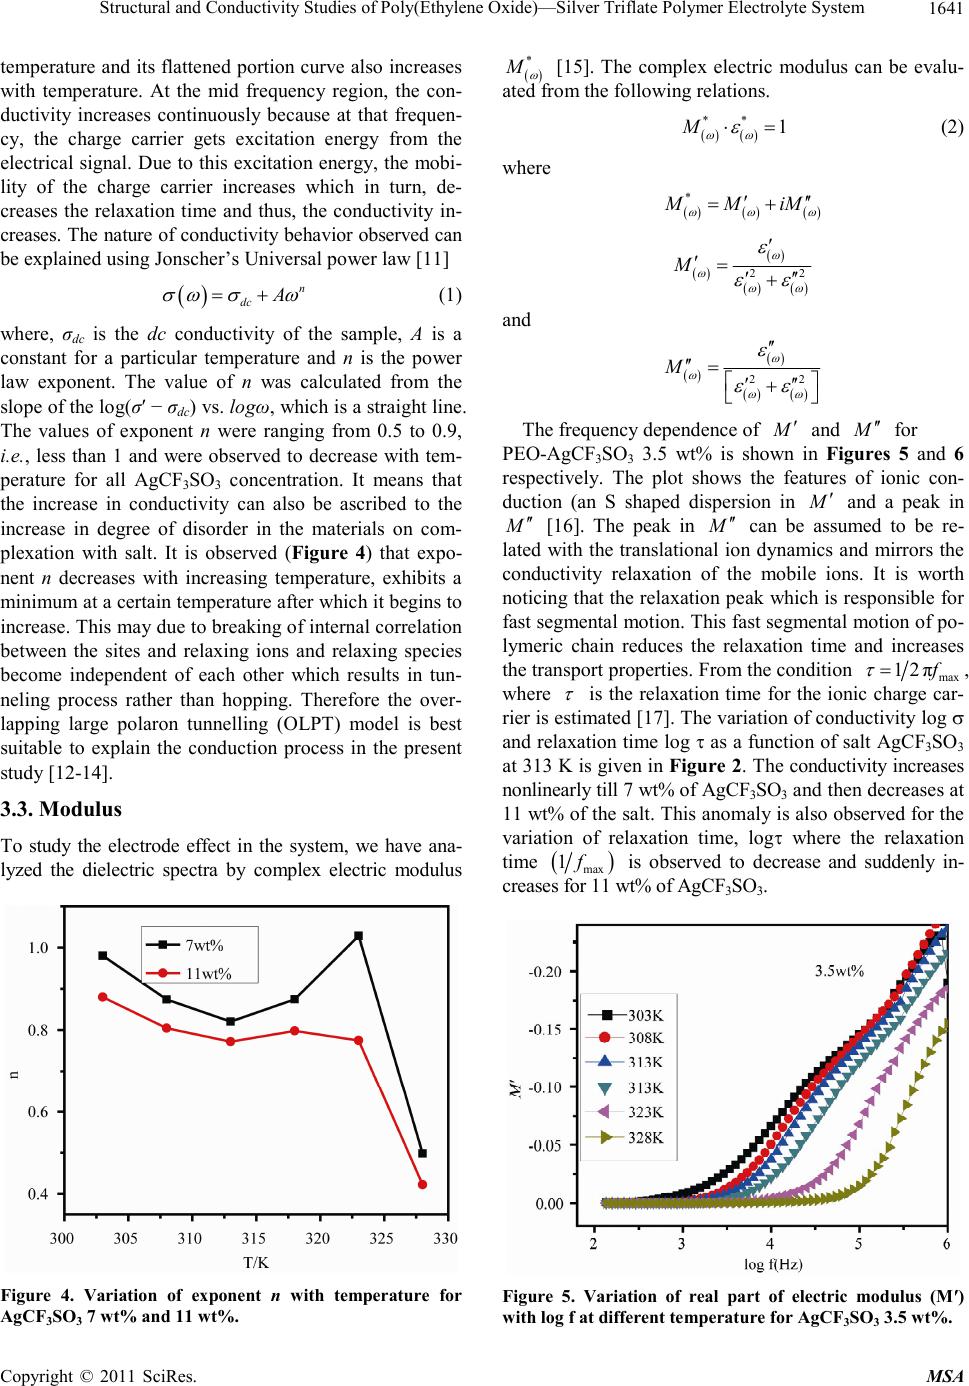 Structural and Conductivity Studies of Poly(Ethylene Oxide)—Silver Triflate Polymer Electrolyte System1641 temperature and its flattened portion curve also increases with temperature. At the mid frequency region, the con- ductivity increases continuously because at that frequen- cy, the charge carrier gets excitation energy from the electrical signal. Due to this excitation energy, the mobi- lity of the charge carrier increases which in turn, de- creases the relaxation time and thus, the conductivity in- creases. The nature of conductivity behavior observed can be explained using Jonscher’s Universal power law [11] n dc A (1) where, σdc is the dc conductivity of the sample, A is a constant for a particular temperature and n is the power law exponent. The value of n was calculated from the slope of the log(σ′ − σdc) vs. lo gω, which is a straight line. The values of exponent n were ranging from 0.5 to 0.9, i.e., less than 1 and were observed to decrease with tem- perature for all AgCF3SO3 concentration. It means that the increase in conductivity can also be ascribed to the increase in degree of disorder in the materials on com- plexation with salt. It is observed (Figure 4) that expo- nent n decreases with increasing temperature, exhibits a minimum at a certain temperature after which it begins to increase. This may due to breaking of internal correlation between the sites and relaxing ions and relaxing species become independent of each other which results in tun- neling process rather than hopping. Therefore the over- lapping large polaron tunnelling (OLPT) model is best suitable to explain the conduction process in the present study [12-14]. 3.3. Modulus To study the electrode effect in the system, we have ana- lyzed the dielectric spectra by complex electric modulus Figure 4. Variation of exponent n with temperature for AgCF3SO3 7 wt% and 11 wt%. * M [15]. The complex electric modulus can be evalu- ated from the following relations. ** 1M (2) where * MMiM 22 M and 22 M The frequency dependence of M and M for PEO-AgCF3SO3 3.5 wt% is shown in Figures 5 and 6 respectively. The plot shows the features of ionic con- duction (an S shaped dispersion in M and a peak in M [16]. The peak in M can be assumed to be re- lated with the translational ion dynamics and mirrors the conductivity relaxation of the mobile ions. It is worth noticing that the relaxation peak which is responsible for fast segmental motion. This fast segmental motion of po- lymeric chain reduces the relaxation time and increases the transport properties. From the condition max 12π f , where is the relaxation time for the ionic charge car- rier is estimated [17]. The variation of conductivity log and relaxation time log as a function of salt AgCF3SO3 at 313 K is given in Figure 2. The conductivity increases nonlinearly till 7 wt% of AgCF3SO3 and then decreases at 11 wt% of the salt. This anomaly is also observed for the variation of relaxation time, log where the relaxation time max 1f is observed to decrease and suddenly in- creases for 11 wt% of AgCF3SO3. Figure 5. Variation of real part of electric modulus (M′) with log f at different temperature for AgCF3SO3 3.5 wt%. Copyright © 2011 SciRes. MSA  Structural and Conductivity Studies of Poly(Ethylene Oxide)—Silver Triflate Polymer Electrolyte System 1642 Figure 6. Variation of imaginary part of electric modulus (M″) with log f at different temperature for AgCF3SO3 3.5 wt%. The plotting of ac data in terms of impedance, electric modulus and dielectric permittivity simultaneously is ex- tremely advantageous for distinguishing the different relaxation processes occurring inside the materials. The comparison of the experimental data in the M* and ε* formalism is, therefore, useful to distinguish long-range conduction process from the localized dielectric relaxa- tion. To visualize this, we have plotted the imaginary part of complex dielectric permittivity (ε″) and modulus (M″) as a function of frequency for PEO-AgCF3SO3 (7 wt%) polymer electrolyte (Figure 7). Dielectric relaxation is a result of the reorientation process of dipoles in the poly- mer chains, which show a peak in ε″ spectra. For elec- trolyte with higher ion concentration, the movement of ions from one site to another perturbs the electric poten- tial of the surroundings. Motion of the other ions in this region will be affected by perturbed potential. This type of cooperative motion of ions exhibits non-exponential decay, or a conduction processes with distribution of re- laxation time [18]. In the imaginary part of modulus spec- tra, a relaxation peak is observed (for the conductivity processes), whereas no peak was seen in the dielectric spectra. This suggests that ionic and polymer segmental motion is strongly coupled and hence manifesting as a single peak in the M″ spectra with no corresponding fea- ture in dielectric spectra [19]. 4. Conclusions PEO-AgCF3SO3 samples are principally ionic conductors. Even a small dispersion of the silver salt causes an en- hancement in the conductivity in comparison to pure po- lymer. The complexation of salt with polymer has been confirmed using FTIR studies. The electrical modulus re- presentation of the same data shows a loss feature in the Figure 7. Plot of the imaginary part of ε″ and modulus (M″) as a function of frequency for AgCF3SO3 7 wt% at 313 K. imaginary component. The relaxation associated with this feature shows a stretched exponential decay. The analysis of frequency dependence of dielectric and modulus for- malism suggests that the ionic and polymer segmental motion are strongly coupled manifesting as a single peak in the M″ spectra with no corresponding feature in di- electric spectra. The frequency dependent of ac conduc- tivity follows Jonscher’s power law feature and the low frequency dispersion indicating the presence of electrode polarization phenomena in the materials. 5. Acknowledgements One of the authors PS thankfully acknowledges the fi- nancial support by UGC, New Delhi, India for RFSMS fellowship. REFERENCES [1] D. Baril, C. Michot and M. Armand, “Electrochemistry of Liquids vs. Solids: Polymer Electrolytes,” Solid State Ion- ics, Vol. 94, No. 1-4, 1997, pp. 35-47. doi:10.1016/S0167-2738(96)00614-5 [2] M. Deepa, N. Sharma, S. A. Agnihotory and R. Chandra, “FTIR Investigation on Ion—Ion Interactionin Liquid and Gel Polymeric Electrolytes-LiCF3SO3-PC-PMMA,” Jour- nal of Material Science, Vol. 37, No. 37, 2001, pp. 1759- 1765. [3] S. A. Suthanthiraraj, R. J Kumar and B. Paul, “Vibra- tional Spectroscopic and Electrochemical Characteristics of Poly (Propylene Glycol)-Silver Triflate Polymer Elec- trolyte System,” Ionics, Vol. 16, No. 2, 2009, pp. 145- 151. doi:10.1007/s11581-009 - 0370-0 [4] S. A. Suthanthiraraj and D. J. Sheeba, “Formation of Polyethylene Oxide-Based Composite Polymer Electro- lytes Blended with Al2O3 Nanoparticles,” Indian Journal of Physics, Vol. 79, No. 7, 2005, pp. 807-813. [5] A. M. Rocco, C. P. Fonseca and R. B. Pereira, “A Poly- meric Solid Electrolyte Based on a Binary Blend of Poly (Ethylene Oxide), Poly(Methyl Vinyl Ether-Maleic Acid) Copyright © 2011 SciRes. MSA  Structural and Conductivity Studies of Poly(Ethylene Oxide)—Silver Triflate Polymer Electrolyte System Copyright © 2011 SciRes. MSA 1643 and LiClO4,” Polymer, Vol. 43, No. 13, 2002, pp. 3601- 3609. doi:10.1016/S0032-3861(02)00173-8 [6] Z. Tang, J. Wang, Q. Chen, W. He, C. Shen, X. X. Mao and J. Q. Zhang, “A Novel PEO-Based Composite Poly- mer Electrolyte with Absorptive Glass Mat for Li-Ion Bat- teries,” Electrochimica Acta, Vol. 52, No. 24, 2007, pp. 6638-6643. doi:10.1016/j.electacta.2007.04.062 [7] M. Sunder and S. Selladurai, “Effect of Fillers on Magne- sium-Poly(Ethylene Oxide) Solid Polymer Electrolyte,” Ionics, Vol. 12, No. 4-5, 2006, pp. 281-286. do i:10. 1007/s11581-0 06-0048-9 [8] N. H. Idris, H. B. Senin and A. K. Arof, “Dielectric Spec- tra of LiTFSI-Doped Chitosan/PEO Blends,” Ionics, Vol. 13, No. 4, June 2007, pp. 213-217. do i:10. 1007/s11581-0 07-0093-z [9] V. Aravindan and P. Vickraman, “A Study of LiBOB- Based Nano Composite Gel Polymer Electrolytes (NCGPE) for Lithium-Ion Batttries,” Ionics, Vol. 13, No. 4, 2007, pp. 277-280. doi:10.1007/s11581-007-0106-y [10] L. Othman, K. W. Chew and Z. Osman, “Impedance Spec- troscopy Studies of Poly(Methyl Methacrylate)-Lithium Salts Polymer Electrolyte Systems,” Ionics, Vol. 13, No. 5, 2007, pp. 337-342. do i:10. 1007/s11581-0 07-0120-0 [11] N. Gondaliya, D. K. Kanchan, P. Sharma, M. Jayswal and M. Pant, “Conductivity and Dielectric Behavior of AgCF3SO3 Doped Peo Polymer Films,” Integrated Ferro- electrics, Vol. 117, No. 1, 2010, pp. 1-12. do i:10. 1080/10584587.2010.489494 [12] M. Z. Kufian, S. R. Majid and A. K. Arof, “Dielectric and Conduction Mechanism Studies of PVA-Orthophosphoric Acid Polymer Electrolyte,” Ionics, Vol. 13, No. 4, 2007, pp. 231-234. doi:10.1007/s11581-007-0098-7 [13] T. Winie and A. K. Arof, “Transport Properties of Hexa- noyl Chitosan-Based Gel Electrolyte,” Ionics, Vol. 12, No. 2, 2006, pp. 149-152. doi:10.1007/s11581-006-0026-2 [14] K. P. Nazeer, S. A. Jocob, M. Thamilselvan, D. Man- galaraj, S. K. Narayandass and J. Yi, “Space-Charge Lim- ited Conduction in Polyaniline Films,” Polymer Interna- tional, Vol. 53, No. 7, 2004, pp. 898-902. do i:10.1002/p i.1459 [15] S. R. Elliot, “Use of the Modulus Formalism in the Ana- lysis of ac Conductivity Data for Ionic Glasses,” Journal of Non-Crystalline Solids, Vol. 107, No. 1, 1994, pp. 97- 100. doi:10.1016/0022-3093(94)90108-2 [16] R. Richter and H. Wagner, “The Dielectric Modulus: Re- laxation versus Retardation,” Solid State Ionics, Vol. 105, No. 1-4, 1998, pp. 167-173. doi:10.1016/S0167-2738(97)00461-X [17] S. Ghosh and A. Ghosh, “Conductivity Relaxation in Mixed Alkali Fluoride Glasses,” Journal of Physics: Con- dense Matter, Vol. 14, No. 10, 2002, pp. 2531-2540. [18] Y. Fu, K. Pathmanathan and J. R. Steven, “Dielectric and Conductivity Relaxation in Poly(Propylene Glycol)-Li- thium Triflate Complexes,” Journal of Chemical Physics, Vol.94, No. 9, 1991, pp. 6323-6330. do i:10. 1063/1.460420 [19] P. Jevanandam and S. Vasudevan, “Arrhenius and Non- Ar-Rhenius Conductivites in Intercalated Polymer Elec- trolytes,” Journal of Chemical Physics, Vol. 109, No. 18, 1998, pp. 8109-8118. doi:10.1063/1.477459 |