

Paper Menu >>
Journal Menu >>
 Journal of Signal and Information Processing, 2011, 2, 336-347 doi:10.4236/jsip.2011.24048 Published Online November 2011 (http://www.SciRP.org/journal/jsip) Copyright © 2011 SciRes. JSIP 1 A New Method of Voiced/Unvoiced Classification Based on Clustering Mojtaba Radmard, Mahdi Hadavi, Mohammad Mahdi Nayebi Department of Electr ical Engineering, Sharif Univer sity of Techno logy, Tehran , Iran. Email: {radmard, mahd i_hadavi}@ee.sharif.ir, nay[email protected] Received June 2nd, 2011; revised October 14th, 2011 ; accep ted October 23rd, 2011. ABSTRACT In this paper, a new method for making v/uv decision is developed which uses a multi-feature v/uv classification algo- rithm based on the analysis of cepstral peak, zero crossing rate, and autocorrelation function (ACF) peak of short-time segments of the speech signal by using some clustering methods. This v/uv classifier achieved excellent results for iden- tification of voiced and unvoiced segments of speech. Keywords: Speech, Voiced, Unvoiced, Clustering, Cepstrum, Autocorrelation, Zero Crossing 1. Introduction The voiced/unvoieced decision is critical in many speech analysis/synthesis systems because it is essential to know whether the speech production system involves vibration of the vocal cords [1-4]. This decision is required for many applications, including modeling for analysis/synthesis, detection of model changes for segmentation p ur p oses a nd signal characteriza tion for ind exing and recognition appli- cations [1]. The periodicity of this vibration makes the voiced segments periodic and so distinguishable from the noisy-like unvoiced segments [5]. Since the speech signals are quasi-periodic [6-9], making the decision gets hard. Other difficulties are represented in [3,10]. Common methods extract a feature from speech seg- ments and make the v/uv decision according to whether the value of the feature is above or b elow a pre-determined threshold. The feature can be the cepstral peak [6,11], some mel-frequency cepstral coefficients [12,13], energy of the segments [3,14], zero-crossing rate [3,14], the a uto- correlation function peak [15,16], or harmonic to noise ratio in the sinusoidal model of speech signal [17]. Since each feature has its own disadvanta ges, ne w metho ds tend to use a c ombin ation of features for v/uv decision [2,3] and since the value of these feat ures are di fferent for variety o f speeches, adaptive thresholding have been used in most of the methods. Different methods have been used in the field of multi- feature voicing decision. Atal and Rabiner [3] clustered the segments into two major groups based on a weighted Euclidian distance in the feature vector space while the weight was estimated according to some statistical prop- erties and the features were considered gaussian distrib- uted in each cluster. Siegel [18] used a non-statistical nonparametric classifier to make v/uv decision. In this method no assumptions are made about the distribution of the features, and training focuses on patterns near the boundry between two regions in the feature space, rather than using statistics to describe each class. Siegel and Bessey [19] tried to develop the mentioned methods by using linear discrimination in the feature vector space. The use of two or more feature s in the voici ng decision tended to the methods which do not consider the features as a vector and use the best feature for each frame like the work in [20] . The work presente d here is in this categor y. In this work, which is preliminaril y presented in [21], we use implicitly two thresholds for each feature and make the decision for each frame based on only one of the fea- tures that performs better than other features. This paper is organized as follows. The description of the suggested algorithm is given in Section 2. Some discussions about the new method are presented in Section 3. In Section 4, the results of the algorithm are represented. Section 5 discusses the disadvantages of former methods. Finally, the conclusion is given in Section 6. 2. The Proposed Algorithm In this section we will describe our method for V/UV de- cision. Here we use three features which are the cepstral peak, autocorrelatio n function (ACF) peak a nd zero cross- ing rate. The speech signal, sampled at 8 kHz, is analyzed at 10 ms intervals using a 40 ms Hamming window. Then 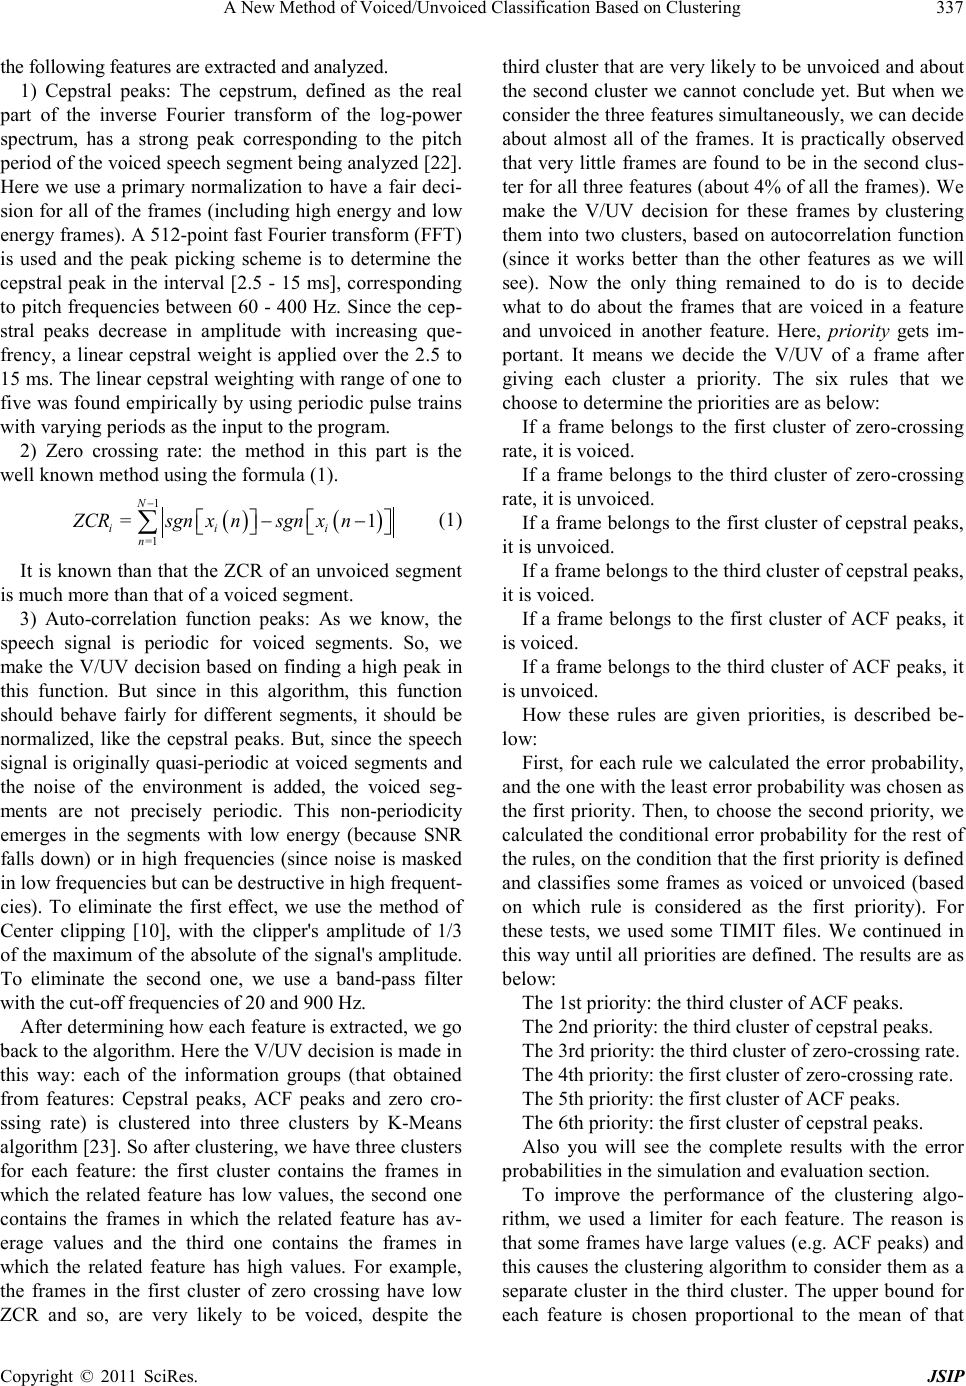 A New Method of Voiced/Unvoiced Classification Based on Clustering Copyright © 2011 SciRes. JSIP 337 the following features are extracted and analyzed. 1) Cepstral peaks: The cepstrum, defined as the real part of the inverse Fourier transform of the log-power spectrum, has a strong peak corresponding to the pitch period of the voiced speech segment being analyzed [22]. Here we use a primary normalization to have a fair deci- sion fo r all of the frames (i ncludin g high ene rgy and lo w energy frames). A 512-point fast Fourier transform (FFT) is used and the peak picking scheme is to determine the cepstral peak in the interval [2.5 - 15 ms], corresponding to pitch frequencies between 60 - 400 Hz. Since the cep- stral peaks decrease in amplitude with increasing que- frency, a linear cepstral weight is applied over the 2.5 to 15 ms. The linear cepstral weighting with range of one to five was fo und e mpiric ally b y usin g per iodic pulse train s with varying periods as the input to the program. 2) Zero crossing rate: the method in this part is the well known met ho d using the formula (1). ( )() 1 =1 =1 N ii i n ZCRsgn xnsgn xn − −− ∑ (1) It is kno wn than tha t the ZCR of an unvoice d segme nt is much mor e tha n that of a voiced segment. 3) Auto-correlation function peaks: As we know, the speech signal is periodic for voiced segments. So, we make the V/UV decision based on finding a high peak in this function. But since in this algorithm, this function should behave fairly for different segments, it should be normalized, like the cepstral peaks. But, since the speech signal is originally quasi-periodic at voiced segments and the noise of the environment is added, the voiced seg- ments are not precisely periodic. This non-periodicity emerges in the segments with low energy (because SNR falls down) or in high frequencies (since noise is masked in low frequencies but can be destructive in high frequent- cies). To eliminate the first effect, we use the method of Center clipping [10], with the clipper's amplitude of 1/3 of the maximum of the absolute of the signal's amplitude. To eliminate the second one, we use a band-pass filter with the cut-off frequencies of 20 and 900 Hz. After determining how each feature is extracted, we go back to the algorithm. Here the V/UV decision is made in this way: each of the information groups (that obtained from features: Cepstral peaks, ACF peaks and zero cro- ssing rate) is clustered into three clusters by K-Means algorithm [23]. So after clustering, we have three clusters for each feature: the first cluster contains the frames in which the related feature has low values, the second one contains the frames in which the related feature has av- erage values and the third one contains the frames in which the related feature has high values. For example, the frames in the first cluster of zero crossing have low ZCR and so, are very likely to be voiced, despite the third cluster that are very likely to be unvoiced and about the second cluster we cannot conclude yet. But when we consider the three features simultaneously, we can decide about almost all of the frames. It is practically observed that very little fra mes are found to be in the second clus- ter for all three features (about 4% of all the frames). We make the V/UV decision for these frames by clustering them into two clusters, based on autocorrelation funct ion (since it works better than the other features as we will see). Now the only thing remained to do is to decide what to do about the frames that are voiced in a feature and unvoiced in another feature. Here, priority gets im- portant. It means we decide the V/UV of a frame after giving each cluster a priority. The six rules that we choose to determine the priorities are as below: If a frame belongs to the first cluster of zero-crossing rate, it is voiced . If a frame belongs to the third cluster of zero-crossing rate, it is unvoiced. If a frame belongs to the first cluster of cepstral peaks, it is unvoiced . If a frame belongs to the third cluster of cepstral peaks, it is voiced. If a frame belongs to the first cluster of ACF peaks, it is voiced. If a frame belongs to the third c luster of ACF peaks, it is unvoiced. How these rules are given priorities, is described be- low: First, for each rule we calculated the error probability, and the one with the least error probability was chosen as the first priority. Then, to choose the second priority, we calculated t he conditional err or prob ability for the rest o f the rules, on the condition that the first priority is defined and classifies some frames as voiced or unvoiced (based on which rule is considered as the first priority). For these tests, we used some TIMIT files. We continued in this way until all p riorities are d efined. The results are as below: The 1st p r iority: the third clust e r of ACF peaks. The 2nd priority: the third cluster of cepstral peaks. The 3rd priority: the third cluster of zero-crossing rate. The 4th pr iority: the first clust e r of zero-crossing rate. The 5th pr iority: the first clust e r of ACF peaks. The 6th pr iority: the first clust e r of cepstral pe a ks. Also you will see the complete results with the error prob abilities in t he simulation and e valuation sectio n. To improve the performance of the clustering algo- rithm, we used a limiter for each feature. The reason is that some frames have large values (e.g. ACF peaks) and this causes the cluster ing algorithm to consider them as a separate cluster in the third cluster. The upper bound for each feature is chosen proportional to the mean of that 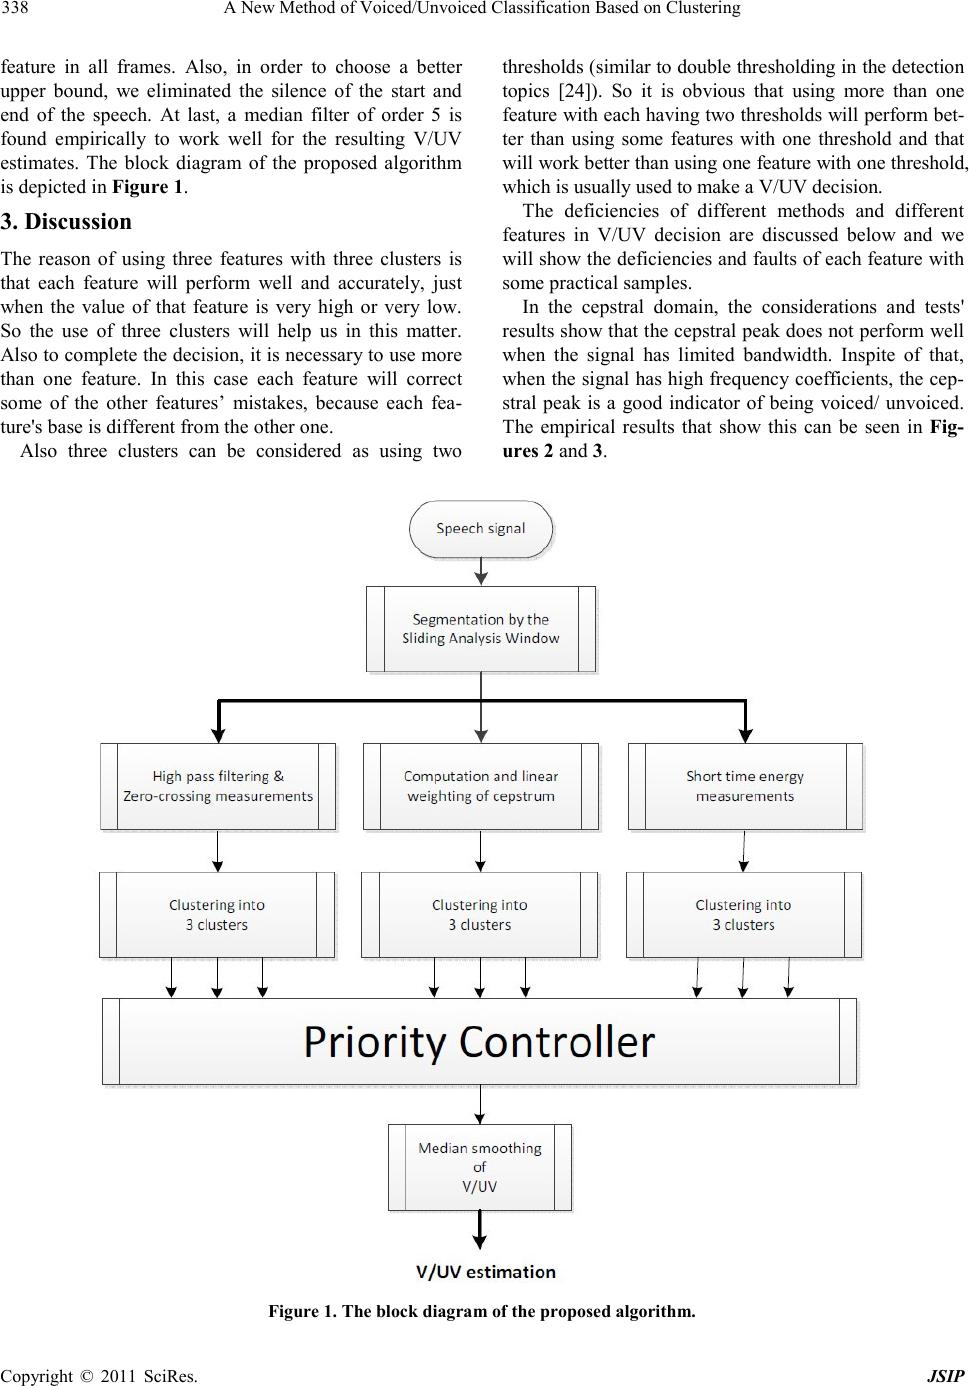 A New Method of Voiced/Unvoiced Classification Based on Clustering Copyright © 2011 SciRes. JSIP 338 feature in all frames. Also, in order to choose a better upper bound, we eliminated the silence of the start and end of the speech. At last, a median filter of order 5 is found empirically to work well for the resulting V/UV estimates. The block diagram of the proposed algorithm is depicted in Fig ur e 1. 3. Discussion The reason of using three features with three clusters is that each feature will perform well and accurately, just when the value of that feature is very high or very low. So the use of three clusters will help us in this matter. Also to complete the decision, it is necessary to use more than one feature. In this case each feature will correct some of the other features’ mistakes, because each fea- ture's base is different from the other one. Also three clusters can be considered as using two threshold s (similar to double threshol ding in the detection topics [24]). So it is obvious that using more than one feature with e ach having two thr esholds will pe rform bet- ter than using some features with one threshold and that will work better than using one feature with one thresho ld, which is usually used to make a V/U V decision. The deficiencies of different methods and different features in V/UV decision are discussed below and we will show the deficiencies and faults of each feature with some practical samples. In the cepstral domain, the considerations and tests' results show that the cepstral peak does not perform well when the signal has limited bandwidth. Inspite of that, whe n the signal has high fr equenc y coeffici ents, the cep- stral peak is a good indicator of being voiced/ unvoiced. The empirical results that show this can be seen in Fig- ures 2 and 3. Figur e 1. The block diagram of the proposed algorithm. 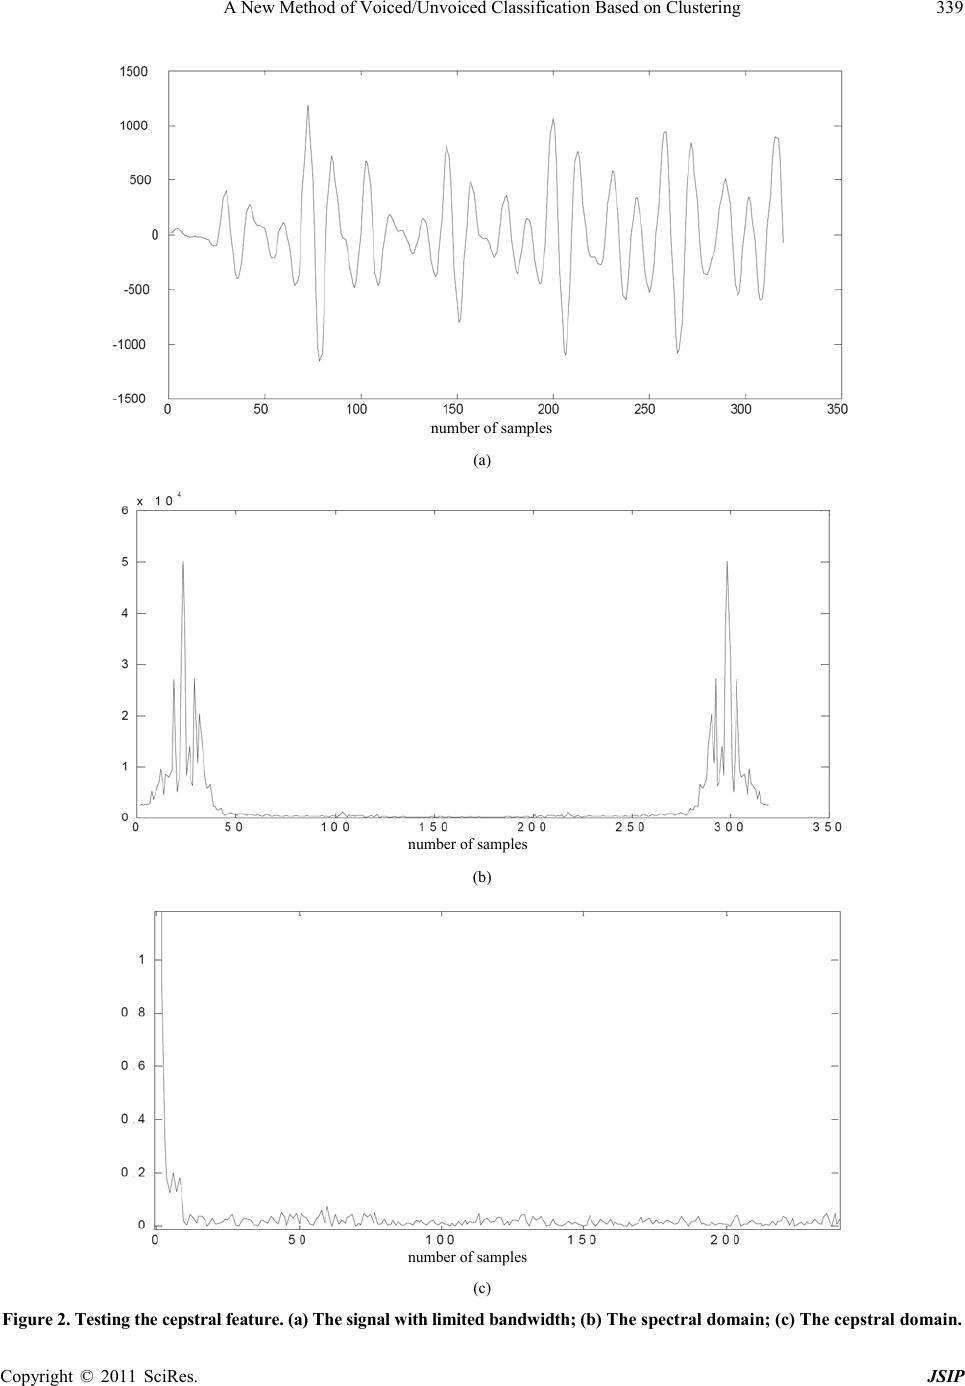 A New Method of Voiced/Unvoiced Classification Based on Clustering Copyright © 2011 SciRes. JSIP 339 number of samples (a) number of samples (b) number of samples (c) Figur e 2. Testing the cepstral feature. (a) The signal with limited bandwidth; (b) The spectral domain; (c) The cep s t ral domain. 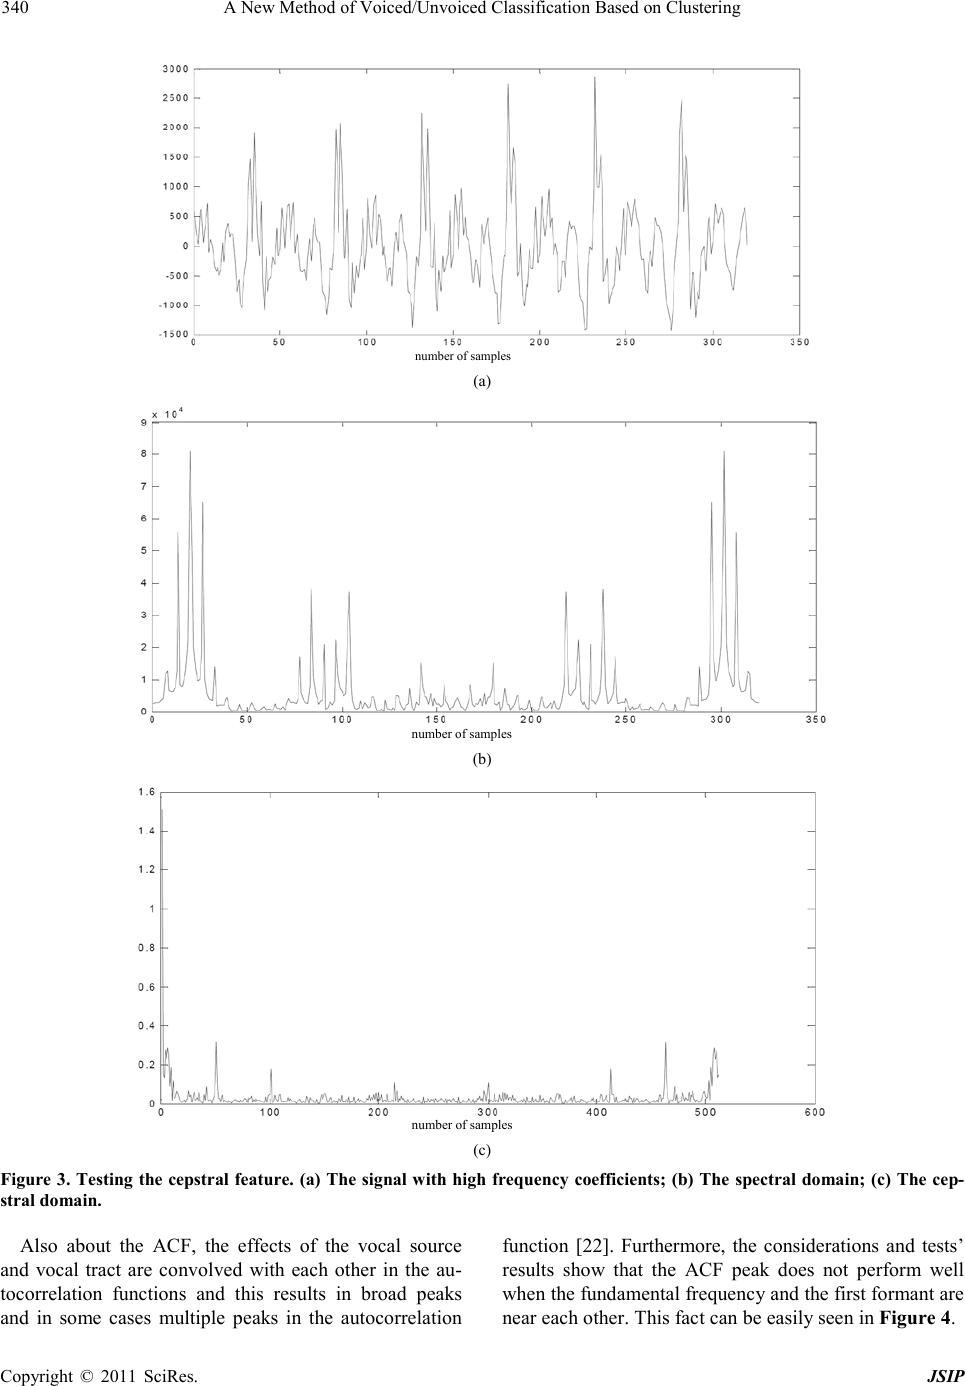 A New Method of Voiced/Unvoiced Classification Based on Clustering Copyright © 2011 SciRes. JSIP 340 number of samples (a) number of samples (b) number of samples (c) Figure 3. Testing the cepstral feature. (a) The signal with high frequency coefficients; (b) The spectral domain; (c) The cep- stral domain. Also about the ACF, the effects of the vocal source and vocal tract are convolved with each other in the au- tocorrelation functions and this results in broad peaks and in some cases multiple peaks in the autocorrelation function [22]. Furthermore, the considerations and tests’ results show that the ACF peak does not perform well whe n the fu nd a me nta l fre q uen c y and the first for mant are near each other. This fact can be easily seen in Figure 4. 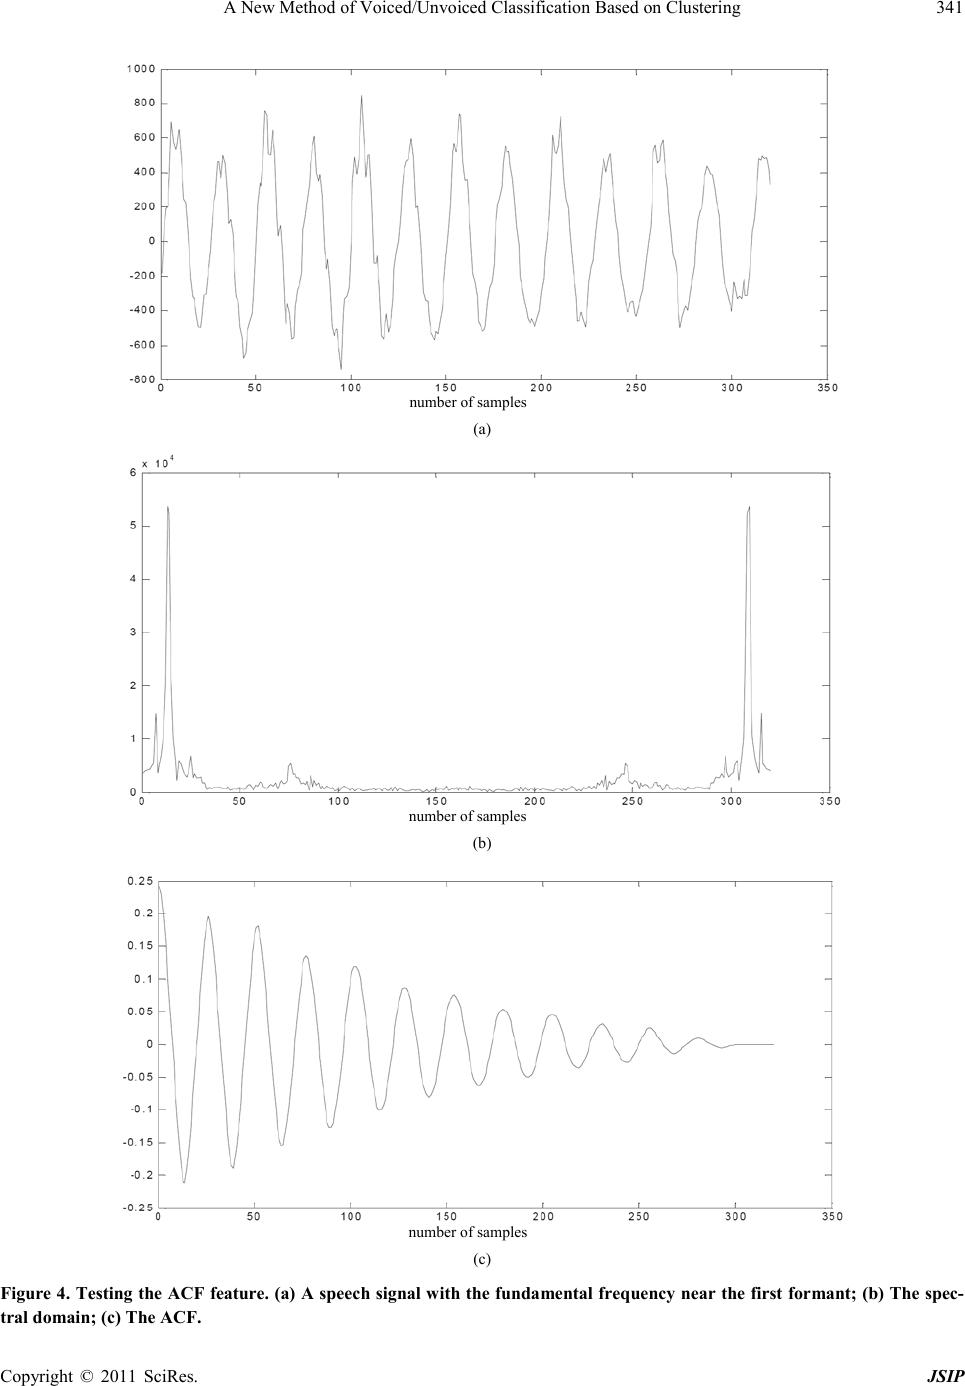 A New Method of Voiced/Unvoiced Classification Based on Clustering Copyright © 2011 SciRes. JSIP 341 number of samples (a) number of samples (b) number of samples (c) Figure 4. Testing the ACF feature. (a) A speec h signal wi th the funda mental f requenc y near the first for mant; (b) The s pec- tral d omain; (c) The ACF. 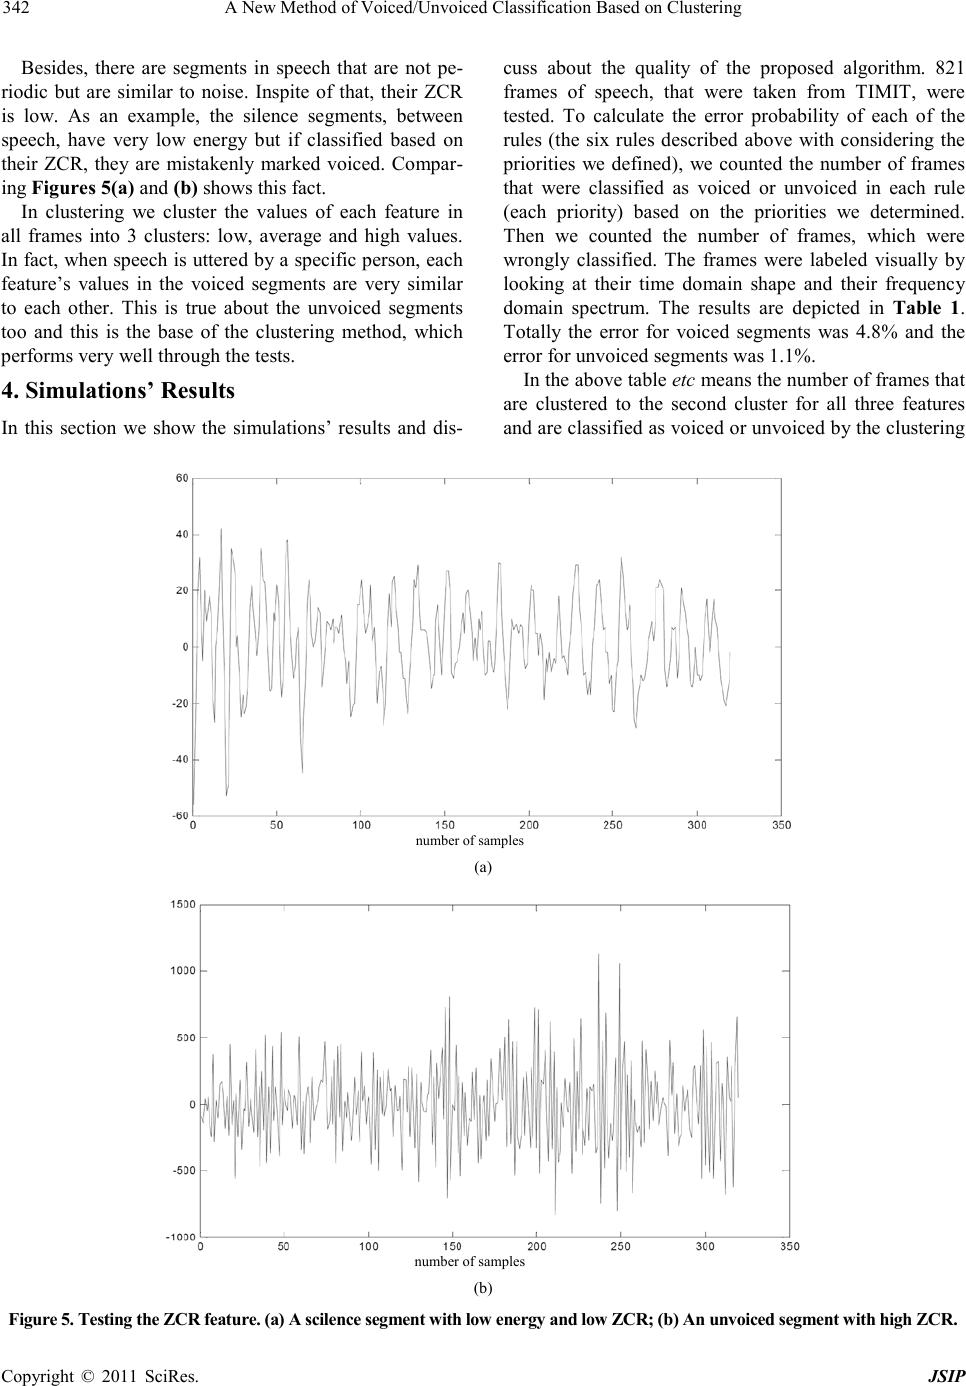 A New Method of Voiced/Unvoiced Classification Based on Clustering Copyright © 2011 SciRes. JSIP 342 Besides, there are segments in speech that are not pe- riodic but are similar to noise. Inspite of that, their ZCR is low. As an example, the silence segments, between speech, have very low energy but if classified based on their ZCR, they are mistakenly marked voiced. Compar- ing Figures 5(a) and (b) shows thi s fa ct. In clustering we cluster the values of each feature in all frames into 3 clusters: low, average and high values. In fact, when speech is uttered by a specific person, each feature’s values in the voiced segments are very similar to each other. This is true about the unvoiced segments too and this is the base of the clustering method, which performs very we ll through the tests. 4. Simulations’ Results In this section we show the simulations’ results and dis- cuss about the quality of the proposed algorithm. 821 frames of speech, that were taken from TIMIT, were tested. To calculate the error probability of each of the rules (the six rules described above with considering the priorities we defined), we counted the number of frames that were classified as voiced or unvoiced in each rule (each priority) based on the priorities we determined. Then we counted the number of frames, which were wrongly classified. The frames were labeled visually by looking at their time domain shape and their frequency domain spectrum. The results are depicted in Table 1. Totally the error for voiced segments was 4.8% and the error for unvoiced segments was 1.1%. In the above table etc means the number of frames that are clustered to the second cluster for all three features and are classified as voiced or unvoiced by the clustering number of samples (a) number of samples (b) Figure 5. Testing the ZCR feature. (a) A scilence segment with low energy and low ZCR; (b) An unvoiced segment with high ZCR. 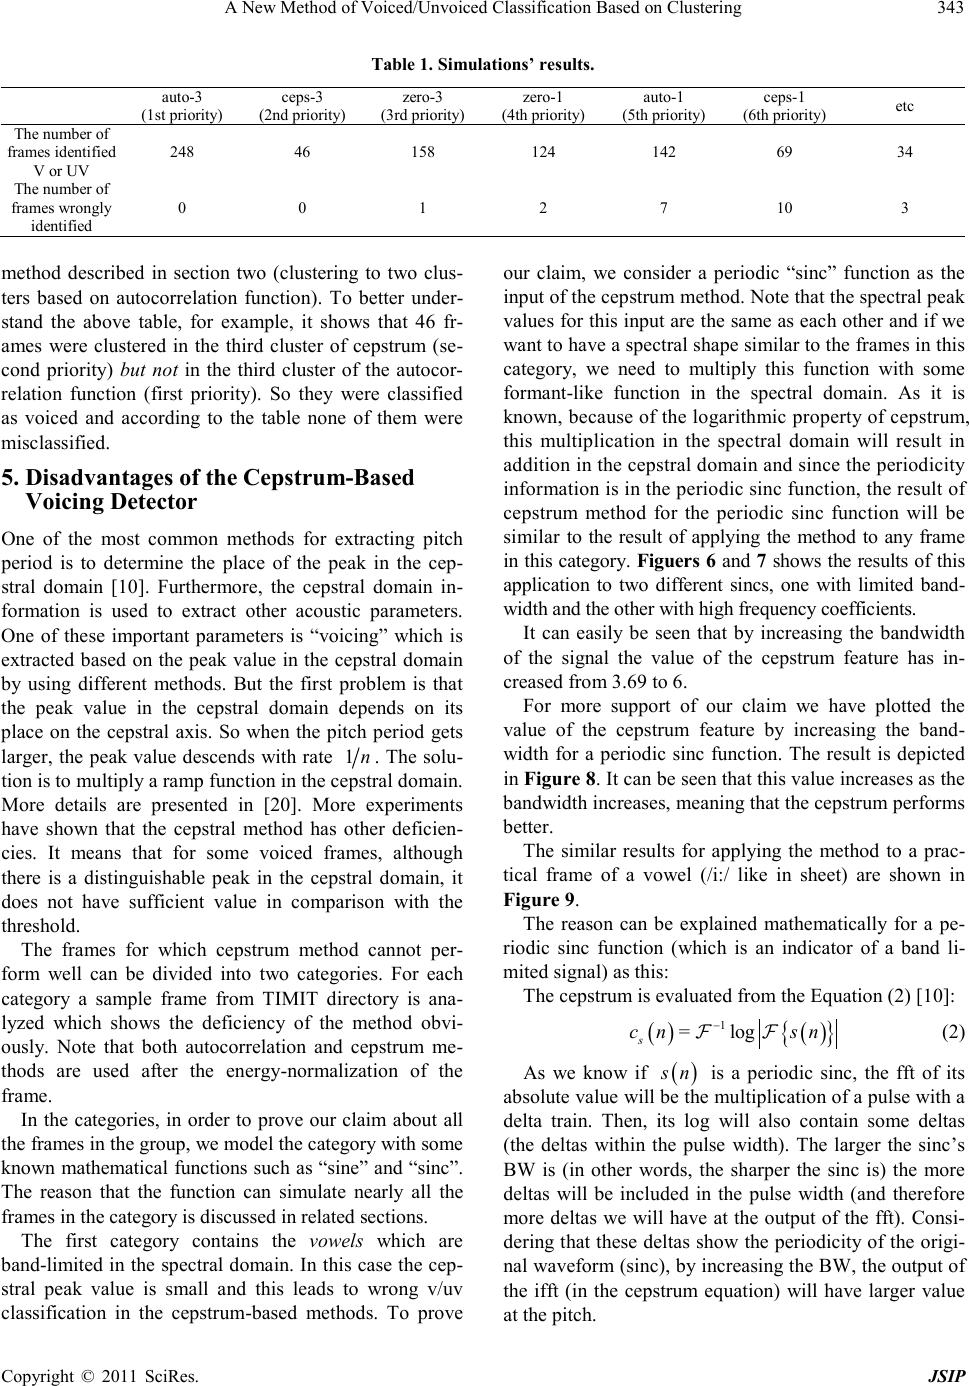 A New Method of Voiced/Unvoiced Classification Based on Clustering Copyright © 2011 SciRes. JSIP 343 Table 1. Simulations ’ result s. auto-3 (1st priority) ceps-3 (2nd priority) zero-3 (3rd priority) zero-1 (4th pr io rity) auto-1 (5th pr io rity) ceps-1 (6th pr io rity) etc The number of frames identified V or UV 248 46 158 124 142 69 34 The number of frames wrongly identified 0 0 1 2 7 10 3 method described in section two (clustering to two clus- ters based on autocorrelation function). To better under- stand the above table, for example, it shows that 46 fr- ames were clustered in the third cluster of cepstrum (se- cond priority) but not in the third cluster of the autocor- relation function (first priority). So they were classified as voiced and according to the table none of them were misclassified. 5. Disadvantages of the Cepstrum-Based Voicing Detector One of the most common methods for extracting pitch period is to determine the place of the peak in the cep- stral domain [10]. Furthermore, the cepstral domain in- formation is used to extract other acoustic parameters. One of these important parameters is “voicing” which is extracted based on the peak value in the cepstral domain by using different methods. But the first problem is that the peak value in the cepstral domain depends on its place on the cepstral axis. So when the pitch period gets larger, the peak value descends with rate 1n . T he solu- tion is to multip ly a ramp function in the cepstra l domain. More details are presented in [20]. More experiments have shown that the cepstral method has other deficien- cies. It means that for some voiced frames, although there is a distinguishable peak in the cepstral domain, it does not have sufficient value in comparison with the threshold. The frames for which cepstrum method cannot per- form well can be divided into two categories. For each category a sample frame from TIMIT directory is ana- lyzed which shows the deficiency of the method obvi- ously. Note that both autocorrelation and cepstrum me- thods are used after the energy-normalization of the frame. In the categories, in order to prove our claim about all the frames in the gro up, we mo del the cate gor y with some known mathematical functions such as “sine” and “sinc”. The reason that the function can simulate nearly all the frames in the category is discussed in related sections. The first category contains the vowels which are band-limited in the spectral domain. In this case the cep- stral peak value is small and this leads to wrong v/uv classification in the cepstrum-based methods. To prove our claim, we consider a periodic “sinc” function as the input of the cepstrum method. Note that the spectral peak values for this input are the same as each other and if we want to have a spectral shape similar to the frames in this category, we need to multiply this function with some formant-like function in the spectral domain. As it is known, because of the logarithmic property of cepstrum, this multiplication in the spectral domain will result in addition in the cepstral domain and since the periodicity information is in the periodic sinc function, the result of cepstrum method for the periodic sinc function will be similar to the result of applying the method to any frame in thi s category. Figuers 6 and 7 shows the results of this application to two different sincs, one with limited band- width and the other with high frequency coefficients. It can easily be seen that by increasing the bandwidth of the signal the value of the cepstrum feature has in- creased from 3.69 to 6. For more support of our claim we have plotted the value of the cepstrum feature by increasing the band- width for a periodic sinc function. The result is depicted in Figure 8. It can be seen that this value increases as the bandwidth increases, meaning that the cepstrum performs better. The similar results for applying the method to a prac- tical frame of a vowel (/i:/ like in sheet) are shown in Figure 9. The reason can be explained mathematically for a pe- riodic sinc function (which is an indicator of a band li- mited signal) as this: The cepstrum is evaluated from the Equation (2) [10]: ( )( ) { } 1 = log s c nsn − (2) As we know if ( ) sn is a periodic sinc, the fft of its absolute value will be t he mul tip lication o f a p ulse with a delta train. Then, its log will also contain some deltas (the deltas within the pulse width). The larger the sinc’s BW is (in other words, the sharper the sinc is) the more deltas will be included in the pulse width (and therefore more deltas we will have at the output of the fft). Consi- dering that these deltas show the periodicity of the origi- nal wa vefo r m (si nc), by i ncre asin g the BW , the o utp ut o f the ifft (in the cepstrum equation) will have larger value at the pitch. 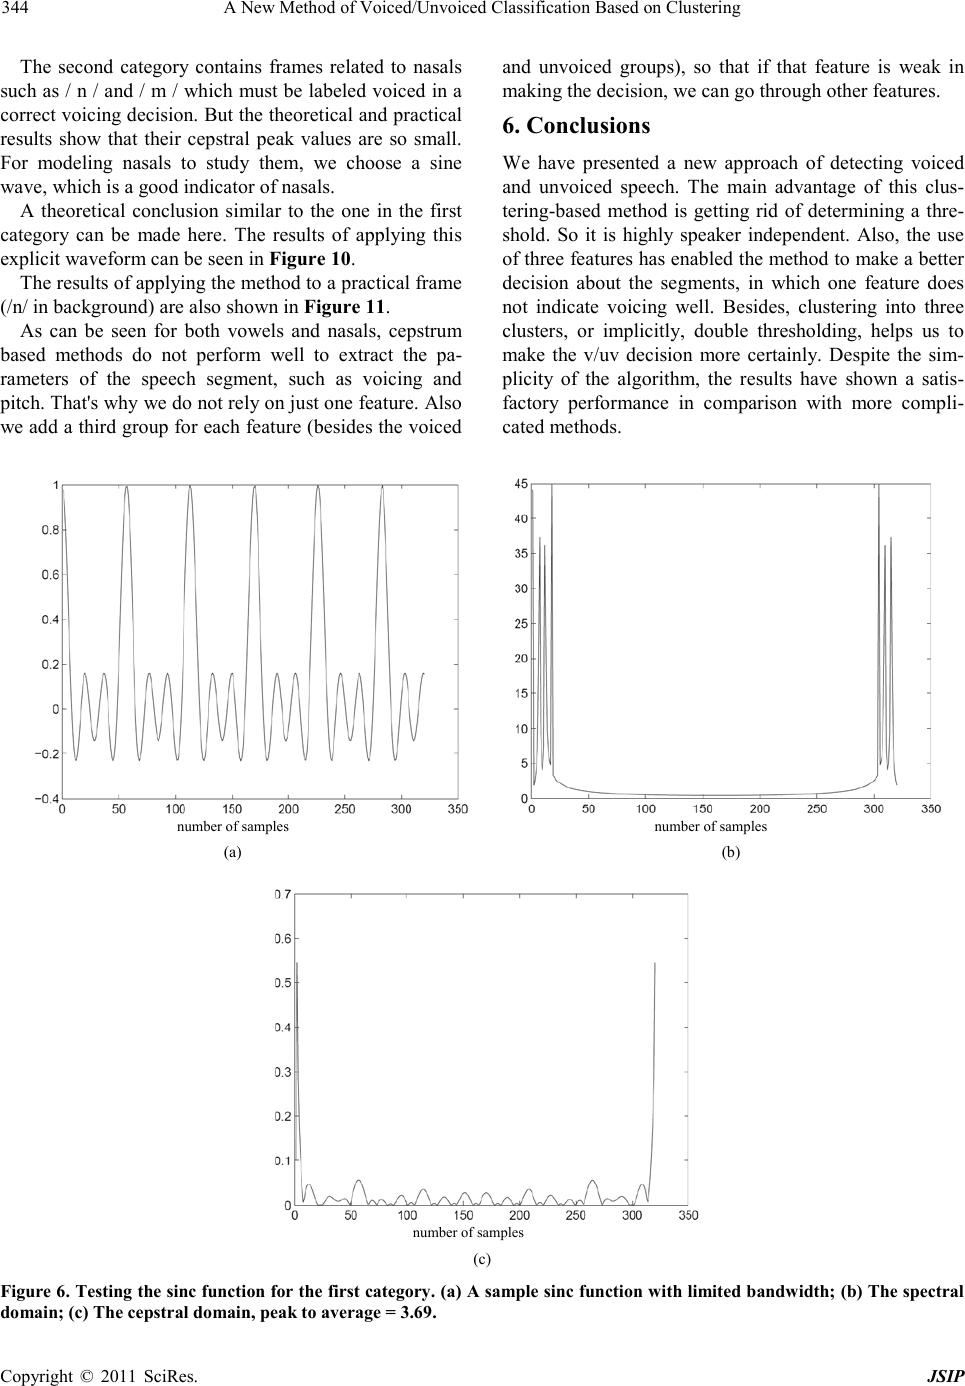 A New Method of Voiced/Unvoiced Classification Based on Clustering Copyright © 2011 SciRes. JSIP 344 The second category contains frames related to nasals such as / n / and / m / which must be labeled voiced in a correct voicing decision. But the theoretical and practical results show that their cepstral peak values are so small. For modeling nasals to study them, we choose a sine wave, which is a good indicator of nasals. A theoretical conclusion similar to the one in the first category can be made here. The results of applying this explicit waveform can be seen in Figure 10. The results of applying the method to a practical frame (/n/ in background) are a l s o shown in Figure 11. As can be seen for both vowels and nasals, cepstrum based methods do not perform well to extract the pa- rameters of the speech segment, such as voicing and pitch. That's why we do not rely on just one feature. Also we add a third group for each feature (besides the voiced and unvoiced groups), so that if that feature is weak in making the dec i s ion, we can go t hroug h other features. 6. Conclusions We have presented a new approach of detecting voiced and unvoiced speech. The main advantage of this clus- tering-based method is getting rid of determining a thre- shold. So it is highly speaker independent. Also, the use of three features has enabled the method to make a better decision about the segments, in which one feature does not indicate voicing well. Besides, clustering into three clusters, or implicitly, double thresholding, helps us to make the v/uv decision more certainly. Despite the sim- plicity of the algorithm, the results have shown a satis- factory performance in comparison with more compli- cated methods. number of samples number of samples (a) (b ) number of samples (c) Fig ure 6. Testi ng the si nc funct ion for t he first categ ory. (a) A sample sinc function with limited bandwidth; (b) T he spectral doma in; (c) The cepst ral domain, peak to average = 3.69. 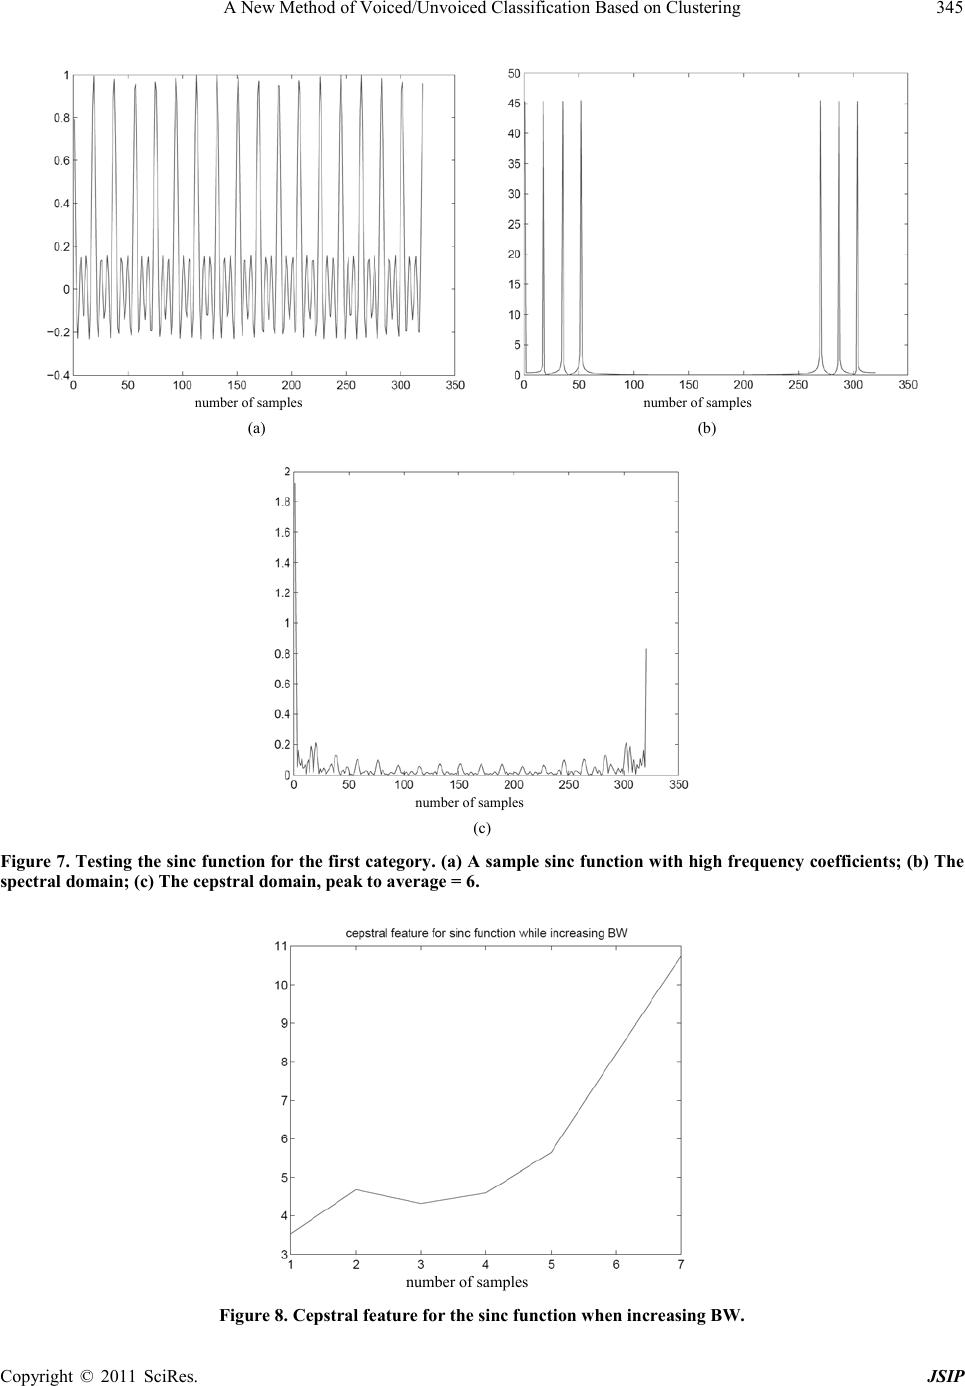 A New Method of Voiced/Unvoiced Classification Based on Clustering Copyright © 2011 SciRes. JSIP 345 number of samples number of samples (a) (b) number of samples (c) Figure 7 . Testing the sinc fu nction for the first c ategory. (a) A sample si nc function w ith high freq uency coeffici ents; (b) The spectral domain; (c) The cepst ral domain, peak to average = 6 . number of samples Figure 8. Cepstral feature for the s inc f unction when incre a sing BW. 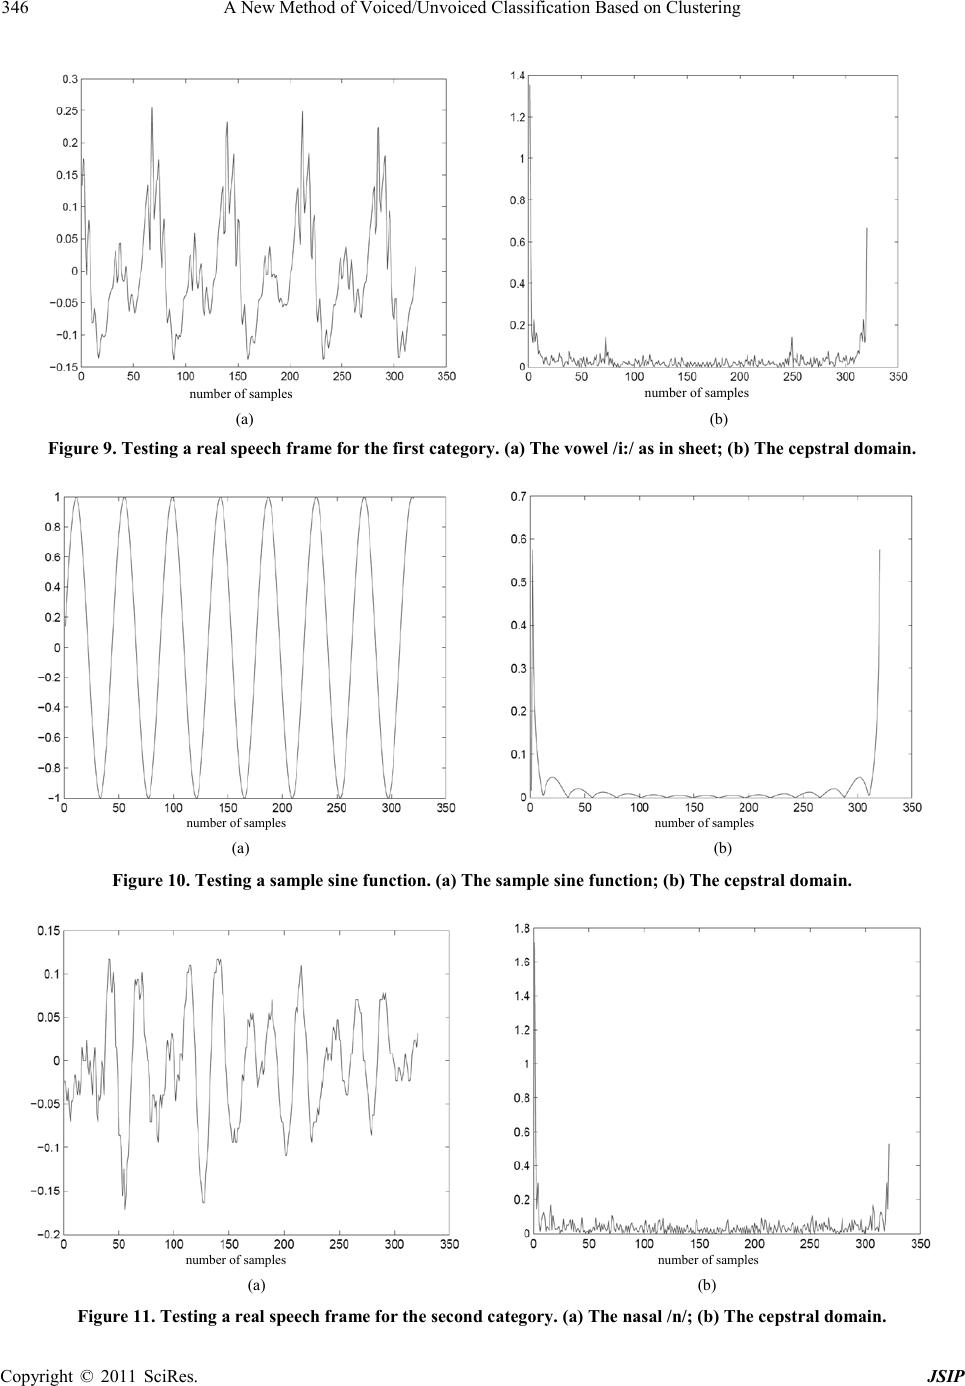 A New Method of Voiced/Unvoiced Classification Based on Clustering Copyright © 2011 SciRes. JSIP 346 number of samples number of samples (a) (b) Figure 9 . Testing a real sp eech fra me f or the first category. (a) The vowel / i:/ as in sheet; (b) The cepstral domain. number of samples number of samples (a) (b) Figure 1 0. Testing a sample sine functi o n. (a) The sample sine functi on; (b) The cepstra l do main. number of samples number of samples (a) (b) Figure 1 1. Testing a real speech fra me f or the second category. (a) The nasal /n/; (b) The cepstral domain. 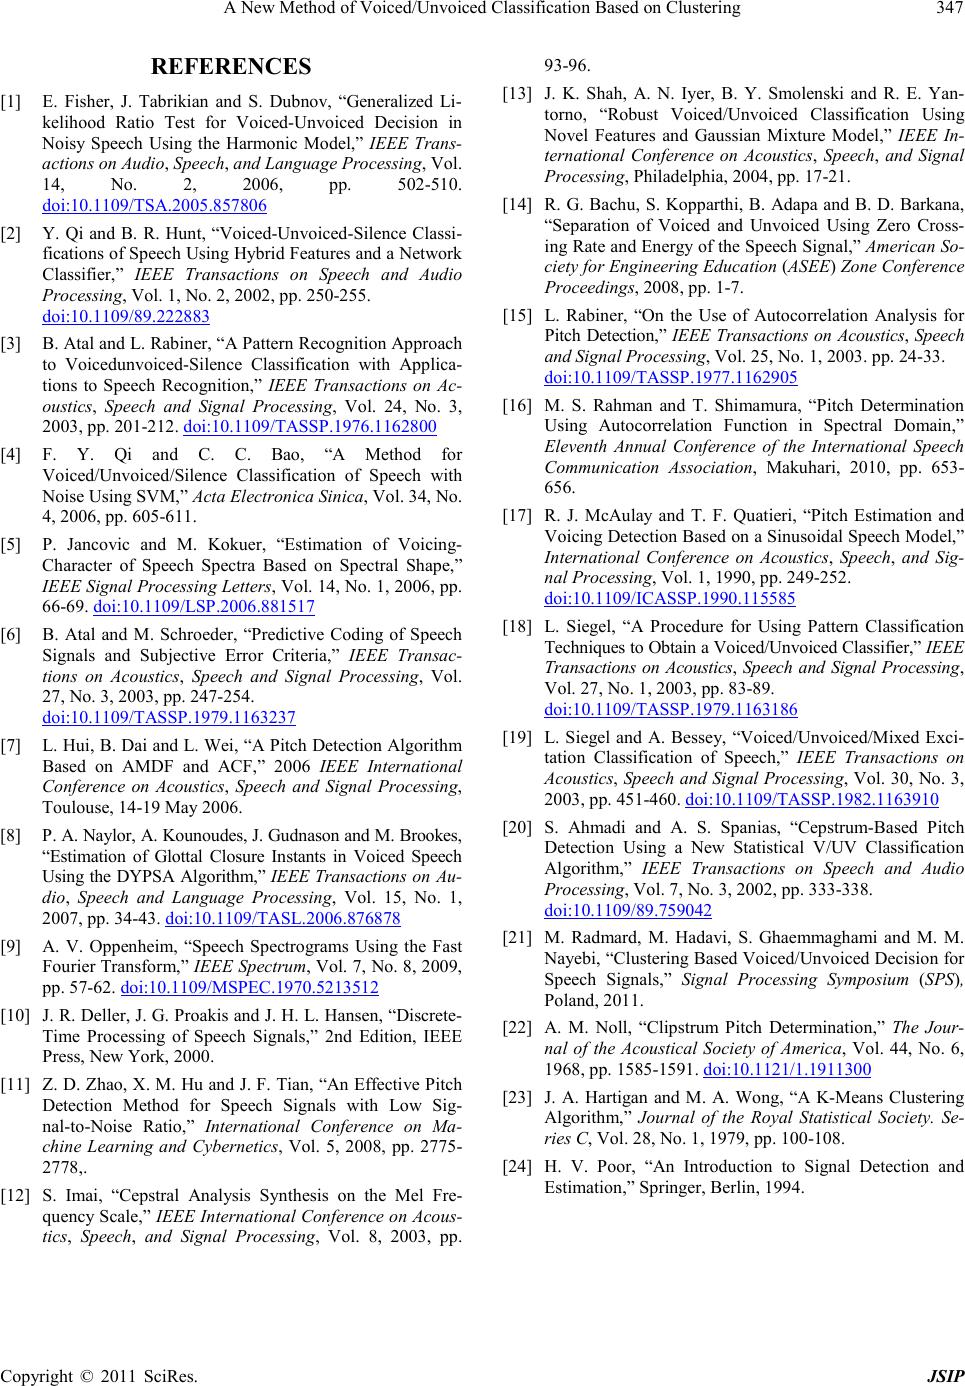 A New Method of Voiced/Unvoiced Classification Based on Clustering Copyright © 2011 SciRes. JSIP 347 REFERENCES [1] E. Fisher, J. Tabrikian and S. Dubnov, “Generalized Li- kelihood Ratio Test for Voiced-Unvoiced Decision in Noisy Speech Using the Harmonic Model,” IEEE Trans- actions on Audio, Speech, and Language Processing, Vol. 14, No. 2, 2006, pp. 502-510. doi:10.1109/TSA.2005.857806 [2] Y. Qi and B. R. Hunt, “Voiced-Unvoiced-Silence Classi- fications of Speech Using Hybrid Features and a Network Classifier,” IEEE Transactions on Speech and Audio Processing , Vol. 1, No. 2, 2002, pp. 250-255. doi:10.1109/89.222883 [3] B. Atal an d L. Rab in er, “A P atter n R ecogn ition Approach to Voicedunvoi ced-Silence Classification with Applica- tions to Speech Recognition,” IEEE Transactions on Ac- oustics, Speech and Signal Processing, Vol. 24, No. 3, 2003, pp. 201-212. doi:10.1109/TASSP.1976.1162800 [4] F. Y. Qi and C. C. Bao, “A Method for Voiced/Unvoiced/Silence Classification of Speech with Noise Using SVM,” Acta Electronica Sinica, Vol. 34, No. 4, 2006, pp. 605-611. [5] P. Jancovic and M. Kokuer, “Estimation of Voicing- Character of Speech Spectra Based on Spectral Shape,” IEEE Signal Processing Letters, Vol. 14, No. 1, 2006 , pp . 66-69. doi:10.1109/LSP.2006.881517 [6] B. Atal and M. Schroeder, “Predictive Coding of Speech Signals and Subjective Error Criteria,” IEEE Transac- tions on Acoustics, Speech and Signal Processing, Vol. 27, No. 3, 2003, pp. 247-254. doi:10.1109/TASSP.1979.1163237 [7] L. Hui, B. Dai and L. Wei, “A Pitch Detection Algorithm Based on AMDF and ACF,” 2006 IEEE International Conference on Acoustics, Speech and Signal Processing, Toulouse, 14-19 May 2006. [8] P. A. Naylor, A. Kounoudes, J. Gudnason and M. Brookes, “Estimation of Glottal Closure Instants in Voiced Speech Using th e DYPSA Algorithm,” IEEE Transactions on Au- dio, Speech and Language Processing, Vol. 15, No. 1, 2007, pp. 34-43. doi:10.1109/TASL.2006.876878 [9] A. V. Oppenheim, “Speech Spectrograms Using the Fast Fourier Transform,” IEEE Spectrum, Vol. 7, No. 8, 2009, pp. 57-62. doi:10.1109/MSPEC.1970.5213512 [10] J. R. Deller, J. G. P ro ak is and J. H. L. Hansen , “Discrete- Time Processing of Speech Signals,” 2nd Edition, IEEE Press , New York, 2000. [11] Z. D. Zhao, X. M. Hu and J. F. Ti an, “An Effecti ve Pitch Detection Method for Speech Signals with Low Sig- nal-to-Noise Ratio,” International Conference on Ma- chine Learning and Cybernetics, Vol. 5, 2008, pp. 2775- 2778,. [12] S. Imai, “Cepstral Analysis Synthesis on the Mel Fre- quen cy Scale,” IEEE International Conference on Acous- tics, Speech, and Signal Processing, Vol. 8, 2003, pp. 93-96. [13] J. K. Shah, A. N. Iyer, B. Y. Smolenski and R. E. Yan- torno, “Robust Voiced/Unvoiced Classification Using Novel Features and Gaussian Mixture Model,” IEEE In- ternational Conference on Acoustics, Speech, and Signal Processing , Philadelphia, 2004, pp. 17-21. [14] R. G. Bachu, S. Kopparthi, B. Adapa and B. D. Barkana, “Separation of Voiced and Unvoiced Using Zero Cro ss- ing Rate an d Energy of the S peech Signal,” A merica n S o- ciety for Engineering Education (ASEE) Zone Conference Proceedings, 2008, pp. 1-7. [15] L. Rabiner, “On the Use of Autocorrelation Analysis for Pitch Detection,” IEEE Transactions on Acoustics, Speech and Signal Processing, Vol. 25, No. 1, 2003. pp. 24-33. doi:10.1109/TASSP.1977.1162905 [16] M. S. Rahman and T. Shimamura, “Pitch Determination Using Autocorrelation Function in Spectral Domain,” Eleventh Annual Conference of the International Speech Communication Association, Makuhar i, 2010, pp. 653- 656. [17] R. J. McAulay and T. F. Quatieri, “Pitch Estimation and Voi cing Detectio n Based on a Sinusoidal Speech Model,” International Conference on Acoustics, Speech, and Sig- nal Proc e s s ing, Vol. 1, 1990, pp. 249-252. doi:10.1109/ICASSP.199 0.115585 [18] L. Siegel, “A Procedure for Using Pattern Classification Techniques to Obtain a Vo iced /Un voi ced Cl as si fier ,” IEEE Transactions on Acoustics, Speech and Signal Processing, Vol. 27, No. 1, 2003, pp. 83-89. doi:10.1109/TASSP.1979.1163186 [19] L. Siegel and A. Bessey, “Voiced/Unvoiced/Mixed Exci- tation Classification of Speech,” IEEE Transactions on Acou stics, Speech and Signal Processing, Vol. 30, No. 3, 2003, pp. 451-460. doi:10.1109/TASSP.1982.1163910 [20] S. Ahmadi and A. S. Spanias, “Cepstrum-Based Pitch Detection Using a New Statistical V/UV Classification Algorithm,” IEEE Transactions on Speech and Audio Processing, Vol. 7, No. 3, 2002, pp. 333-338. doi:10.1109/89.759042 [21] M. Radmard, M. Hadavi, S. Ghaemmaghami and M. M. Naye bi, “Cluster ing Based Voiced/Un voiced Decis ion for Speech Signals,” Signal Processing Symposium (SPS), Poland, 2011. [22] A. M. Noll, “Clipstrum Pitch Determination,” The Jour- nal of the Acoustical Society of America, Vol. 44, No. 6, 1968, pp. 1585-1591. doi:10.1121/1.1911300 [23] J. A. Hartigan and M. A. Wong, “A K-Means Clustering Algorithm,” Journal of the Royal Statistical Society. Se- ries C, Vol. 28, No. 1, 1979, pp. 100-108. [24] H. V. Poor, “An Introduction to Signal Detection and Estimation,” Springer, Berlin, 1994. |