

Paper Menu >>
Journal Menu >>
 J. Biomedical Science and Engineering, 2009, 2, 543-549 doi: 10.4236/jbise.2009.27079 Published Online November 2009 (http://www.SciRP.org/journal/jbise/ JBiSE ). Published Online November 2009 in SciRes. http://www.scirp.org/journal/jbise Retinal vasculature enhancement using independent component analysis Ahmad Fadzil M. Hani1*, Hanung Adi Nugroho1,2** 1Department of Electrical and Electronic Engineering, Universiti Teknologi PETRONAS, Bandar Seri Iskandar, Tronoh, Perak Darul Ridzuan, Malaysia; 2Department of Electrical Engineering, Univeristas Gadjah Mada, Jl. Grafika 2, Kampus UGM, Jogjakarta, Indo- nesia. Email: *[email protected]; **[email protected] Received 22 June 2009; revised 16 July 2009; accepted 24 July 2009. ABSTRACT Retinal vasculature is a network of vessels in the retinal layer. In ophthalmology, information of reti- nal vasculature in analyzing fundus images is impor- tant for early detection of diseases related to the ret- ina, e.g. diabetic retinopathy. However, in fundus images the contrast between retinal vasculature and the background is very low. As a result, analyzing or visualizing tiny retinal vasculature is difficult. There- fore, enhancement of retinal vasculature in digital fundus image is important to provide better visuali- zation of retinal blood vessels as well as to increase accuracy of retinal vasculature segmentation. Fluo- rescein angiogram overcomes this imaging problem but it is an invasive procedure that leads to other physiological problems. In this research work, the low contrast problem of retinal fundus images ob- tained from fundus camera is addressed. We develop a fundus image model based on probability distribu- tion function of melanin, haemoglobin and macular pigment to represent melanin, retinal vasculature and macular region, respectively. We determine reti- nal pigments makeup, namely macular pigment, melanin and haemoglobin using independent com- ponent analysis. Independent component image due to haemoglobin obtained is used since it exhibits higher contrast retinal vasculature. Contrast of reti- nal vasculature from independent component image due to haemoglobin is compared to those from other enhancement methods. Results show that this ap- proach outperforms other non-invasive enhancement methods, such as contrast stretching, histogram eq- ualization and CLAHE and can be beneficial for retinal vasculature segmentation. Contrast enhance- ment factor up to 2.62 for a digital retinal fundus image model is achieved. This improvement in con- trast reduces the need of applying contrasting agent on patients. Keywords: Contrast Enhancement; Independent Comp- onent Analysis; Medical Image Processing; Retinal Fundus Image 1. INTRODUCTION Analyzing retinal fundus image is important for early detection of several diseases related to the retina, e.g. diabetic retinopathy. In diabetic retinopathy, retinal capi- llary occlusion occurs and accordingly causes enlarge- ment of foveal avascular zone. Foveal avascular zone is the fovea where there is no blood vessels and located in the very centre of macula. Information of retinal vascu- lature is important to accurately determine the foveal av- ascular zone. However, digital color fundus images ob- tained from fundus camera suffer from several problems as can be seen from Figure 1. Figure 1(a) illustrates the problems of very low contrast and non-uniform illumi- nation which can be seen at the area towards the edge of the image. Figure 1(b) shows the occurrence of noise which consists of impulse and Gaussian noises. Detec- tion of the foveal avascular zone is even difficult due to very low image contrast of retinal vasculature against the background in the macular region. A number of enhancement methods focused in the im- age spatial domain [2,3,4,5]. Histogram equalization wi- th its modification is commonly used to enhance the im- age contrast [6]. However, histogram equalization tends to over-enhance the image and results in noisy appear- ance of the output image. One of the adaptive methods called contrast limited adaptive histogram equalization (CLAHE) worked well on the enhancement of retinal vasculature [7]. Iznita found that the contrast improve- ment using contrast limited adaptive histogram equaliza- tion on an image model ranges between 1.7 and 3 [8]. However, contrast limited adaptive histogram equaliza- tion creates artefacts in the enhanced image and the se- lection of contrast gain limit is image-dependent. Other related works used the information of color taken from digital color images [9,10]. Colors observed 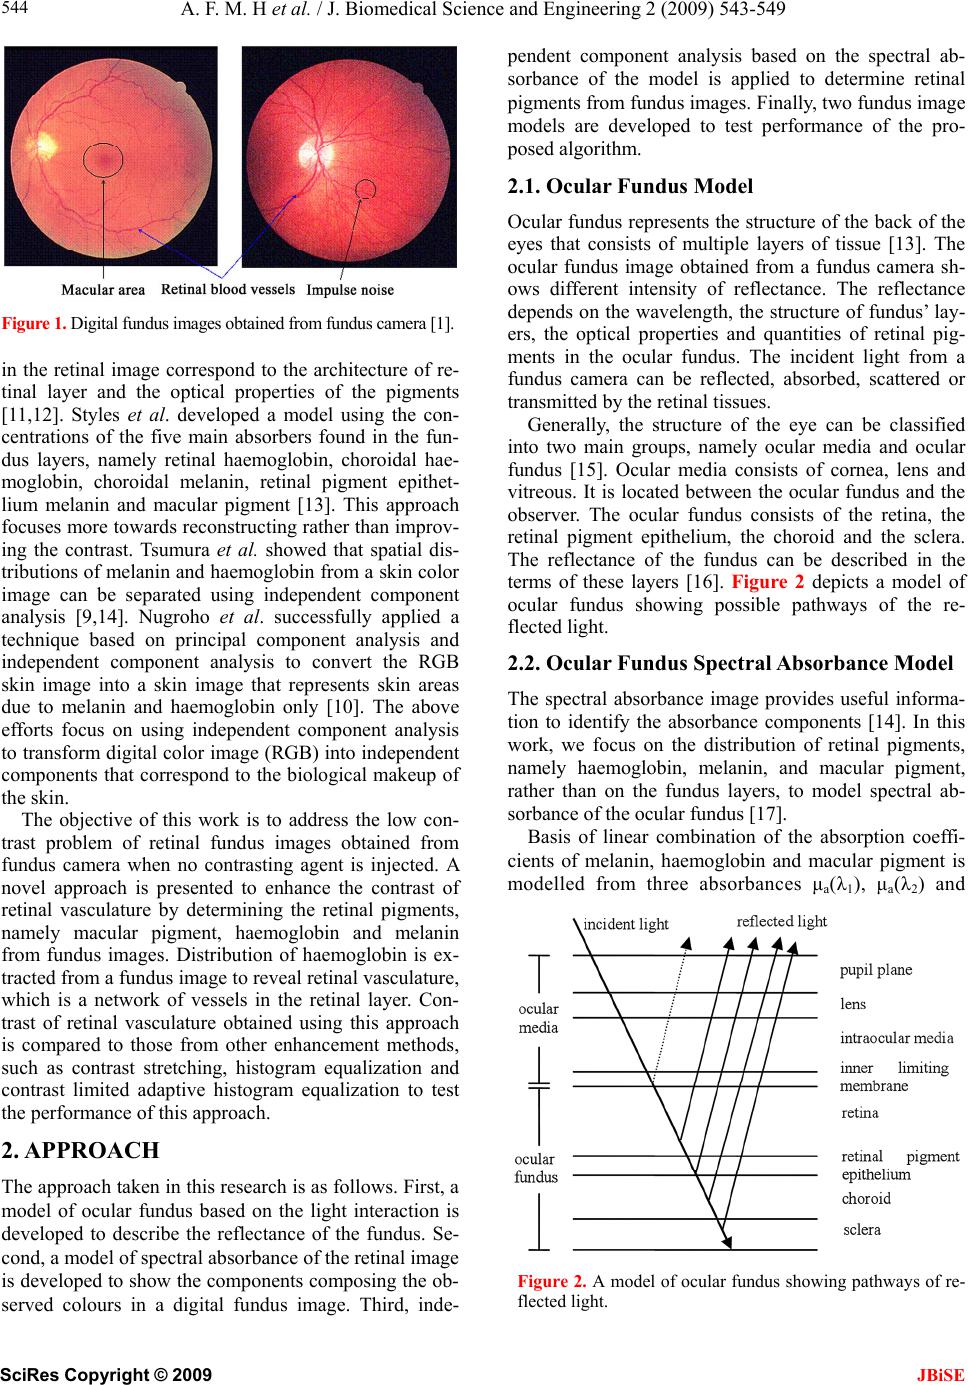 A. F. M. H et al. / J. Biomedical Science and Engineering 2 (2009) 543-549 SciRes Copyright © 2009 JBiSE 544 Figure 1. Digital fundus images obtained from fundus camera [1]. in the retinal image correspond to the architecture of re- tinal layer and the optical properties of the pigments [11,12]. Styles et al. developed a model using the con- centrations of the five main absorbers found in the fun- dus layers, namely retinal haemoglobin, choroidal hae- moglobin, choroidal melanin, retinal pigment epithet- lium melanin and macular pigment [13]. This approach focuses more towards reconstructing rather than improv- ing the contrast. Tsumura et al. showed that spatial dis- tributions of melanin and haemoglobin from a skin color image can be separated using independent component analysis [9,14]. Nugroho et al. successfully applied a technique based on principal component analysis and independent component analysis to convert the RGB skin image into a skin image that represents skin areas due to melanin and haemoglobin only [10]. The above efforts focus on using independent component analysis to transform digital color image (RGB) into independent components that correspond to the biological makeup of the skin. The objective of this work is to address the low con- trast problem of retinal fundus images obtained from fundus camera when no contrasting agent is injected. A novel approach is presented to enhance the contrast of retinal vasculature by determining the retinal pigments, namely macular pigment, haemoglobin and melanin from fundus images. Distribution of haemoglobin is ex- tracted from a fundus image to reveal retinal vasculature, which is a network of vessels in the retinal layer. Con- trast of retinal vasculature obtained using this approach is compared to those from other enhancement methods, such as contrast stretching, histogram equalization and contrast limited adaptive histogram equalization to test the performance of this approach. 2. APPROACH The approach taken in this research is as follows. First, a model of ocular fundus based on the light interaction is developed to describe the reflectance of the fundus. Se- cond, a model of spectral absorbance of the retinal image is developed to show the components composing the ob- served colours in a digital fundus image. Third, inde- pendent component analysis based on the spectral ab- sorbance of the model is applied to determine retinal pigments from fundus images. Finally, two fundus image models are developed to test performance of the pro- posed algorithm. 2.1. Ocular Fundus Model Ocular fundus represents the structure of the back of the eyes that consists of multiple layers of tissue [13]. The ocular fundus image obtained from a fundus camera sh- ows different intensity of reflectance. The reflectance depends on the wavelength, the structure of fundus’ lay- ers, the optical properties and quantities of retinal pig- ments in the ocular fundus. The incident light from a fundus camera can be reflected, absorbed, scattered or transmitted by the retinal tissues. Generally, the structure of the eye can be classified into two main groups, namely ocular media and ocular fundus [15]. Ocular media consists of cornea, lens and vitreous. It is located between the ocular fundus and the observer. The ocular fundus consists of the retina, the retinal pigment epithelium, the choroid and the sclera. The reflectance of the fundus can be described in the terms of these layers [16]. Figure 2 depicts a model of ocular fundus showing possible pathways of the re- flected light. 2.2. Ocular Fundus Spectral Absorbance Model The spectral absorbance image provides useful informa- tion to identify the absorbance components [14]. In this work, we focus on the distribution of retinal pigments, namely haemoglobin, melanin, and macular pigment, rather than on the fundus layers, to model spectral ab- sorbance of the ocular fundus [17]. Basis of linear combination of the absorption coeffi- cients of melanin, haemoglobin and macular pigment is modelled from three absorbances μa(λ1), μa(λ2) and Figure 2. A model of ocular fundus showing pathways of re- flected light. 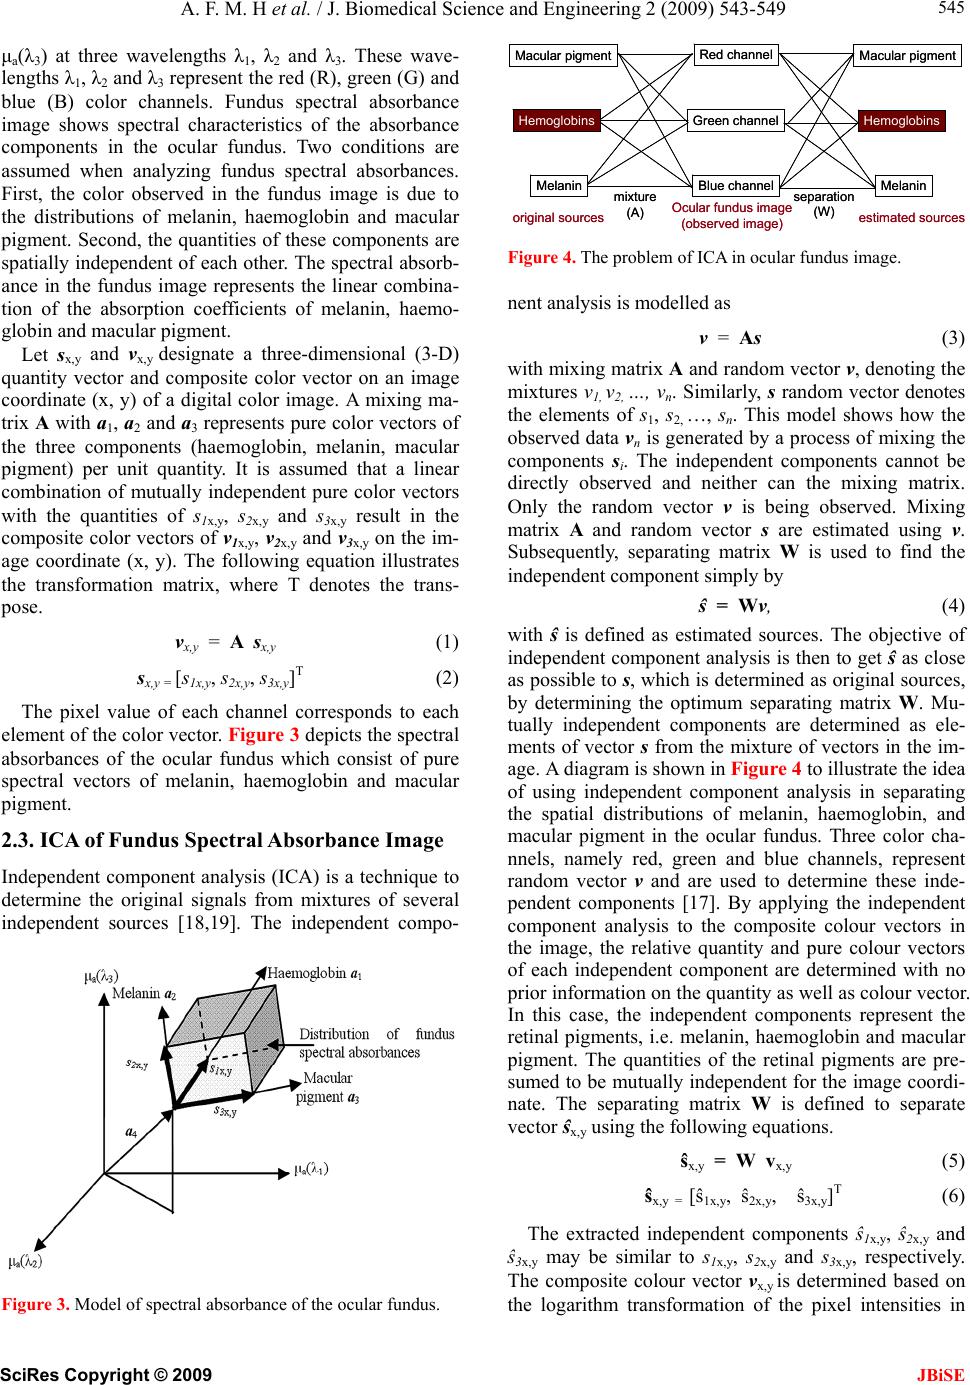 A. F. M. H et al. / J. Biomedical Science and Engineering 2 (2009) 543-549 SciRes Copyright © 2009 JBiSE 545 μa(λ3) at three wavelengths λ1, λ2 and λ3. These wave- lengths λ1, λ2 and λ3 represent the red (R), green (G) and blue (B) color channels. Fundus spectral absorbance image shows spectral characteristics of the absorbance components in the ocular fundus. Two conditions are assumed when analyzing fundus spectral absorbances. First, the color observed in the fundus image is due to the distributions of melanin, haemoglobin and macular pigment. Second, the quantities of these components are spatially independent of each other. The spectral absorb- ance in the fundus image represents the linear combina- tion of the absorption coefficients of melanin, haemo- globin and macular pigment. Let sx,y and vx,y designate a three-dimensional (3-D) quantity vector and composite color vector on an image coordinate (x, y) of a digital color image. A mixing ma- trix A with a1, a2 and a3 represents pure color vectors of the three components (haemoglobin, melanin, macular pigment) per unit quantity. It is assumed that a linear combination of mutually independent pure color vectors with the quantities of s1x,y, s2x,y and s3x,y result in the composite color vectors of v1x,y, v2x, y and v3x,y on the im- age coordinate (x, y). The following equation illustrates the transformation matrix, where T denotes the trans- pose. vx,y = A sx,y (1) sx,y = [s1x,y, s2x,y, s3x,y]T (2) The pixel value of each channel corresponds to each element of the color vector. Figure 3 depicts the spectral absorbances of the ocular fundus which consist of pure spectral vectors of melanin, haemoglobin and macular pigment. 2.3. ICA of Fundus Spectral Absorbance Image Independent component analysis (ICA) is a technique to determine the original signals from mixtures of several independent sources [18,19]. The independent compo- Figure 3. Model of spectral absorbance of the ocular fundus. Macular pigment Hemoglobins Melanin Red channel Green channel Blue channel Macular pigment Hemoglobins Melanin mixture (A) separatio n (W) original sourcesestimated source s Ocular fundus im ag e (observed ima g e) Macular pigment Hemoglobins Melanin Red channel Green channel Blue channel Macular pigment Hemoglobins Melanin mixture (A) separatio n (W) original sourcesestimated source s Ocular fundus im ag e (observed ima g e) Figure 4. The problem of ICA in ocular fundus image. nent analysis is modelled as v = As (3) with mixing matrix A and random vector v, denoting the mixtures v1, v2, …, vn. Similarly, s random vector denotes the elements of s1, s2, …, sn. This model shows how the observed data vn is generated by a process of mixing the components si. The independent components cannot be directly observed and neither can the mixing matrix. Only the random vector v is being observed. Mixing matrix A and random vector s are estimated using v. Subsequently, separating matrix W is used to find the independent component simply by ŝ = Wv, (4) with ŝ is defined as estimated sources. The objective of independent component analysis is then to get ŝ as close as possible to s, which is determined as original sources, by determining the optimum separating matrix W. Mu- tually independent components are determined as ele- ments of vector s from the mixture of vectors in the im- age. A diagram is shown in Figure 4 to illustrate the idea of using independent component analysis in separating the spatial distributions of melanin, haemoglobin, and macular pigment in the ocular fundus. Three color cha- nnels, namely red, green and blue channels, represent random vector v and are used to determine these inde- pendent components [17]. By applying the independent component analysis to the composite colour vectors in the image, the relative quantity and pure colour vectors of each independent component are determined with no prior information on the quantity as well as colour vector. In this case, the independent components represent the retinal pigments, i.e. melanin, haemoglobin and macular pigment. The quantities of the retinal pigments are pre- sumed to be mutually independent for the image coordi- nate. The separating matrix W is defined to separate vector ŝx,y using the following equations. ŝx,y = W vx,y (5) ŝx,y = [ŝ1x,y, ŝ2x,y, ŝ3x,y]T (6) The extracted independent components ŝ1x,y, ŝ2x,y and ŝ3x,y may be similar to s1x,y, s2x,y and s3x,y, respectively. The composite colour vector vx,y is determined based on the logarithm transformation of the pixel intensities in 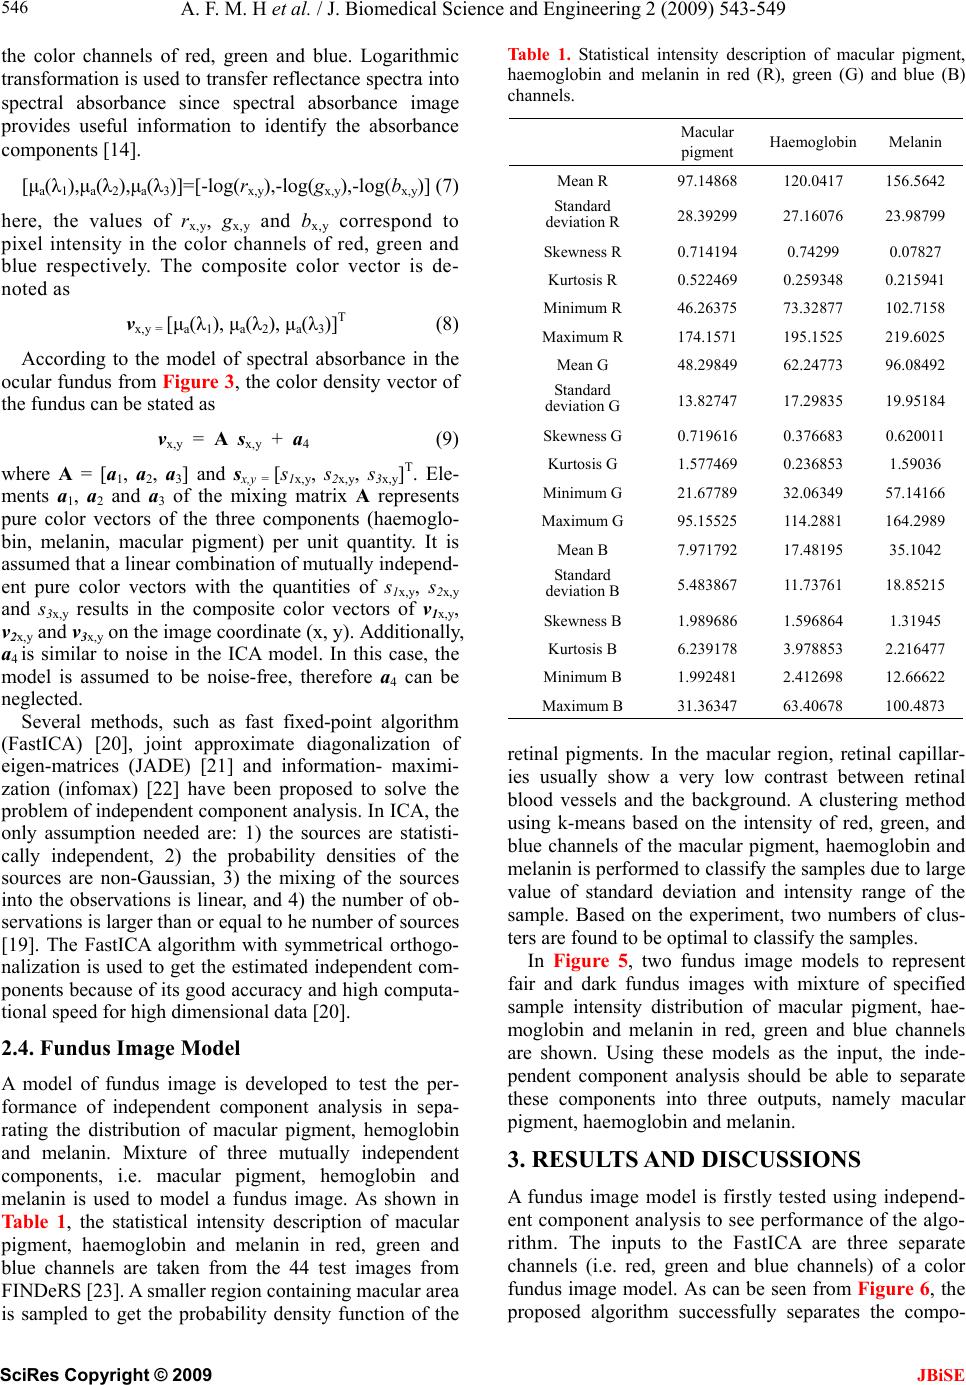 A. F. M. H et al. / J. Biomedical Science and Engineering 2 (2009) 543-549 SciRes Copyright © 2009 JBiSE 546 the color channels of red, green and blue. Logarithmic transformation is used to transfer reflectance spectra into spectral absorbance since spectral absorbance image provides useful information to identify the absorbance components [14]. [μa(λ1),μa(λ2),μa(λ3)]=[-log(rx,y),-log(gx,y),-log(bx,y)] (7) here, the values of rx,y, gx,y and bx,y correspond to pixel intensity in the color channels of red, green and blue respectively. The composite color vector is de- noted as vx,y = [μa(λ1), μa(λ2), μa(λ3)]T (8) According to the model of spectral absorbance in the ocular fundus from Figure 3, the color density vector of the fundus can be stated as vx,y = A sx,y + a4 (9) where A = [a1, a2, a3] and sx,y = [s1x,y, s2x,y, s3x,y]T. Ele- ments a1, a2 and a3 of the mixing matrix A represents pure color vectors of the three components (haemoglo- bin, melanin, macular pigment) per unit quantity. It is assumed that a linear combination of mutually independ- ent pure color vectors with the quantities of s1x,y, s2x, y and s3x,y results in the composite color vectors of v1x,y, v2x,y and v3x,y on the image coordinate (x, y). Additionally, a4 is similar to noise in the ICA model. In this case, the model is assumed to be noise-free, therefore a4 can be neglected. Several methods, such as fast fixed-point algorithm (FastICA) [20], joint approximate diagonalization of eigen-matrices (JADE) [21] and information- maximi- zation (infomax) [22] have been proposed to solve the problem of independent component analysis. In ICA, the only assumption needed are: 1) the sources are statisti- cally independent, 2) the probability densities of the sources are non-Gaussian, 3) the mixing of the sources into the observations is linear, and 4) the number of ob- servations is larger than or equal to he number of sources [19]. The FastICA algorithm with symmetrical orthogo- nalization is used to get the estimated independent com- ponents because of its good accuracy and high computa- tional speed for high dimensional data [20]. 2.4. Fundus Image Model A model of fundus image is developed to test the per- formance of independent component analysis in sepa- rating the distribution of macular pigment, hemoglobin and melanin. Mixture of three mutually independent components, i.e. macular pigment, hemoglobin and melanin is used to model a fundus image. As shown in Table 1, the statistical intensity description of macular pigment, haemoglobin and melanin in red, green and blue channels are taken from the 44 test images from FINDeRS [23]. A smaller region containing macular area is sampled to get the probability density function of the Table 1. Statistical intensity description of macular pigment, haemoglobin and melanin in red (R), green (G) and blue (B) channels. Macular pigment Haemoglobin Melanin Mean R 97.14868 120.0417 156.5642 Standard deviation R 28.39299 27.16076 23.98799 Skewness R 0.714194 0.74299 0.07827 Kurtosis R 0.522469 0.259348 0.215941 Minimum R 46.26375 73.32877 102.7158 Maximum R 174.1571 195.1525 219.6025 Mean G 48.29849 62.24773 96.08492 Standard deviation G 13.82747 17.29835 19.95184 Skewness G 0.719616 0.376683 0.620011 Kurtosis G 1.577469 0.236853 1.59036 Minimum G 21.67789 32.06349 57.14166 Maximum G 95.15525 114.2881 164.2989 Mean B 7.971792 17.48195 35.1042 Standard deviation B 5.483867 11.73761 18.85215 Skewness B 1.989686 1.596864 1.31945 Kurtosis B 6.239178 3.978853 2.216477 Minimum B 1.992481 2.412698 12.66622 Maximum B 31.36347 63.40678 100.4873 retinal pigments. In the macular region, retinal capillar- ies usually show a very low contrast between retinal blood vessels and the background. A clustering method using k-means based on the intensity of red, green, and blue channels of the macular pigment, haemoglobin and melanin is performed to classify the samples due to large value of standard deviation and intensity range of the sample. Based on the experiment, two numbers of clus- ters are found to be optimal to classify the samples. In Figure 5, two fundus image models to represent fair and dark fundus images with mixture of specified sample intensity distribution of macular pigment, hae- moglobin and melanin in red, green and blue channels are shown. Using these models as the input, the inde- pendent component analysis should be able to separate these components into three outputs, namely macular pigment, haemoglobin and melanin. 3. RESULTS AND DISCUSSIONS A fundus image model is firstly tested using independ- ent component analysis to see performance of the algo- rithm. The inputs to the FastICA are three separate channels (i.e. red, green and blue channels) of a color fundus image model. As can be seen from Figure 6, the proposed algorithm successfully separates the compo- 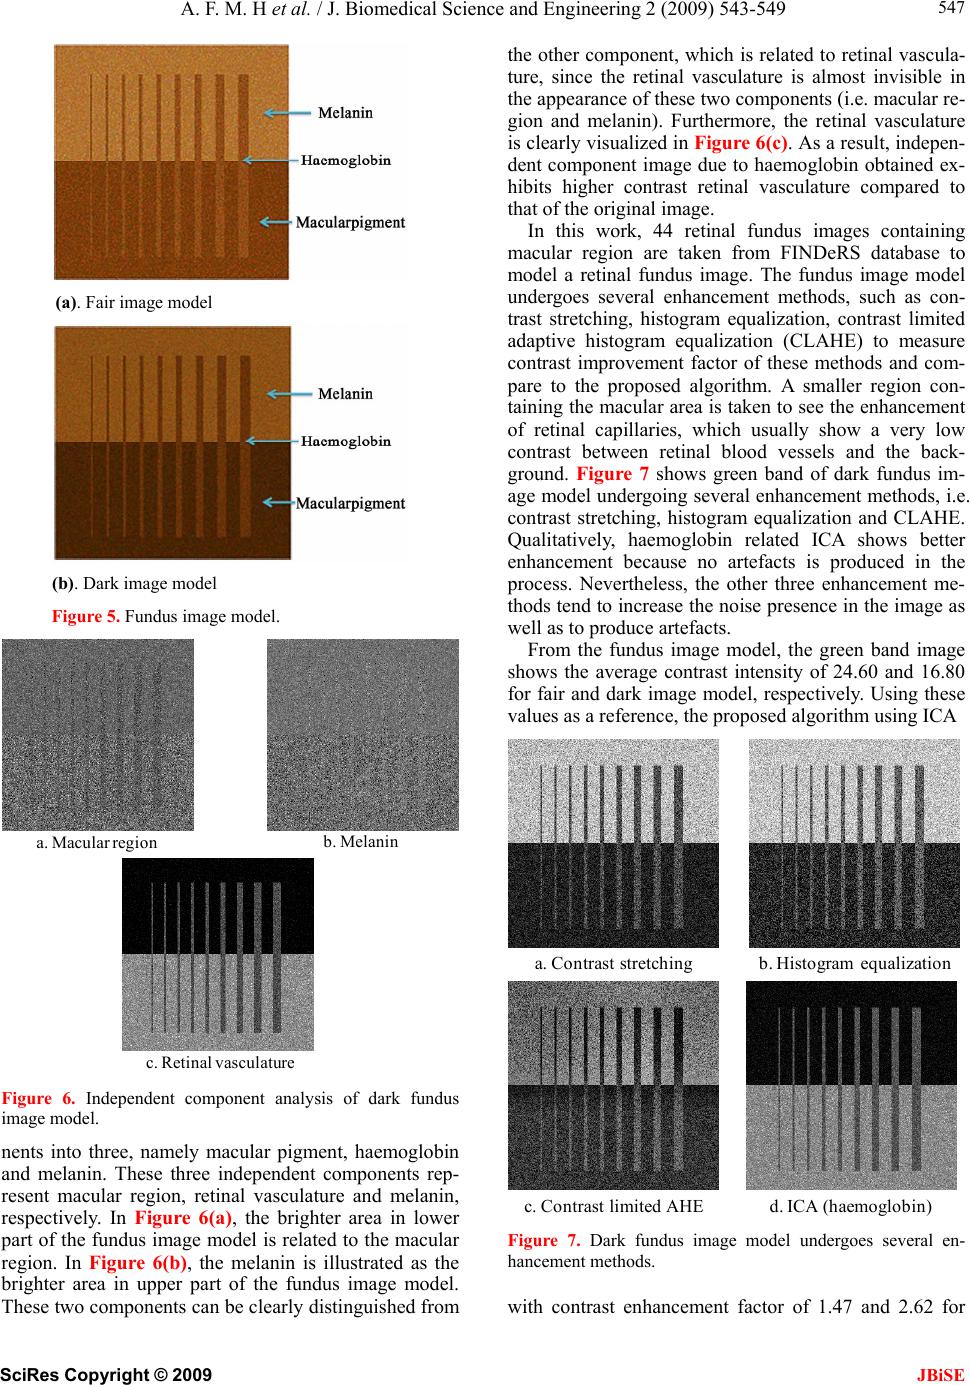 A. F. M. H et al. / J. Biomedical Science and Engineering 2 (2009) 543-549 SciRes Copyright © 2009 JBiSE 547 (a). Fair image model (b). Dark image model Figure 5. Fundus image model. a. Macular regionb. Melanin c. Retinal vasculature Figure 6. Independent component analysis of dark fundus image model. nents into three, namely macular pigment, haemoglobin and melanin. These three independent components rep- resent macular region, retinal vasculature and melanin, respectively. In Figure 6(a), the brighter area in lower part of the fundus image model is related to the macular region. In Figure 6(b), the melanin is illustrated as the brighter area in upper part of the fundus image model. These two components can be clearly distinguished from the other component, which is related to retinal vascula- ture, since the retinal vasculature is almost invisible in the appearance of these two components (i.e. macular re- gion and melanin). Furthermore, the retinal vasculature is clearly visualized in Figure 6(c). As a result, indepen- dent component image due to haemoglobin obtained ex- hibits higher contrast retinal vasculature compared to that of the original image. In this work, 44 retinal fundus images containing macular region are taken from FINDeRS database to model a retinal fundus image. The fundus image model undergoes several enhancement methods, such as con- trast stretching, histogram equalization, contrast limited adaptive histogram equalization (CLAHE) to measure contrast improvement factor of these methods and com- pare to the proposed algorithm. A smaller region con- taining the macular area is taken to see the enhancement of retinal capillaries, which usually show a very low contrast between retinal blood vessels and the back- ground. Figure 7 shows green band of dark fundus im- age model undergoing several enhancement methods, i.e. contrast stretching, histogram equalization and CLAHE. Qualitatively, haemoglobin related ICA shows better enhancement because no artefacts is produced in the process. Nevertheless, the other three enhancement me- thods tend to increase the noise presence in the image as well as to produce artefacts. From the fundus image model, the green band image shows the average contrast intensity of 24.60 and 16.80 for fair and dark image model, respectively. Using these values as a reference, the proposed algorithm using ICA a. Contrast stretchingb. Histogram equalization c. Contrast limited AHEd. ICA (haemoglobin) Figure 7. Dark fundus image model undergoes several en- hancement methods. with contrast enhancement factor of 1.47 and 2.62 for 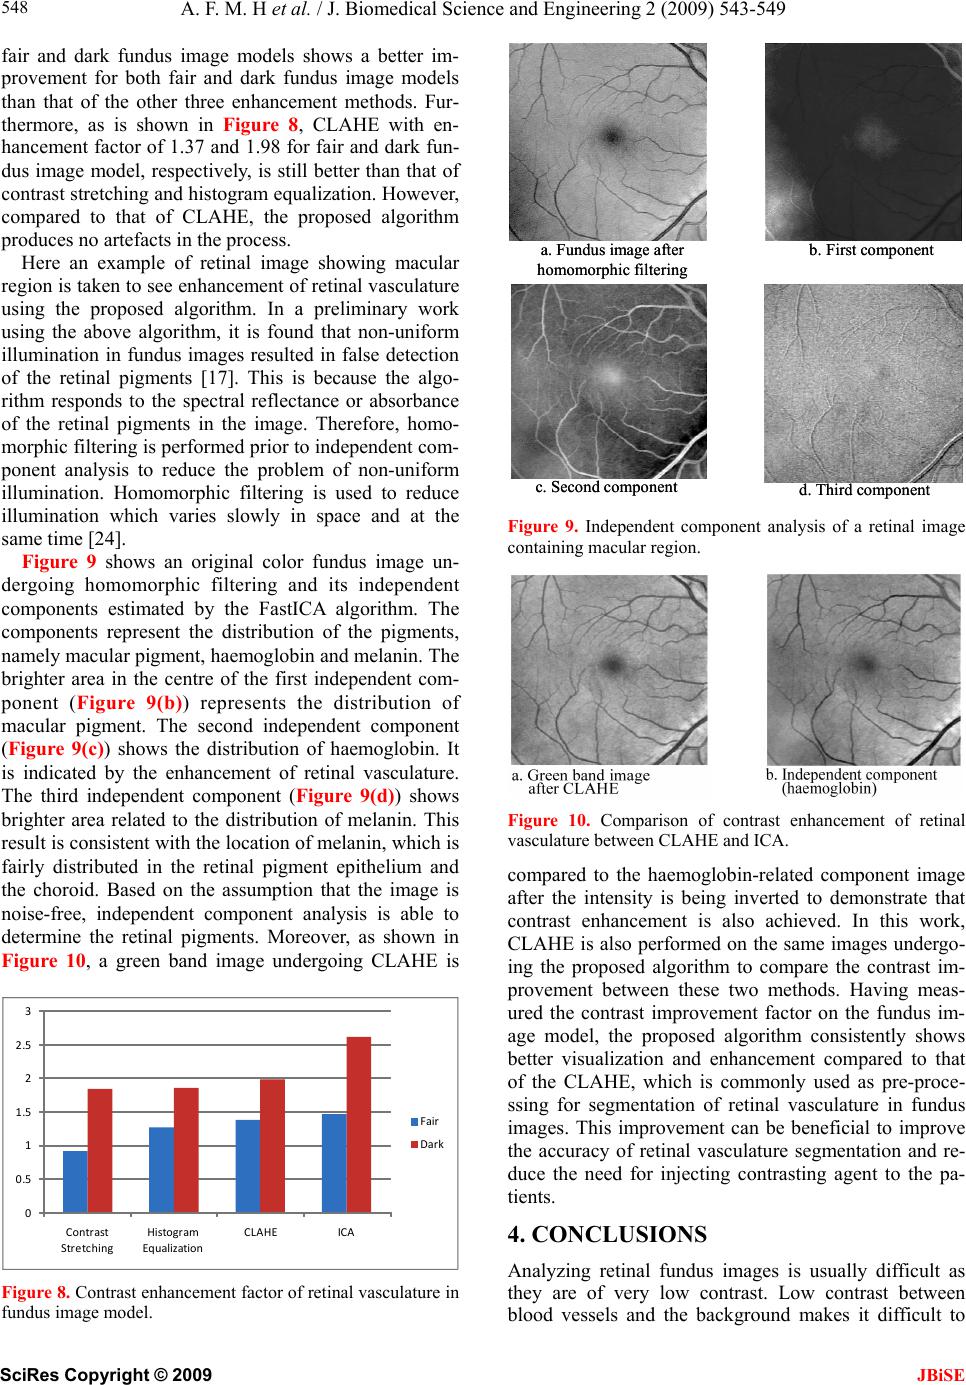 A. F. M. H et al. / J. Biomedical Science and Engineering 2 (2009) 543-549 SciRes Copyright © 2009 JBiSE 548 fair and dark fundus image models shows a better im- provement for both fair and dark fundus image models than that of the other three enhancement methods. Fur- thermore, as is shown in Figure 8, CLAHE with en- hancement factor of 1.37 and 1.98 for fair and dark fun- dus image model, respectively, is still better than that of contrast stretching and histogram equalization. However, compared to that of CLAHE, the proposed algorithm produces no artefacts in the process. Here an example of retinal image showing macular region is taken to see enhancement of retinal vasculature using the proposed algorithm. In a preliminary work using the above algorithm, it is found that non-uniform illumination in fundus images resulted in false detection of the retinal pigments [17]. This is because the algo- rithm responds to the spectral reflectance or absorbance of the retinal pigments in the image. Therefore, homo- morphic filtering is performed prior to independent com- ponent analysis to reduce the problem of non-uniform illumination. Homomorphic filtering is used to reduce illumination which varies slowly in space and at the same time [24]. Figure 9 shows an original color fundus image un- dergoing homomorphic filtering and its independent components estimated by the FastICA algorithm. The components represent the distribution of the pigments, namely macular pigment, haemoglobin and melanin. The brighter area in the centre of the first independent com- ponent (Figure 9(b)) represents the distribution of macular pigment. The second independent component (Figure 9(c)) shows the distribution of haemoglobin. It is indicated by the enhancement of retinal vasculature. The third independent component (Figure 9(d)) shows brighter area related to the distribution of melanin. This result is consistent with the location of melanin, which is fairly distributed in the retinal pigment epithelium and the choroid. Based on the assumption that the image is noise-free, independent component analysis is able to determine the retinal pigments. Moreover, as shown in Figure 10, a green band image undergoing CLAHE is 0 0.5 1 1.5 2 2.5 3 Contrast Stretching Histogr am Equalization CLAHE ICA Fair Dark Figure 8. Contrast enhancement factor of retinal vasculature in fundus image model. a. Fundus image after homomorphic filtering b. First component c. Second componentd. Third component a. Fundus image after homomorphic filtering b. First component c. Second componentd. Third component Figure 9. Independent component analysis of a retinal image containing macular region. Figure 10. Comparison of contrast enhancement of retinal vasculature between CLAHE and ICA. compared to the haemoglobin-related component image after the intensity is being inverted to demonstrate that contrast enhancement is also achieved. In this work, CLAHE is also performed on the same images undergo- ing the proposed algorithm to compare the contrast im- provement between these two methods. Having meas- ured the contrast improvement factor on the fundus im- age model, the proposed algorithm consistently shows better visualization and enhancement compared to that of the CLAHE, which is commonly used as pre-proce- ssing for segmentation of retinal vasculature in fundus images. This improvement can be beneficial to improve the accuracy of retinal vasculature segmentation and re- duce the need for injecting contrasting agent to the pa- tients. 4. CONCLUSIONS Analyzing retinal fundus images is usually difficult as they are of very low contrast. Low contrast between blood vessels and the background makes it difficult to 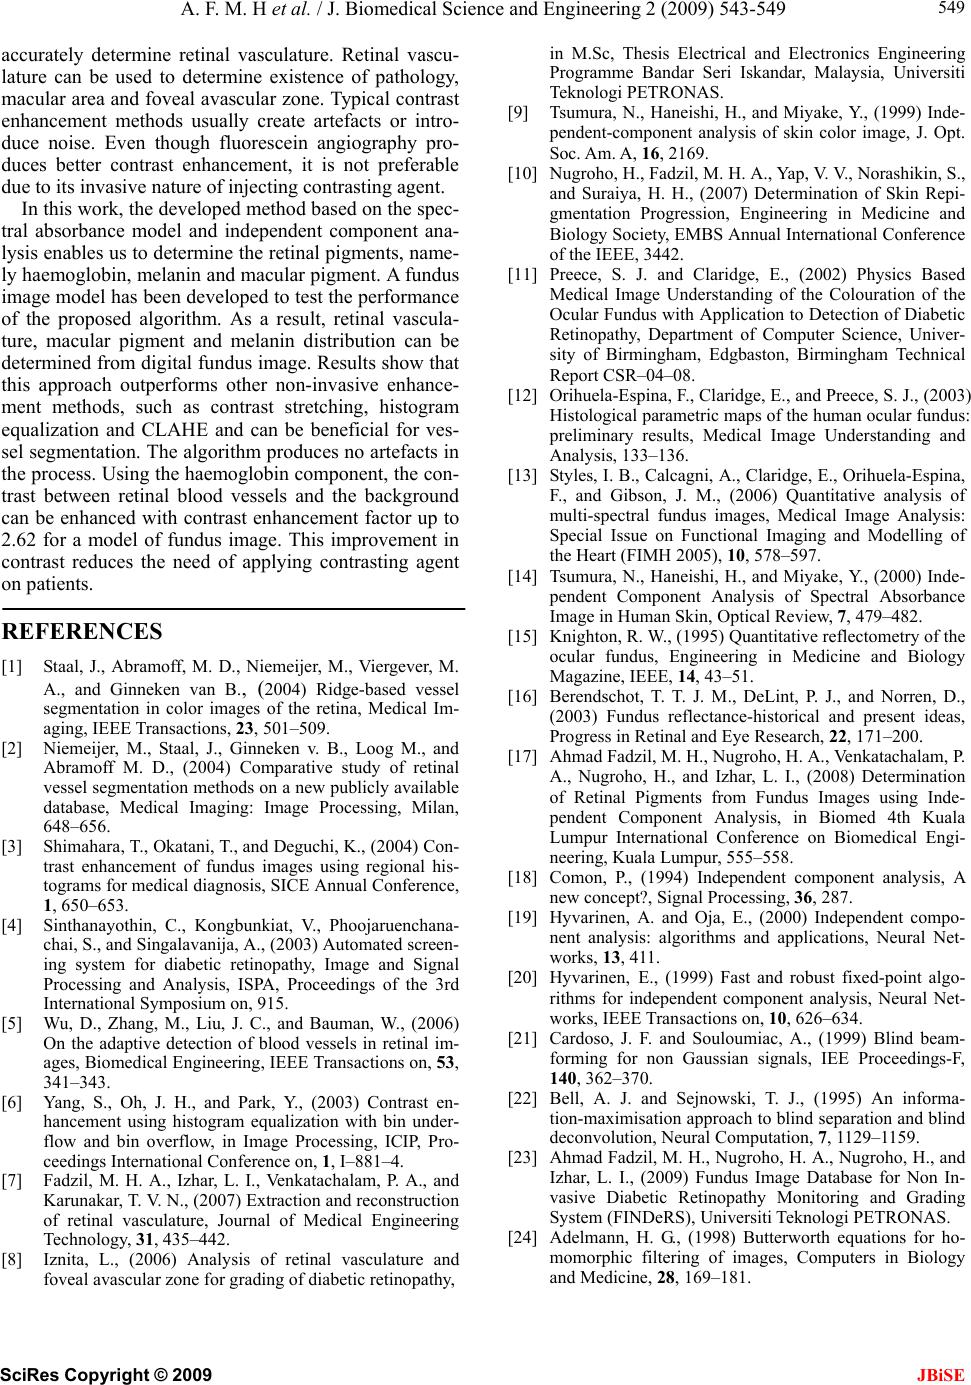 A. F. M. H et al. / J. Biomedical Science and Engineering 2 (2009) 543-549 SciRes Copyright © 2009 549 accurately determine retinal vasculature. Retinal vascu- lature can be used to determine existence of pathology, macular area and foveal avascular zone. Typical contrast enhancement methods usually create artefacts or intro- duce noise. Even though fluorescein angiography pro- duces better contrast enhancement, it is not preferable due to its invasive nature of injecting contrasting agent. JBiSE In this work, the developed method based on the spec- tral absorbance model and independent component ana- lysis enables us to determine the retinal pigments, name- ly haemoglobin, melanin and macular pigment. A fundus image model has been developed to test the performance of the proposed algorithm. As a result, retinal vascula- ture, macular pigment and melanin distribution can be determined from digital fundus image. Results show that this approach outperforms other non-invasive enhance- ment methods, such as contrast stretching, histogram equalization and CLAHE and can be beneficial for ves- sel segmentation. The algorithm produces no artefacts in the process. Using the haemoglobin component, the con- trast between retinal blood vessels and the background can be enhanced with contrast enhancement factor up to 2.62 for a model of fundus image. This improvement in contrast reduces the need of applying contrasting agent on patients. REFERENCES [1] Staal, J., Abramoff, M. D., Niemeijer, M., Viergever, M. A., and Ginneken van B., (2004) Ridge-based vessel segmentation in color images of the retina, Medical Im- aging, IEEE Transactions, 23, 501–509. [2] Niemeijer, M., Staal, J., Ginneken v. B., Loog M., and Abramoff M. D., (2004) Comparative study of retinal vessel segmentation methods on a new publicly available database, Medical Imaging: Image Processing, Milan, 648–656. [3] Shimahara, T., Okatani, T., and Deguchi, K., (2004) Con- trast enhancement of fundus images using regional his- tograms for medical diagnosis, SICE Annual Conference, 1, 650–653. [4] Sinthanayothin, C., Kongbunkiat, V., Phoojaruenchana- chai, S., and Singalavanija, A., (2003) Automated screen- ing system for diabetic retinopathy, Image and Signal Processing and Analysis, ISPA, Proceedings of the 3rd International Symposium on, 915. [5] Wu, D., Zhang, M., Liu, J. C., and Bauman, W., (2006) On the adaptive detection of blood vessels in retinal im- ages, Biomedical Engineering, IEEE Transactions on, 53, 341–343. [6] Yang, S., Oh, J. H., and Park, Y., (2003) Contrast en- hancement using histogram equalization with bin under- flow and bin overflow, in Image Processing, ICIP, Pro- ceedings International Conference on, 1, I–881–4. [7] Fadzil, M. H. A., Izhar, L. I., Venkatachalam, P. A., and Karunakar, T. V. N., (2007) Extraction and reconstruction of retinal vasculature, Journal of Medical Engineering Technology, 31, 435–442. [8] Iznita, L., (2006) Analysis of retinal vasculature and foveal avascular zone for grading of diabetic retinopathy, in M.Sc, Thesis Electrical and Electronics Engineering Programme Bandar Seri Iskandar, Malaysia, Universiti Teknologi PETRONAS. [9] Tsumura, N., Haneishi, H., and Miyake, Y., (1999) Inde- pendent-component analysis of skin color image, J. Opt. Soc. Am. A, 16, 2169. [10] Nugroho, H., Fadzil, M. H. A., Yap, V. V., Norashikin, S., and Suraiya, H. H., (2007) Determination of Skin Repi- gmentation Progression, Engineering in Medicine and Biology Society, EMBS Annual International Conference of the IEEE, 3442. [11] Preece, S. J. and Claridge, E., (2002) Physics Based Medical Image Understanding of the Colouration of the Ocular Fundus with Application to Detection of Diabetic Retinopathy, Department of Computer Science, Univer- sity of Birmingham, Edgbaston, Birmingham Technical Report CSR–04–08. [12] Orihuela-Espina, F., Claridge, E., and Preece, S. J., (2003) Histological parametric maps of the human ocular fundus: preliminary results, Medical Image Understanding and Analysis, 133–136. [13] Styles, I. B., Calcagni, A., Claridge, E., Orihuela-Espina, F., and Gibson, J. M., (2006) Quantitative analysis of multi-spectral fundus images, Medical Image Analysis: Special Issue on Functional Imaging and Modelling of the Heart (FIMH 2005), 10, 578–597. [14] Tsumura, N., Haneishi, H., and Miyake, Y., (2000) Inde- pendent Component Analysis of Spectral Absorbance Image in Human Skin, Optical Review, 7, 479–482. [15] Knighton, R. W., (1995) Quantitative reflectometry of the ocular fundus, Engineering in Medicine and Biology Magazine, IEEE, 14, 43–51. [16] Berendschot, T. T. J. M., DeLint, P. J., and Norren, D., (2003) Fundus reflectance-historical and present ideas, Progress in Retinal and Eye Research, 22, 171–200. [17] Ahmad Fadzil, M. H., Nugroho, H. A., Venkatachalam, P. A., Nugroho, H., and Izhar, L. I., (2008) Determination of Retinal Pigments from Fundus Images using Inde- pendent Component Analysis, in Biomed 4th Kuala Lumpur International Conference on Biomedical Engi- neering, Kuala Lumpur, 555–558. [18] Comon, P., (1994) Independent component analysis, A new concept?, Signal Processing, 36, 287. [19] Hyvarinen, A. and Oja, E., (2000) Independent compo- nent analysis: algorithms and applications, Neural Net- works, 13, 411. [20] Hyvarinen, E., (1999) Fast and robust fixed-point algo- rithms for independent component analysis, Neural Net- works, IEEE Transactions on, 10, 626–634. [21] Cardoso, J. F. and Souloumiac, A., (1999) Blind beam- forming for non Gaussian signals, IEE Proceedings-F, 140, 362–370. [22] Bell, A. J. and Sejnowski, T. J., (1995) An informa- tion-maximisation approach to blind separation and blind deconvolution, Neural Computation, 7, 1129–1159. [23] Ahmad Fadzil, M. H., Nugroho, H. A., Nugroho, H., and Izhar, L. I., (2009) Fundus Image Database for Non In- vasive Diabetic Retinopathy Monitoring and Grading System (FINDeRS), Universiti Teknologi PETRONAS. [24] Adelmann, H. G., (1998) Butterworth equations for ho- momorphic filtering of images, Computers in Biology and Medicine, 28, 169–181. |