

Paper Menu >>
Journal Menu >>
 J. Biomedical Science and Engineering, 2009, 2, 491-498 doi: 10.4236/jbise.2009.27071 Published Online November 2009 (http://www.SciRP.org/journal/jbise/ JBiSE ). Published Online November 2009 in SciRes. http://www.scirp.org/journal/jbise Electrocardiographic interference and conductance volume measurements Simon P. McGuirk1,2, Dan Ewert3, David J. Barron1, John H. Coote2 1Department of Cardiac Surgery, Birmingham Children’s Hospital, Birmingham, UK; 2School of Clinical and Experimental Medicine, University of Birmingham, Birmingham, UK; 3Department of Electrical and Computer Engineering, North Dakota State University, Fargo, USA. Email: [email protected] Received 1 February 2009; revised 1 July 2009; accepted 16 July 2009. ABSTRACT The conductance catheter technique enables con- tinuous ventricular volume measurements based on the electrical conductance of blood within the ven- tricular cavity. However, ventricular excitation also produces a measurable electrical signal within the ventricular cavity. This study was undertaken to in- vestigate the relationship between the ventricular electrogram and conductance volume measurements in a physical model of the left ventricle without par- allel conductance. The ventricular electrogram was simulated with an ECG signal, ECGinput connected to two ring electrodes within the model ventricle. Con- ductance volume measurements were made with and without ECGinput. The difference between these mea- surements, GECG(t), represented the conductance volume due to ECGinput. GECG(t) varied as a function of the first-derivative of ECGinput with respect to time (r2=0.92, P<0.001). GECG(t), This primarily affected volume measurements during ventricular depolarisa- tion; during this phase the volume measurement er- ror varied widely between –12% and +9%. As a re- sult, end-diastole could not be reliably identified on the pressure-volume loop. The accuracy of conduc- tance volume measurements during late diastole and early isovolumic contraction are substantially af- fected by the ventricular electrogram. This may re- sult in a significant error in end-diastolic volume es- timates, which has important implications for the quantitative assessment of ventricular function in- cluding, in particular, the assessment of chamber compliance. Keywords: Volume Measurement; Conductance Catheter; Electrocardiogram; Ventricular Electrogram 1. INTRODUCTION The assessment of ventricular function is fundamentally important for the evaluation of patients with known or suspected heart disease. Analysis of left ventricular (LV) volume in the time and pressure domains allows systolic and diastolic function to be separately quantified. The conductance catheter technique was developed to con- tinuously measure ventricular volume in real-time [1,2]. These measurements are recorded simultaneously with intraventricular pressure measurements to provide in- stantaneous pressure-volume data [3]. The conductance catheter technique is associated with two, well known sources of error. Firstly, the current density generated by the conductance catheter is not uniformly distributed throughout the ventricular cavity [4,5,6]. This results in a non-linear conductance-absolute volume relationship [2,4,7]. Conductance volume meas- urements must be corrected with a calibration coefficient, α [8]. Secondly, the tissues and fluid surrounding the ventricular cavity also contribute to the conductance signal [2,8]. This results in an offset in the conductance- absolute volume relationship, called parallel conduc- tance. In practice, conductance volume measurements are usually calibrated for parallel conductance using the hypertonic saline method in order to derive accurate ventricular volume measurements [8]. In our paediatric clinical experience, we have ob- served that the pattern of LV volume measurements is frequently abnormal. The conductance volume meas- urements are characterised by a narrow upward spike followed by a narrow downward spike during late dias- tole without any commensurate change in LV pressure (Figures 1A and 1B). This alters the shape of the pres- sure-volume loop, with the loss of the normal lower right-hand corner (Figure 1D). To our knowledge, this abnormal conductance volume pattern has not previously been described. However, we understand that similar 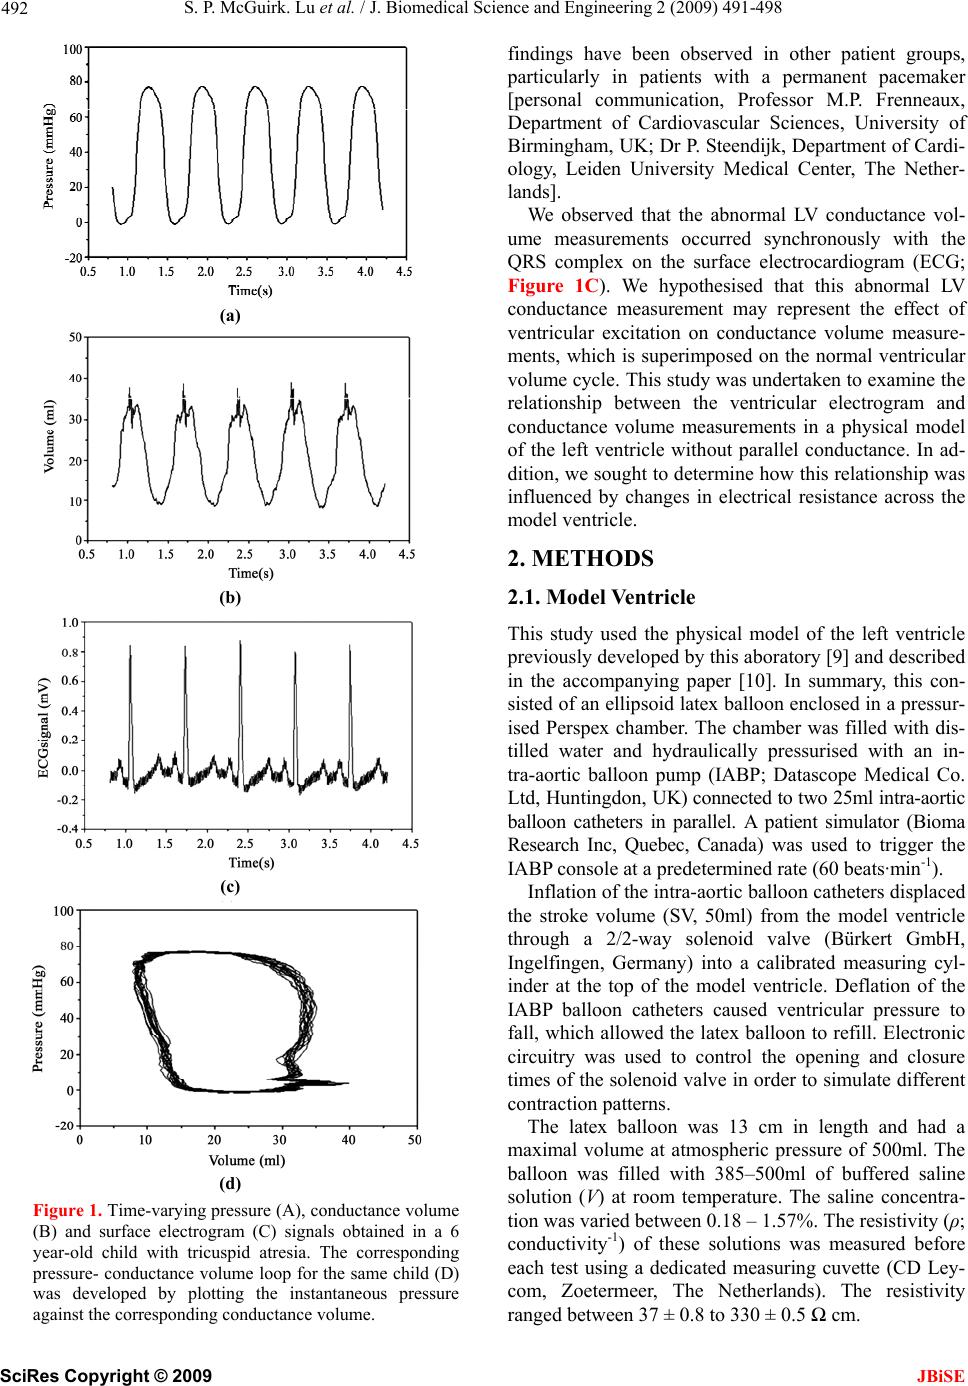 S. P. McGuirk. Lu et al. / J. Biomedical Science and Engineering 2 (2009) 491-498 492 (a) (b) (c) (d) Figure 1. Time-varying pressure (A), conductance volume (B) and surface electrogram (C) signals obtained in a 6 year-old child with tricuspid atresia. The corresponding pressure- conductance volume loop for the same child (D) was developed by plotting the instantaneous pressure against the corresponding conductance volume. findings have been observed in other patient groups, particularly in patients with a permanent pacemaker [personal communication, Professor M.P. Frenneaux, Department of Cardiovascular Sciences, University of Birmingham, UK; Dr P. Steendijk, Department of Cardi- ology, Leiden University Medical Center, The Nether- lands]. We observed that the abnormal LV conductance vol- ume measurements occurred synchronously with the QRS complex on the surface electrocardiogram (ECG; Figure 1C). We hypothesised that this abnormal LV conductance measurement may represent the effect of ventricular excitation on conductance volume measure- ments, which is superimposed on the normal ventricular volume cycle. This study was undertaken to examine the relationship between the ventricular electrogram and conductance volume measurements in a physical model of the left ventricle without parallel conductance. In ad- dition, we sought to determine how this relationship was influenced by changes in electrical resistance across the model ventricle. 2. METHODS 2.1. Model Ventricle This study used the physical model of the left ventricle previously developed by this aboratory [9] and described in the accompanying paper [10]. In summary, this con- sisted of an ellipsoid latex balloon enclosed in a pressur- ised Perspex chamber. The chamber was filled with dis- tilled water and hydraulically pressurised with an in- tra-aortic balloon pump (IABP; Datascope Medical Co. Ltd, Huntingdon, UK) connected to two 25ml intra-aortic balloon catheters in parallel. A patient simulator (Bioma Research Inc, Quebec, Canada) was used to trigger the IABP console at a predetermined rate (60 beats·min-1). Inflation of the intra-aortic balloon catheters displaced the stroke volume (SV, 50ml) from the model ventricle through a 2/2-way solenoid valve (Bürkert GmbH, Ingelfingen, Germany) into a calibrated measuring cyl- inder at the top of the model ventricle. Deflation of the IABP balloon catheters caused ventricular pressure to fall, which allowed the latex balloon to refill. Electronic circuitry was used to control the opening and closure times of the solenoid valve in order to simulate different contraction patterns. The latex balloon was 13 cm in length and had a maximal volume at atmospheric pressure of 500ml. The balloon was filled with 385–500ml of buffered saline solution (V) at room temperature. The saline concentra- tion was varied between 0.18 – 1.57%. The resistivity (ρ; conductivity-1) of these solutions was measured before each test using a dedicated measuring cuvette (CD Ley- com, Zoetermeer, The Netherlands). The resistivity ranged between 37 ± 0.8 to 330 ± 0.5 Ω cm. SciRes Copyright © 2009 JBiSE  S. P. McGuirk et al. / J. Biomedical Science and Engineering 2 (2009) 491-498 493 Ventricular depolarisation was simulated using a fixed output ECG signal, ECGinput, from the patient simulator (maximum 150.4 ± 0.1 mV, minimum –35.8 ± 0.2 mV). This was connected, via a resistor (200 Ω), to a dipole within the latex balloon. This dipole consisted of two copper ring electrodes (diameter 30mm, depth 5mm and thickness 1mm) that were positioned perpendicular to the long-axis of the balloon. The in-series resistor was adjusted so that the signal range of the intracavitary electrogram (ECGc) in the model ventricle was equiva- lent to that observed in vivo (~1mV). In vivo, the intracavitary electrogram primarily re- flects the pattern of ventricular depolarisation and repo- larisation in the endocardium of the ventricle [11]. The position of the endocardium relative to the long-axis of the ventricle will vary as the ventricular volume changes during the cardiac cycle. This effect was simulated by altering the distance between the two electrodes of the dipole. The distance between the two electrodes (D) was varied between 3 cm and 11.5 cm such that both elec- trodes remained equidistant from the centre of the bal- loon. 3. CONDUCTANCE CATHE TER The principle of the conductance catheter technique for measuring LV volume has been described elsewhere [8]. The details of the conductance catheter used in this study are described in the accompanying paper [10]. The catheter measured seven time-varying segmental con- ductance signals, Gi(t). As parallel conductance is negli- gible in our model, the total conductance volume, Q(t), was determined using the following formula: 2 7 1 ()[ ()] i i QtLG t (1) where ρ is the blood resistivity and L is the in- ter-electrode distance. The dimensionless calibration coefficient, αV(t) was calculated from conductance vol- ume measurements without the ECG signal by dividing the conductance-derived volume measurement by the absolute volume at either end-diastole or end-systole: () or E S ED Vt E DE Q Q VV S (2) We have previously demonstrated that the calibration coefficient, αV(t) varies as a non-linear function of the absolute ventricular volume [10]. We used this non-linear αV(t)-volume relation to calibrate conductance volume measurements: 1 () () g VV Vt Qt (3) where αVV is the αV(t)-volume relation [10]. Instantaneous pressure within the model ventricle was measured using a high-fidelity solid-state micromano- meter laterally positioned between electrodes 5 and 6 within the conductance catheter. This pressure signal was amplified using a combined amplifier-interface unit (PCU-2000; Millar Instruments, Houston, TX, USA) and statically calibrated using a separate fluid-filled cathe- ter-manometer system. The cavitary electrogram, ECGc was measured as part of the conductance catheter technique. The conductance signal between electrodes 5 and 6 was measured, ampli- fied and filtered using a second-order filter with a high cut-off frequency (–3dB; 125 Hz) in order to derive the ECGc [personal communication; CD Leycom, Zoeter- meer, The Netherlands]. 4. ECG INTEREFERENCE The conductance signal was measured either with, , or without the ECG signal, . ECG inter- ference, GECG(t) was calculated as the difference be- tween these two conductance signals: () i Gt () i Gt 77 11 ()() () ECG ii ii GtGt Gt (4) The difference between calibrated volume measure- ments made with, and without the ECG signal, was expressed as a percentage of the signal: () g Vt () g Vt () g Vt [() ()] () gg ECG g Vt Vt VVt (5) 5. EXPERIMENTAL DATA Analogue signals representing 7 segmental conductance sig- nals, the pressure within the model ventricle, and both ECGinput and ECGc were all digitised at 12-bit accuracy and a sample frequency of 250 Hz. End-diastole and end- systole were retrospectively identified. End diastole was de- fined as the R wave on the ECG and end-systole was defined as the point immediately prior to IABP circuit deflation. The effect of intracavitary volume (V), resistivity of the saline solution (ρ) and inter-electrode distance (D) on the intracavitary electrogram and conductance volume measurements were examined in turn. This involved a series of experiments, in which one variable was altered incrementally while the other two variables remained unchanged. This process was repeated until the data from the entire range was obtained (see above). Each experiment was conducted under steady-state con- ditions and data from 5 consecutive cycles were analysed. The average within-experiment standard deviation was 0.71 ml and, at its worst, this represented <0.5% of the total conductance volume. All subsequent analyses were there- fore based on the average data from each experiment. SciRes Copyright © 2009 JBiSE  S. P. McGuirk. Lu et al. / J. Biomedical Science and Engineering 2 (2009) 491-498 494 6. DATA ANALYSIS Data were analysed using SPSS for Windows (v12, SPSS Inc., Chicago, Il, USA). Data are expressed as mean ± SD and comparative analyses have been made using the t-test. The relationship between the ECGinput, ECGc and the ECG interference pattern was evaluated by least squares linear regression based on fractional polynomials of the data. The intracavitary volume, resistivity of the saline solution and the inter-electrode distance were included as covariables in the regres- sion analyses. The coefficients of the linear regression analyses, in both the overall and covariance analyses, are expressed as mean ± standard error and a prob- ability, P<0.05, was taken to represent statistical sig- nificance. The “goodness of fit” of the prediction equation was assessed as the square of the correlation between dependent and significant independent vari- ables. 7. RESULTS 7.1. Comparison between ECG Signal and Cavitary Electrogram The ECG signal, ECGinput, consisted of P, Q, R, S and T deflections that resembled the normal lead II electrocar- diogram (Figure 2A). The P wave was 84 ms in duration with a peak of 6.2 mV (40 ms). The P wave represented approximately half the PR interval (156 ms). The posi- tive QRS complex had an overall duration of 84 ms, with a maximum at 192 ms (150.4 mV) and two minima at 164 ms (–26.4 mV) and 224 ms (–34.1 mV). The ST segment was isoelectric (–8.2 mV) and 36 ms long. The duration of the T wave was 236 ms, with a peak of 41.4 mV (408 ms). Finally, the QT interval and TP segment were both isoelectric and 120 ms and 468 ms long, re- spectively. The ECGc signal resembled the ECGinput signal turned upside down, with an inverted P wave, an rSR′ wave and an inverted T wave (Figure 2B). The overall relationship between the two signals was best approximated by a mathematical model in which the ECGc signal was in- versely proportional to the ECGinput signal (r2=0.74, P<0.001): 01 () () input ECGctECGt (6) Although the ECGinput and ECGc signals were similar, they were not identical There were differences in timing and amplitude of the two signals. The ECGc P and S wave minima and the R wave peak occurred either syn- chronously or within one data point (i.e. 4 ms) of the corresponding points on the ECGinput signal. By contrast, the ECGc R′ wave peak and the T wave misnimum were 12 ms and 32 ms earlier than the corresponding points on the ECGinput signal. The ECGc R′ wave peak was also disproportionately pronounced compared to the cor- responding S wave of the ECGinput signal. The ECGc R′-S wave ratio was –0.51 ± 0.03 whereas the ECGinput S-R wave ratio was –0.17 ± 0.02 (P<0.001). In addi- tion, the ECGc did not accurately reproduce the isoelectric phases of the ECGinput signal. During the PR, R′T and TP segments, the ECGc signal was ini- tially elevated and decreased progressively towards the baseline signal. In the covariance analyses, the intercept value (β0) varied as a linear function of inter- electrode distance (P<0.05), but was not affected by variation in the other two factors. By contrast, the linear regression coefficient (β1) varied as the inverse function of intracavitary vol- ume and as a direct function of inter-electrode distance and resistivity of the solution (all P<0.05). When these effects are combined, the relationship between ECGc and ECGinput was influenced by the in- ter-electrode distance (intercept value) and by the total resistance of the volume conductor (Eq. 7; r2=0.65): 23 4 ()( )() input D ECGctDECGt V (7) where β2 = 3.66 ± 0.01; β3 = 7.29·10-3 ± 1.53·10-3 and β4 = –7.00·10-3 ± 0.06·10-3 (P<0.05 for each coefficient). 7.2. Comparison between ECG Interference and ECG Input Signals The ECG interference signal, GECG(t) was characterised by a low amplitude biphasic P wave; a high amplitude equiphasic qRSr′ complex; and a low-amplitude biphasic T wave (Figure 2C). Each phase of the GECG(t) signal was synchronous with the P wave, QRS complex and T wave of the ECG signal, respectively. The amplitude of the GECG(t) has been described as a percentage of the maximum GECG(t) signal from the isoelectric line. The GECG(t) P wave had a sine wave- like appearance with an initial upward deflection im- mediately followed by a downward deflection of com- parable duration and amplitude. The maximum and minimum GECG(t) P wave signals were 4.0 ± 2.6% (28 ms) above and 4.4 ± 2.6% (64 ms) below the isoelectric line. The spiked wave GECG(t) qRSr′ complex had two maxima at 180 ms (R wave; 100 ± 3%) and 232 ms (r′ wave; 22 ± 3%) and two minima at 160 ms (q wave; –24 ± 3%) and 204 ms (S wave; –107 ± 3%). The GECG(t) q and R waves occurred 32 ms and 12 ms be- fore the ECGinput R wave whereas the GECG(t) S and r′ waves occurred 12 ms and 40 ms after the ECGinput R wave. The GECG(t) T wave had a similar overall appear- ance to the GECG(t) P wave with an initial upward deflec- tion immediately followed by an equivalent downward deflection. The maximum and minimum GECG(t) T wave SciRes Copyright © 2009 JBiSE 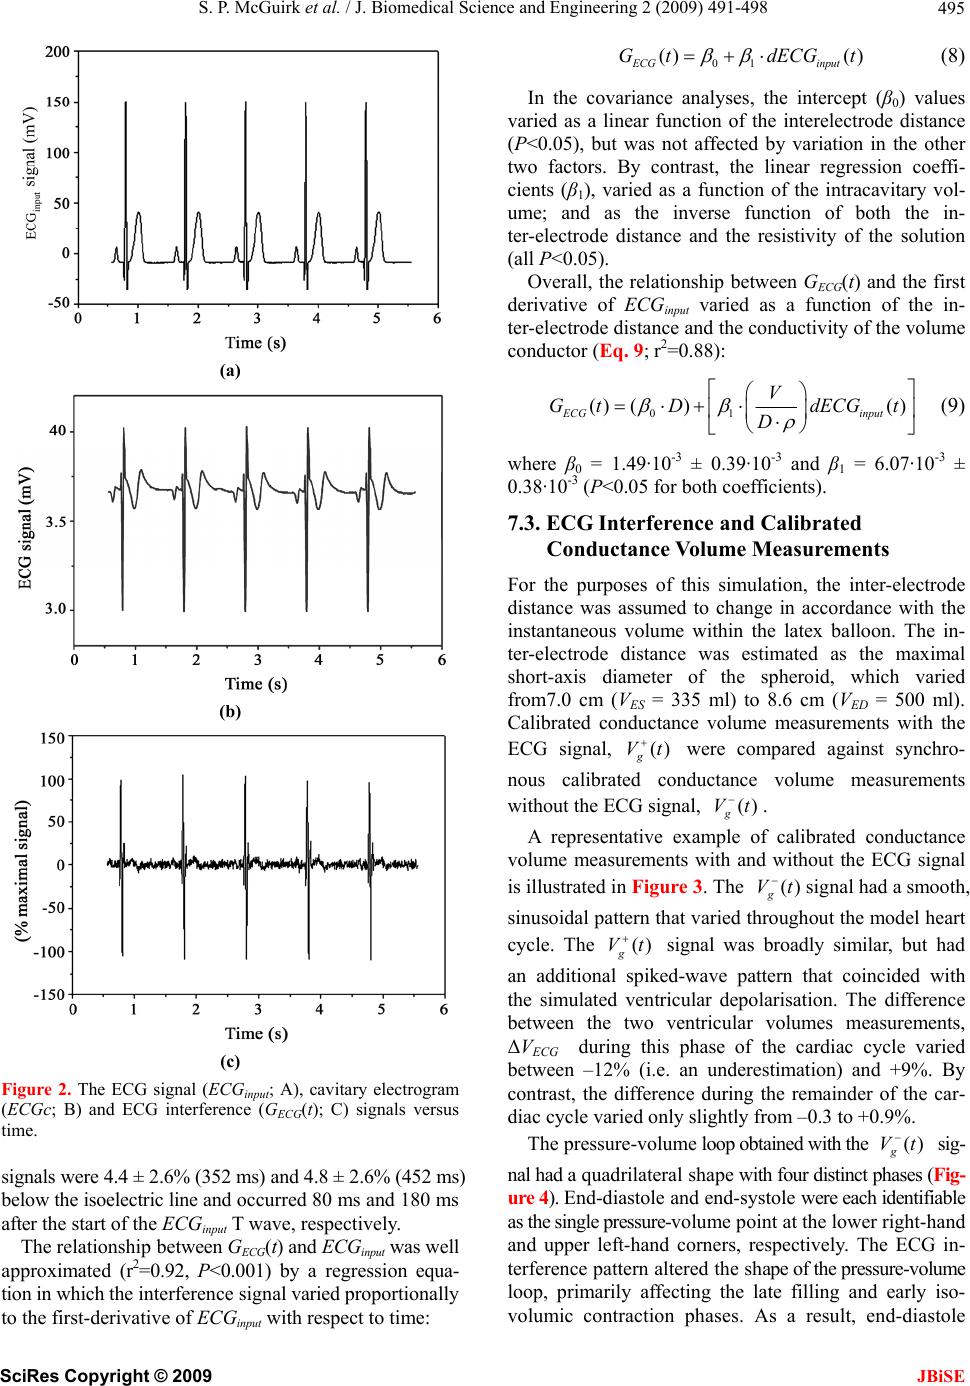 S. P. McGuirk et al. / J. Biomedical Science and Engineering 2 (2009) 491-498 495 (a) (b) (c) Figure 2. The ECG signal (ECGinput; A), cavitary electrogram (ECGc; B) and ECG interference (GECG(t); C) signals versus time. signals were 4.4 ± 2.6% (352 ms) and 4.8 ± 2.6% (452 ms) below the isoelectric line and occurred 80 ms and 180 ms after the start of the ECGinput T wave, respectively. The relationship between GECG(t) and ECGinput was well approximated (r2=0.92, P<0.001) by a regression equa- tion in which the interference signal varied proportionally to the first-derivative of ECGinput with respect to time: 01 () () ECG input Gt dECGt (8) In the covariance analyses, the intercept (β0) values varied as a linear function of the interelectrode distance (P<0.05), but was not affected by variation in the other two factors. By contrast, the linear regression coeffi- cients (β1), varied as a function of the intracavitary vol- ume; and as the inverse function of both the in- ter-electrode distance and the resistivity of the solution (all P<0.05). Overall, the relationship between GECG(t) and the first derivative of ECGinput varied as a function of the in- ter-electrode distance and the conductivity of the volume conductor (Eq. 9; r2=0.88): 01 () ()() ECG input V Gt DdECGt D (9) where β0 = 1.49·10-3 ± 0.39·10-3 and β1 = 6.07·10-3 ± 0.38·10-3 (P<0.05 for both coefficients). 7.3. ECG Interference and Calibrated Conductance Volume Measurements For the purposes of this simulation, the inter-electrode distance was assumed to change in accordance with the instantaneous volume within the latex balloon. The in- ter-electrode distance was estimated as the maximal short-axis diameter of the spheroid, which varied from7.0 cm (VES = 335 ml) to 8.6 cm (VED = 500 ml). Calibrated conductance volume measurements with the ECG signal, were compared against synchro- nous calibrated conductance volume measurements without the ECG signal, . () g Vt () g Vt A representative example of calibrated conductance volume measurements with and without the ECG signal is illustrated in Figure 3. The signal had a smooth, sinusoidal pattern that varied throughout the model heart cycle. The signal was broadly similar, but had an additional spiked-wave pattern that coincided with the simulated ventricular depolarisation. The difference between the two ventricular volumes measurements, ΔVECG during this phase of the cardiac cycle varied between –12% (i.e. an underestimation) and +9%. By contrast, the difference during the remainder of the car- diac cycle varied only slightly from –0.3 to +0.9%. () g Vt () g Vt The pressure-volume loop obtained with the sig- nal had a quadrilateral shape with four distinct phases (Fig- ure 4). End-diastole and end-systole were each identifiable as the single pressure-volume point at the lower right-hand and upper left-hand corners, respectively. The ECG in- terference pattern altered the shape of the pressure-volume loop, primarily affecting the late filling and early iso- volumic contraction phases. As a result, end-diastole () g Vt SciRes Copyright © 2009 JBiSE 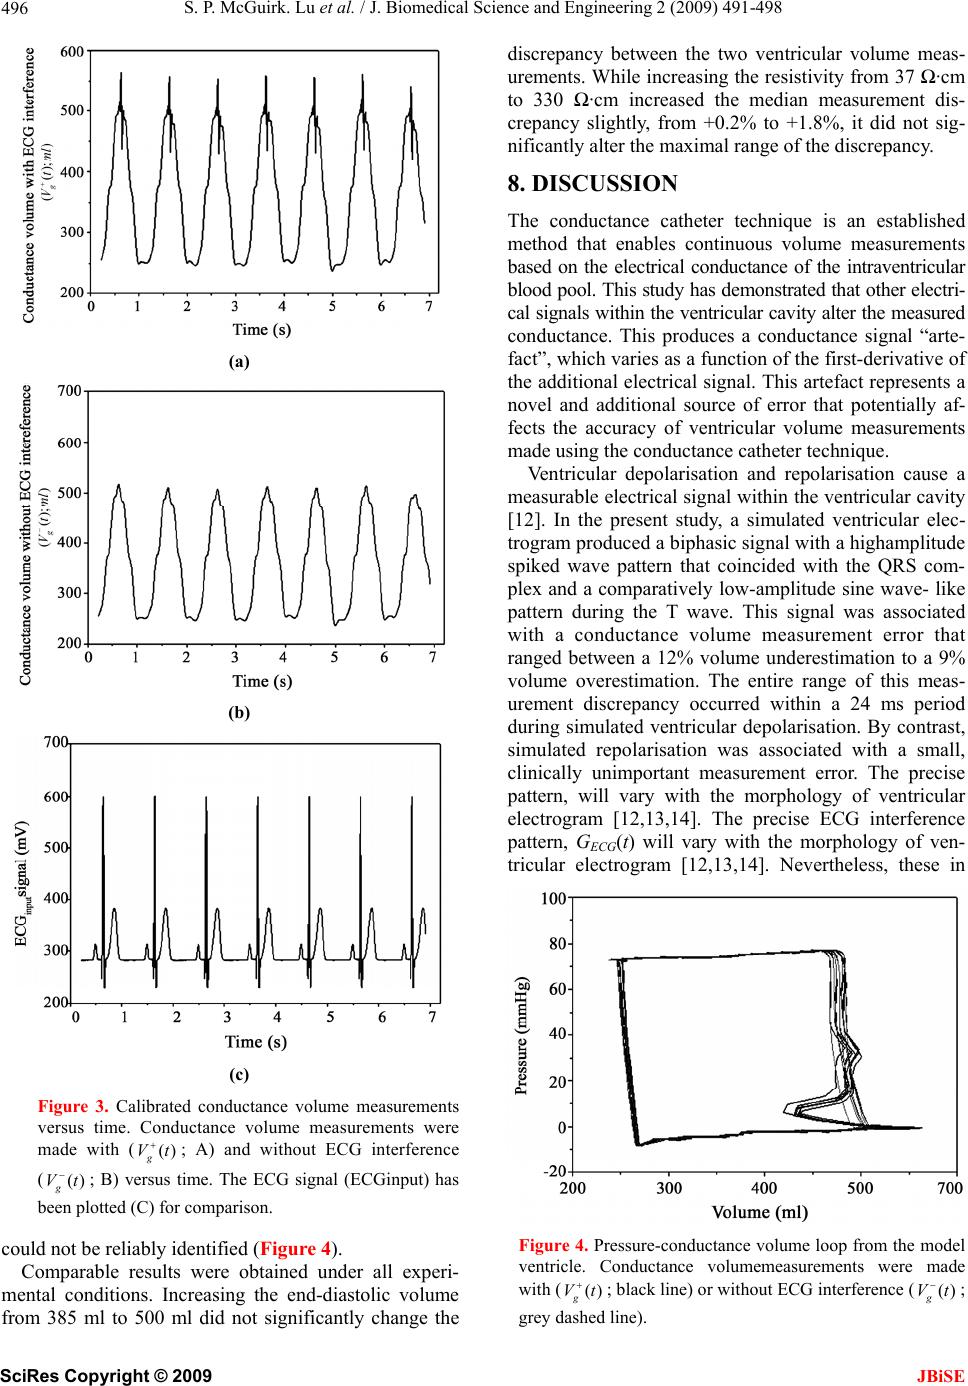 S. P. McGuirk. Lu et al. / J. Biomedical Science and Engineering 2 (2009) 491-498 496 (a) (b) (c) Figure 3. Calibrated conductance volume measurements versus time. Conductance volume measurements were made with (; A) and without ECG interference () g Vt (; B) versus time. The ECG signal (ECGinput) has been plotted (C) for comparison. () g Vt could not be reliably identified (Figure 4). Comparable results were obtained under all experi- mental conditions. Increasing the end-diastolic volume from 385 ml to 500 ml did not significantly change the discrepancy between the two ventricular volume meas- urements. While increasing the resistivity from 37 Ω·cm to 330 Ω·cm increased the median measurement dis- crepancy slightly, from +0.2% to +1.8%, it did not sig- nificantly alter the maximal range of the discrepancy. 8. DISCUSSION The conductance catheter technique is an established method that enables continuous volume measurements based on the electrical conductance of the intraventricular blood pool. This study has demonstrated that other electri- cal signals within the ventricular cavity alter the measured conductance. This produces a conductance signal “arte- fact”, which varies as a function of the first-derivative of the additional electrical signal. This artefact represents a novel and additional source of error that potentially af- fects the accuracy of ventricular volume measurements made using the conductance catheter technique. Ventricular depolarisation and repolarisation cause a measurable electrical signal within the ventricular cavity [12]. In the present study, a simulated ventricular elec- trogram produced a biphasic signal with a highamplitude spiked wave pattern that coincided with the QRS com- plex and a comparatively low-amplitude sine wave- like pattern during the T wave. This signal was associated with a conductance volume measurement error that ranged between a 12% volume underestimation to a 9% volume overestimation. The entire range of this meas- urement discrepancy occurred within a 24 ms period during simulated ventricular depolarisation. By contrast, simulated repolarisation was associated with a small, clinically unimportant measurement error. The precise pattern, will vary with the morphology of ventricular electrogram [12,13,14]. The precise ECG interference pattern, GECG(t) will vary with the morphology of ven- tricular electrogram [12,13,14]. Nevertheless, these in Figure 4. Pressure-conductance volume loop from the model ventricle. Conductance volumemeasurements were made with (; black line) or without ECG interference (; grey dashed line). () g Vt () g Vt SciRes Copyright © 2009 JBiSE 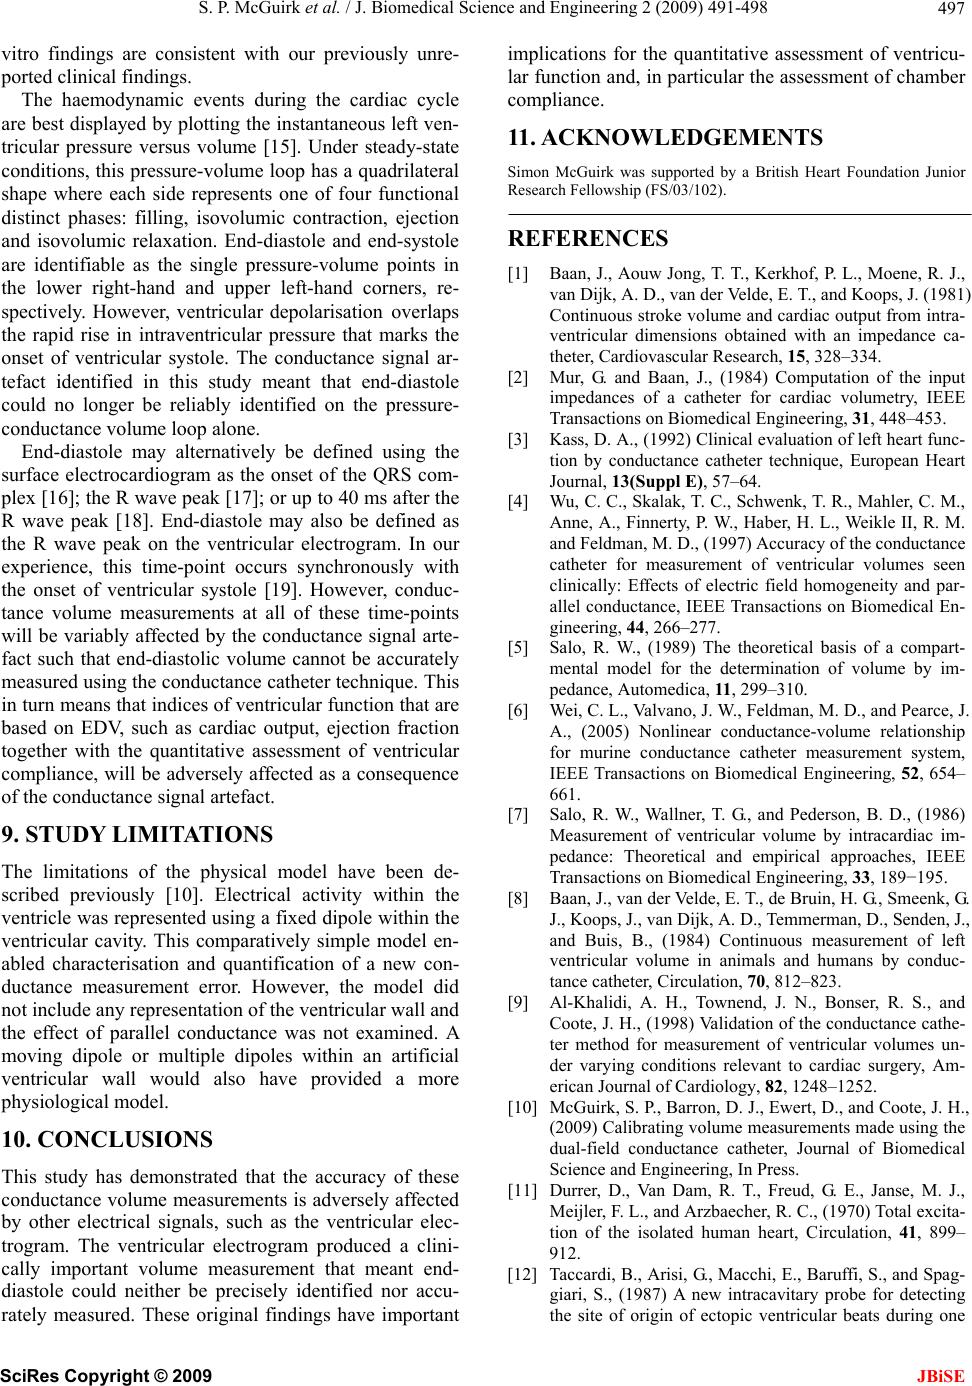 S. P. McGuirk et al. / J. Biomedical Science and Engineering 2 (2009) 491-498 497 vitro findings are consistent with our previously unre- ported clinical findings. The haemodynamic events during the cardiac cycle are best displayed by plotting the instantaneous left ven- tricular pressure versus volume [15]. Under steady-state conditions, this pressure-volume loop has a quadrilateral shape where each side represents one of four functional distinct phases: filling, isovolumic contraction, ejection and isovolumic relaxation. End-diastole and end-systole are identifiable as the single pressure-volume points in the lower right-hand and upper left-hand corners, re- spectively. However, ventricular depolarisation overlaps the rapid rise in intraventricular pressure that marks the onset of ventricular systole. The conductance signal ar- tefact identified in this study meant that end-diastole could no longer be reliably identified on the pressure- conductance volume loop alone. End-diastole may alternatively be defined using the surface electrocardiogram as the onset of the QRS com- plex [16]; the R wave peak [17]; or up to 40 ms after the R wave peak [18]. End-diastole may also be defined as the R wave peak on the ventricular electrogram. In our experience, this time-point occurs synchronously with the onset of ventricular systole [19]. However, conduc- tance volume measurements at all of these time-points will be variably affected by the conductance signal arte- fact such that end-diastolic volume cannot be accurately measured using the conductance catheter technique. This in turn means that indices of ventricular function that are based on EDV, such as cardiac output, ejection fraction together with the quantitative assessment of ventricular compliance, will be adversely affected as a consequence of the conductance signal artefact. 9. STUDY LIMITATIONS The limitations of the physical model have been de- scribed previously [10]. Electrical activity within the ventricle was represented using a fixed dipole within the ventricular cavity. This comparatively simple model en- abled characterisation and quantification of a new con- ductance measurement error. However, the model did not include any representation of the ventricular wall and the effect of parallel conductance was not examined. A moving dipole or multiple dipoles within an artificial ventricular wall would also have provided a more physiological model. 10. CONCLUSIONS This study has demonstrated that the accuracy of these conductance volume measurements is adversely affected by other electrical signals, such as the ventricular elec- trogram. The ventricular electrogram produced a clini- cally important volume measurement that meant end- diastole could neither be precisely identified nor accu- rately measured. These original findings have important implications for the quantitative assessment of ventricu- lar function and, in particular the assessment of chamber compliance. 1 1. ACKNOWLEDGEMENTS Simon McGuirk was supported by a British Heart Foundation Junior Research Fellowship (FS/03/102). REFERENCES [1] Baan, J., Aouw Jong, T. T., Kerkhof, P. L., Moene, R. J., van Dijk, A. D., van der Velde, E. T., and Koops, J. (1981) Continuous stroke volume and cardiac output from intra- ventricular dimensions obtained with an impedance ca- theter, Cardiovascular Research, 15, 328–334. [2] Mur, G. and Baan, J., (1984) Computation of the input impedances of a catheter for cardiac volumetry, IEEE Transactions on Biomedical Engineering, 31, 448–453. [3] Kass, D. A., (1992) Clinical evaluation of left heart func- tion by conductance catheter technique, European Heart Journal, 13(Suppl E), 57–64. [4] Wu, C. C., Skalak, T. C., Schwenk, T. R., Mahler, C. M., Anne, A., Finnerty, P. W., Haber, H. L., Weikle II, R. M. and Feldman, M. D., (1997) Accuracy of the conductance catheter for measurement of ventricular volumes seen clinically: Effects of electric field homogeneity and par- allel conductance, IEEE Transactions on Biomedical En- gineering, 44, 266–277. [5] Salo, R. W., (1989) The theoretical basis of a compart- mental model for the determination of volume by im- pedance, Automedica, 11, 299–310. [6] Wei, C. L., Valvano, J. W., Feldman, M. D., and Pearce, J. A., (2005) Nonlinear conductance-volume relationship for murine conductance catheter measurement system, IEEE Transactions on Biomedical Engineering, 52, 654– 661. [7] Salo, R. W., Wallner, T. G., and Pederson, B. D., (1986) Measurement of ventricular volume by intracardiac im- pedance: Theoretical and empirical approaches, IEEE Transactions on Biomedical Engineering, 33, 189−195. [8] Baan, J., van der Velde, E. T., de Bruin, H. G., Smeenk, G. J., Koops, J., van Dijk, A. D., Temmerman, D., Senden, J., and Buis, B., (1984) Continuous measurement of left ventricular volume in animals and humans by conduc- tance catheter, Circulation, 70, 812–823. [9] Al-Khalidi, A. H., Townend, J. N., Bonser, R. S., and Coote, J. H., (1998) Validation of the conductance cathe- ter method for measurement of ventricular volumes un- der varying conditions relevant to cardiac surgery, Am- erican Journal of Cardiology, 82, 1248–1252. [10] McGuirk, S. P., Barron, D. J., Ewert, D., and Coote, J. H., (2009) Calibrating volume measurements made using the dual-field conductance catheter, Journal of Biomedical Science and Engineering, In Press. [11] Durrer, D., Van Dam, R. T., Freud, G. E., Janse, M. J., Meijler, F. L., and Arzbaecher, R. C., (1970) Total excita- tion of the isolated human heart, Circulation, 41, 899– 912. [12] Taccardi, B., Arisi, G., Macchi, E., Baruffi, S., and Spag- giari, S., (1987) A new intracavitary probe for detecting the site of origin of ectopic ventricular beats during one SciRes Copyright © 2009 JBiSE  S. P. McGuirk. Lu et al. / J. Biomedical Science and Engineering 2 (2009) 491-498 SciRes Copyright © 2009 498 JBiSE cardiac cycle, Circulation, 75, 272–281. [13] Khoury, D. S. and Rudy, Y. (1992) A model study of volume conductor effects on endocardial and intracavi- tary potentials, Circulation Research, 71, 511–525. [14] Derfus, D. L., Pilkington, T. C., Simpson, E. W., and Ideker, R. E., (1992) A comparison of measured and cal- culated intracavitary potentials for electrical stimuli in the exposed dog heart, IEEE Transactions on Biomedical Engineering, 39, 1192–1206. [15] Burkhoff, D., Mirsky, I., and Suga, H., (2005) Assess- ment of systolic and diastolic properties via pres- sure-volume analysis: A guide for clinical, translational, and basic researchers, American Journal of Physiology- Heart and Circulatory Physiology, 289, H501–H512. [16] Roelandt, J. and Gibson, D. G., (1980) Recommendations for standardization of measurements from M-mode echo- cardiograms, European Heart Journal, 1, 375–378. [17] Sugeng, L., Mor-Avi, V., Weinert, L., Niel, J., Ebner, C., Steringer-Mascherbauer, R., Schmidt, F., Galuschky, C., Schummers, G., Lang, R. M., and Nesser, H-J., (2006) Quantitative assessment of left ventricular size and func- tion: Side-by-side comparison of real-time three-dimen- sional echocardiography and computed tomography with magnetic resonance reference, Circulation, 114, 654–661. [18] Møgelvang, J., Thomsen, C., Mehlsen, J. Bräckle, G., Stubgaard, M., and Henriksen, O., (1986) Evaluation of left ventricular volumes measured by magnetic resonance imaging, European Heart Journal, 7, 1016–1021. [19] Al-Khalidi, A. H., Lewis, M. E., Townend, J. N., Bonser, R. S., and Coote, J. H., (2001) A novel and simple tech- nique to allow detection of the position of the R-waves from intraventricular pressure waveforms: application to the conductance catheter method, IEEE Transactions on Biomedical Engineering, 48, 606–610. |