

Paper Menu >>
Journal Menu >>
 J. Biomedical Science and Engineering, 2009, 2, 484-490 doi: 10.4236/jbise.2009.27070 Published Online November 2009 (http://www.SciRP.org/journal/jbise/ JBiSE ). Published Online November 2009 in SciRes. http://www.scirp.org/journal/jbise Calibrating volume measurements made using the dual-field conductance catheter Simon P. McGuirk1,2, David J. Barron1, Dan Ewert3, John H. Coote2 1Department of Cardiac Surgery, Birmingham Children’s Hospital, Birmingham, UK; 2School of Clinical and Experimental Medicine, University of Birmingham, Birmingham, UK; 3Department of Electrical and Computer Engineering, North Dakota State University, Fargo, USA. Email: [email protected] Received 1 February 2009; revised 24 June 2009; accepted 16 July 2009. ABSTRACT The conductance catheter technique allows real- time measurements of ventricular volume based on changes in the electrical conductance of blood within the ventricular cavity. Conductance volume measurements are corrected with a calibration coef- ficient, α, in order to improve accuracy. However, conductance vo lume measurements are also affect ed by parallel conductance, which may confound cali- bration coefficient estimation. This study was un- dertaken to examine the variation in α using a physical model of the left ventricle without parallel con duc tan ce. Calibration coefficients were calculated as the conductance-volume quotient (αV(t)) or the stroke conductance-stroke volume quotient (αSV). Both calibration coefficients varied as a non-linear function of the ventricular volume. Conductance volume measurements calibrated with αV(t) estimated ventricular volume to within 2.0 ± 6.9%. By contrast, calibration with αSV substantially over-estimated the ventricular volume in a volume-dependent manner, increasing from 26 ± 20% at 100ml to 106 ± 36% at 500ml. The accuracy of conductance volume meas- urements is affected by the choice of calibration coef- ficient. Using a fixed or constant calibration coeffi- cient will result in volume measurement errors. The conductance-stroke volume quotient is associated with particularly significant and volume-dependent mea- surement errors. For this reason, conductance volume measurements should ideally be calibrated with an alternative measurement of ventricular vol- ume. Keywords: Conductance Catheter; Calibration; Volume Measurement 1. INTRODUCTION The conductance catheter technique is an established method to measure the ventricular volume in real-time, based on the electrical conductance of blood within the ventricular cavity [1,2,3]. Conductance volume meas- urements are based on the assumption that the electric field produced by the conductance catheter is homoge- neously distributed within the ventricular cavity [1]. However, theoretical and experimental studies have demonstrated that this assumption is not valid [4,5,6]. As a result, the conductance catheter tends to overestimate the volume in small ventricles and underestimate the volume in larger ventricles [2,3]. The dimensionless calibration coefficient, α, was in- troduced by Baan et al. [3] in order to account for the non-uniform conductance-absolute volume relationship [3]. This calibration coefficient represents the slope of the relationship between the conductance-derived vol- ume and the true volume. The calibration coefficient, α may also vary with ventricular volume. It is relatively high in small animals [7], lower in humans [3] and in- termediate values are found in dogs [3,8,9]. Experimen- tal studies demonstrate that α also varies during inferior vena caval occlusion [9] and may even fluctuate during the normal cardiac cycle [10,11]. The tissues and fluid surrounding the ventricular cav- ity also contribute to the measured conductance signal [3]. This creates a volume offset called parallel conduc- tance. Parallel conductance also varies according to the ventricular volume [4,7,8,9,12,13]. This volume- de- pendent parallel conductance may confound the calibra- tion coefficient estimation. This study was undertaken to examine the variation in the calibration coefficient, α, over a range of volumes pertaining to clinical studies, in a physical model of the left ventricle without parallel conductance.  S. P. McGuirk et al. / J. Biomedical Science and Engineering 2 (2009) 484-490 485 2. METHODS 2.1. Model Ventricle This study used a physical model of the left ventricle previously described by this laboratory [14]. This model consisted of an ellipsoid latex balloon enclosed in a pressurised Perspex chamber (Figure 1). The chamber was filled with distilled water and hydraulically pressur- ised with an intra-aortic balloon pump (IABP; Datascope Medical Co. Ltd, Huntingdon, UK) with a paediatric volume-limiting chamber. The IABP console was con- nected to two 25ml intra-aortic balloon catheters in par- allel. The IABP circuit was filled with helium gas to ensure a rapid pneumatic response. The electrocardiogram (ECG) from a patient simulator (Bioma Research Inc, Quebec, Canada) was used to trigger the IABP console at a predetermined rate (60 beats·min-1). Inflation of the IABP balloon catheters caused a rise in the ventricular pressure. This displaced saline from the latex balloon through a 2/2-way solenoid valve (Bürkert GmbH, Ingelfingen, Germany) into a calibrated measuring cylinder at the top of the model ventricle. Deflation of the IABP balloon catheters caused ventricular pressure to fall, which allowed the latex bal- loon to refill. Electronic circuitry was used to control the opening and closure times of the solenoid valve in order to simulate different contraction patterns. For the purposes of this study, the solenoid valve re- mained open throughout the model ventricular cycle to produce isobaric contractions. Each inflation of the IABP balloon catheters displaced a fixed stroke volume (SV) of 50ml. The stroke volume was independently quantified before each experiment. The IABP balloon catheters were manually inflated and the displaced vol- ume was measured in the measuring cylinder. Three separate latex balloons were used to simulate the change in volume that may be observed during infe- rior vena caval occlusion. Each balloon was 13 cm in length and had a maximal volume at atmospheric pres- sure of 125ml, 215ml and 500ml, respectively. The shape of the balloons was ellipsoid at low volumes and became increasingly spheroid as the volume increased. The length-diameter ratio at maximal filling decreased from 3.03 for the smallest balloon to 1.52 for largest balloon. Figure 1. Schematic diagram of the model heart consisting of a model ventricle and outflow tract. The position of the conductance catheter is also illustrated. SciRes Copyright © 2009 JBiSE  S. P. McGuirk et al. / J. Biomedical Science and Engineering 2 (2009) 484-490 486 During each experiment, the model ventricle was filled with a known volume of 0.9% normal saline at room temperature. The end-diastolic volume (VED) was varied between 100–125ml for the 125ml balloon; 160– 215ml for the 215ml balloon; and 410–500ml for the 500ml balloon. The resistivity (conductivity-1) of this solution was measured before each test using a dedicated measuring cuvette (CD Leycom, Zoetermeer, The Neth- erlands). The mean ± SD resistivity was 68.3 ± 0.5 Ω·cm. 2.2. Conductance Catheter The principle of the conductance catheter technique for measuring LV volume has been described elsewhere [3]. In this study, a 7-French 12-electrode high-fidelity dual pressure-volume conductance catheter (Millar Instru- ments, Houston, TX, USA) was used. The electrodes were mounted at 10 mm intervals near the tip of the catheter. One alternating current (20 kHz, 30 µA RMS) was applied between the two outermost electrodes (elec- trodes 1 and 12) and a second alternating current (20 kHz, -10 µA RMS) was applied between the two adja- cent electrodes (electrodes 2 and 11). This dual-field configuration was used in all studies [15]. A signal proc- essor unit (CFL-512; CD Leycom) was used to measure the potential difference between seven consecutive pairs of the remaining eight electrodes (electrodes 3–10). These measured voltages were converted into seven time-varying segmental conductance signals, Gi(t). The conductance volume, Q(t), was measured using the following formula: ))](([)( 7 1 2 P i iGtGLtQ (1) where ρ is the blood resistivity, L is the inter-electrode distance, and GP is parallel conductance. By assuming that parallel conductance is negligible (i.e. GP = 0), this formula can be simplified to: )]([)( 7 1 2tGLtQ i i (2) The volume estimated using the conductance catheter technique was then calculated: )( 1 )( tQtV g (3) where α is the dimensionless calibration coefficient [3]. 2.3. Experimental Data Analogue signals representing 7 segmental conductance volumes within the model ventricle and the ECG were digitised at 12-bit accuracy and a sample frequency of 250 Hz. End-diastole and end-systole were retrospec- tively identified. End-diastole was defined as the R wave on the ECG and end-systole was defined as the point immediately prior to IABP circuit deflation. Each experiment was conducted three times and, in each, data from 10 consecutive cycles were analysed. The estimated within-experiment standard deviation was 0.45 ml. The standard deviation was not significantly correlated with the mean conductance volume (Kendall’s τ coefficient = -0.72), and so subsequent analyses were based on the average data from each experiment [16]. Two separate calibration coefficients were calculated. Firstly, the calibration coefficients, αV(t) was calculated by dividing the conductance-derived volume measure- ment by the absolute ventricular volume at either end-diastole or end-systole: ED ED tV V Q )( or ES ES V Q (4) where SVVV EDES . Including a “phase of measurement” (i.e. ED or ES) in this equation did not improve the goodness of fit of the model. The effect of “phase of measurement” was not significant (P=0.38) and was therefore not included in the model used to predict αV(t). The conductance-stroke volume quotient, αSV, was calculated by dividing the conductance-derived stroke volume by the absolute stroke volume: SV QQESED SV (5) Finally, the measurement error, ζ was calculated as a percentage of the absolute ventricular volume: 100 )( )( tV tVg (6) The terms ζV(t) and ζSV were used to denote the meas- urement error associated with αV(t) and αSV, respectively. 2.4. Data Analysis Data were analysed using SPSS for Windows (v12, SPSS Inc., Chicago, IL, USA). Conductance volumes, calibration coefficients and measurement errors were in turn examined as functions of the known volume of the model ventricle. These relationships were evaluated by least squares linear regression based on fractional poly- nomials of the ventricular volume. The standard error for the regression coefficients and intercept were also calculated. A probability, P<0.05, was taken to represent statistical significance in these analyses. Correlation coefficients between the variables were also calculated. 3. RESULTS 3.1. Relationship between Conductance and Absolute Volume The simultaneous conductance volume, Q(t), and abso- lute volume measurements, V(t) for the three balloons SciRes Copyright © 2009 JBiSE 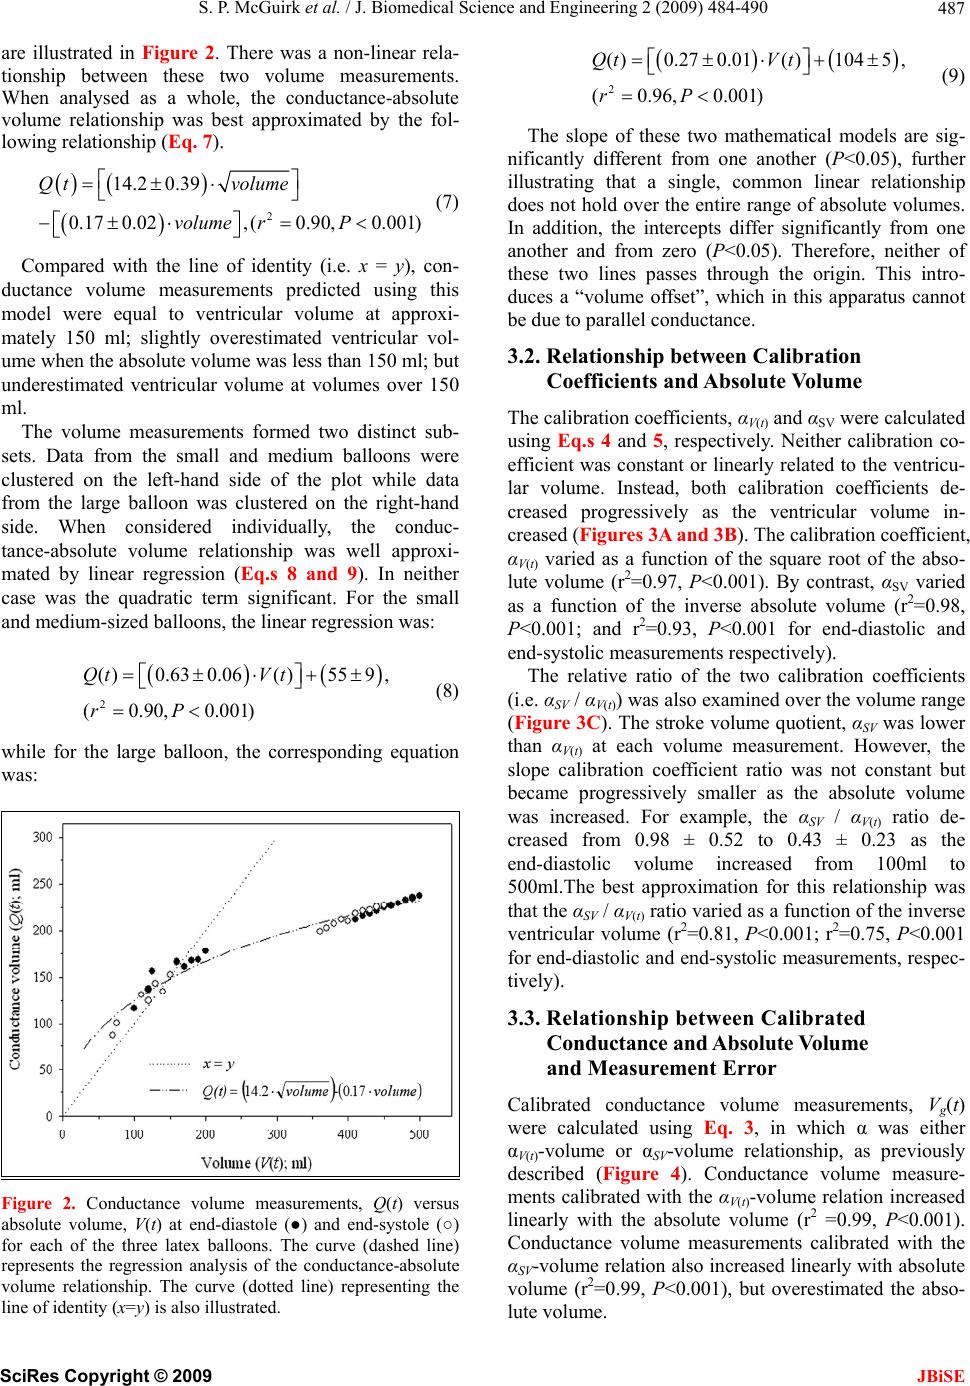 S. P. McGuirk et al. / J. Biomedical Science and Engineering 2 (2009) 484-490 487 are illustrated in Figure 2. There was a non-linear rela- tionship between these two volume measurements. When analysed as a whole, the conductance-absolute volume relationship was best approximated by the fol- lowing relationship (Eq. 7). 2 14.2 0.39 0.17 0.02,(0.90,0.001) Qt volume volume rP (7) Compared with the line of identity (i.e. x = y), con- ductance volume measurements predicted using this model were equal to ventricular volume at approxi- mately 150 ml; slightly overestimated ventricular vol- ume when the absolute volume was less than 150 ml; but underestimated ventricular volume at volumes over 150 ml. The volume measurements formed two distinct sub- sets. Data from the small and medium balloons were clustered on the left-hand side of the plot while data from the large balloon was clustered on the right-hand side. When considered individually, the conduc- tance-absolute volume relationship was well approxi- mated by linear regression (Eq.s 8 and 9). In neither case was the quadratic term significant. For the small and medium-sized balloons, the linear regression was: 2 ( )0.630.06( )559, (0.90, 0.001) QtV t rP (8) while for the large balloon, the corresponding equation was: Figure 2. Conductance volume measurements, Q(t) versus absolute volume, V(t) at end-diastole (●) and end-systole (○) for each of the three latex balloons. The curve (dashed line) represents the regression analysis of the conductance-absolute volume relationship. The curve (dotted line) representing the line of identity (x=y) is also illustrated. 2 ( )0.270.01( )1045, (0.96, 0.001) QtVt rP (9) The slope of these two mathematical models are sig- nificantly different from one another (P<0.05), further illustrating that a single, common linear relationship does not hold over the entire range of absolute volumes. In addition, the intercepts differ significantly from one another and from zero (P<0.05). Therefore, neither of these two lines passes through the origin. This intro- duces a “volume offset”, which in this apparatus cannot be due to parallel conductance. 3.2. Relationship between Calibration Coefficients and Absolute Volume The calibration coefficients, αV(t) and αSV were calculated using Eq.s 4 and 5, respectively. Neither calibration co- efficient was constant or linearly related to the ventricu- lar volume. Instead, both calibration coefficients de- creased progressively as the ventricular volume in- creased (Figures 3A an d 3 B ). The calibration coefficient, αV(t) varied as a function of the square root of the abso- lute volume (r2=0.97, P<0.001). By contrast, αSV varied as a function of the inverse absolute volume (r2=0.98, P<0.001; and r2=0.93, P<0.001 for end-diastolic and end-systolic measurements respectively). The relative ratio of the two calibration coefficients (i.e. αSV / αV(t)) was also examined over the volume range (Figure 3C). The stroke volume quotient, αSV was lower than αV(t) at each volume measurement. However, the slope calibration coefficient ratio was not constant but became progressively smaller as the absolute volume was increased. For example, the αSV / αV(t) ratio de- creased from 0.98 ± 0.52 to 0.43 ± 0.23 as the end-diastolic volume increased from 100ml to 500ml.The best approximation for this relationship was that the αSV / αV(t) ratio varied as a function of the inverse ventricular volume (r2=0.81, P<0.001; r2=0.75, P<0.001 for end-diastolic and end-systolic measurements, respec- tively). 3.3. Relationship between Calibrated Conductance and Absolute Volume and Measurement Error Calibrated conductance volume measurements, Vg(t) were calculated using Eq. 3, in which α was either αV(t)-volume or αSV-volume relationship, as previously described (Figure 4). Conductance volume measure- ments calibrated with the αV(t)-volume relation increased linearly with the absolute volume (r2 =0.99, P<0.001). Conductance volume measurements calibrated with the αSV-volume relation also increased linearly with absolute volume (r2=0.99, P<0.001), but overestimated the abso- lute volume. SciRes Copyright © 2009 JBiSE 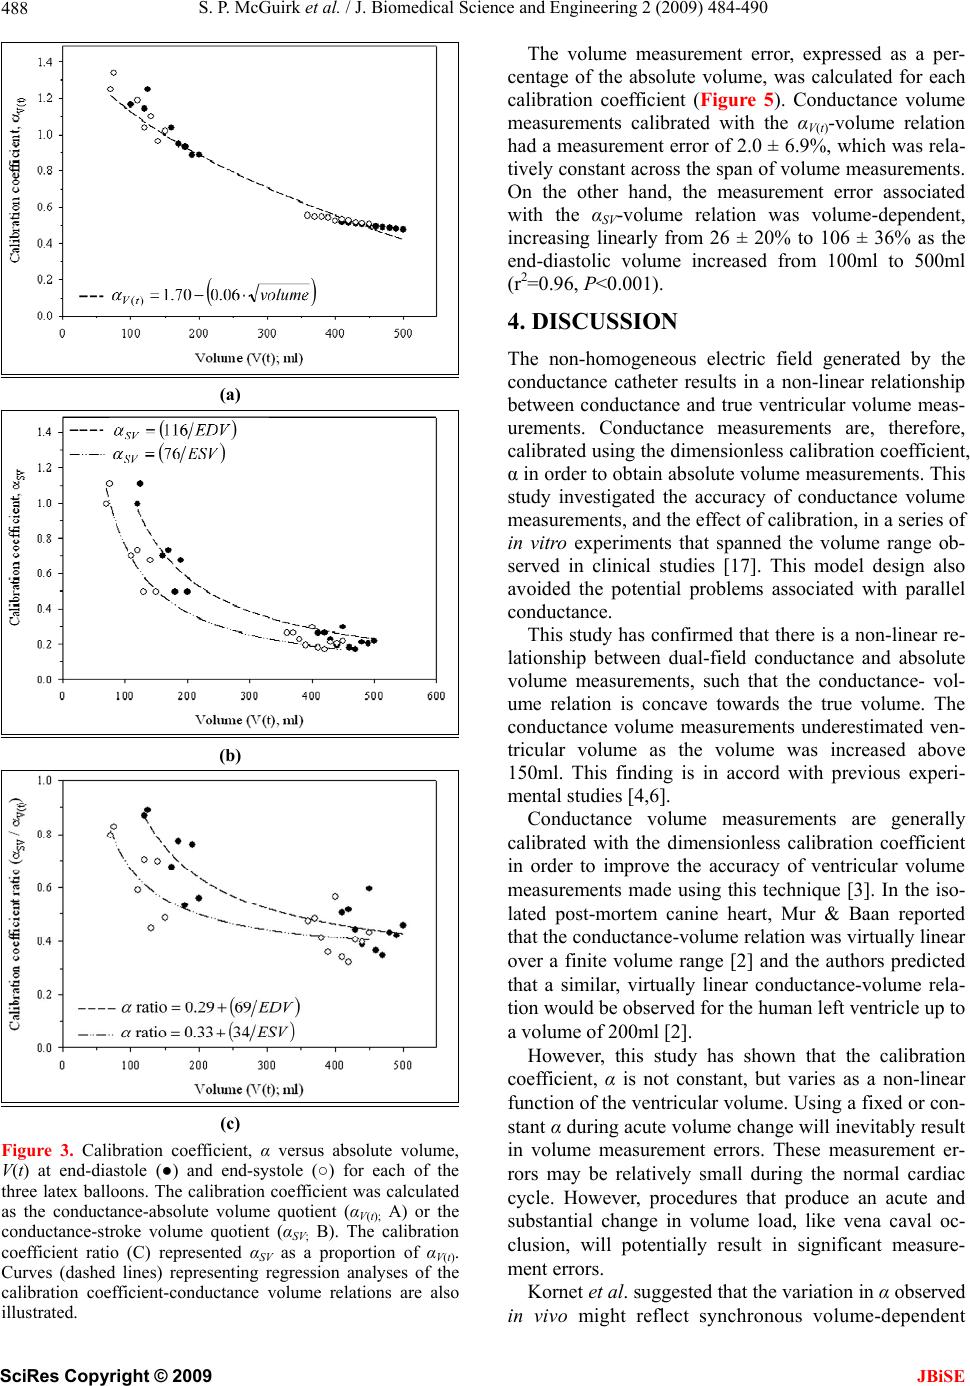 S. P. McGuirk et al. / J. Biomedical Science and Engineering 2 (2009) 484-490 488 (a) (b) (c) Figure 3. Calibration coefficient, α versus absolute volume, V(t) at end-diastole (●) and end-systole (○) for each of the three latex balloons. The calibration coefficient was calculated as the conductance-absolute volume quotient (αV(t); A) or the conductance-stroke volume quotient (αSV; B). The calibration coefficient ratio (C) represented αSV as a proportion of αV(t). Curves (dashed lines) representing regression analyses of the calibration coefficient-conductance volume relations are also illustrated. The volume measurement error, expressed as a per- centage of the absolute volume, was calculated for each calibration coefficient (Figure 5). Conductance volume measurements calibrated with the αV(t)-volume relation had a measurement error of 2.0 ± 6.9%, which was rela- tively constant across the span of volume measurements. On the other hand, the measurement error associated with the αSV-volume relation was volume-dependent, increasing linearly from 26 ± 20% to 106 ± 36% as the end-diastolic volume increased from 100ml to 500ml (r2=0.96, P<0.001). 4. DISCUSSION The non-homogeneous electric field generated by the conductance catheter results in a non-linear relationship between conductance and true ventricular volume meas- urements. Conductance measurements are, therefore, calibrated using the dimensionless calibration coefficient, α in order to obtain absolute volume measurements. This study investigated the accuracy of conductance volume measurements, and the effect of calibration, in a series of in vitro experiments that spanned the volume range ob- served in clinical studies [17]. This model design also avoided the potential problems associated with parallel conductance. This study has confirmed that there is a non-linear re- lationship between dual-field conductance and absolute volume measurements, such that the conductance- vol- ume relation is concave towards the true volume. The conductance volume measurements underestimated ven- tricular volume as the volume was increased above 150ml. This finding is in accord with previous experi- mental studies [4,6]. Conductance volume measurements are generally calibrated with the dimensionless calibration coefficient in order to improve the accuracy of ventricular volume measurements made using this technique [3]. In the iso- lated post-mortem canine heart, Mur & Baan reported that the conductance-volume relation was virtually linear over a finite volume range [2] and the authors predicted that a similar, virtually linear conductance-volume rela- tion would be observed for the human left ventricle up to a volume of 200ml [2]. However, this study has shown that the calibration coefficient, α is not constant, but varies as a non-linear function of the ventricular volume. Using a fixed or con- stant α during acute volume change will inevitably result in volume measurement errors. These measurement er- rors may be relatively small during the normal cardiac cycle. However, procedures that produce an acute and substantial change in volume load, like vena caval oc- clusion, will potentially result in significant measure- ment errors. Kornet et al. suggested that the variation in α observed in vivo might reflect synchronous volume-dependent SciRes Copyright © 2009 JBiSE 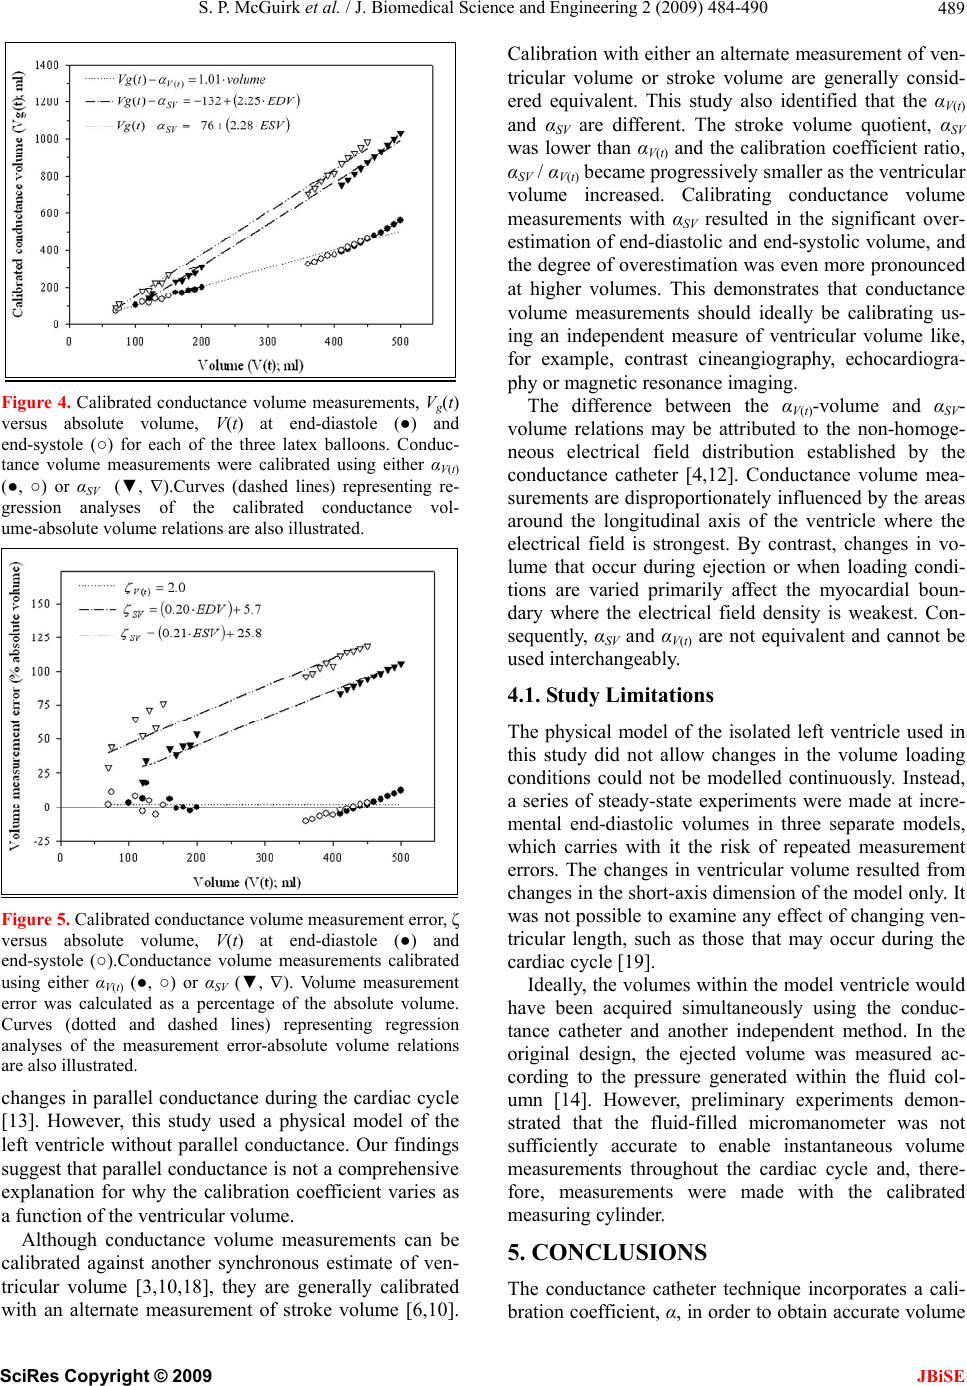 S. P. McGuirk et al. / J. Biomedical Science and Engineering 2 (2009) 484-490 489 Figure 4. Calibrated conductance volume measurements, Vg(t) versus absolute volume, V(t) at end-diastole (●) and end-systole (○) for each of the three latex balloons. Conduc- tance volume measurements were calibrated using either αV(t) (●, ○) or αSV (▼, ).Curves (dashed lines) representing re- gression analyses of the calibrated conductance vol- ume-absolute volume relations are also illustrated. Figure 5. Calibrated conductance volume measurement error, ζ versus absolute volume, V(t) at end-diastole (●) and end-systole (○).Conductance volume measurements calibrated using either αV(t) (●, ○) or αSV (▼, ). Volume measurement error was calculated as a percentage of the absolute volume. Curves (dotted and dashed lines) representing regression analyses of the measurement error-absolute volume relations are also illustrated. changes in parallel conductance during the cardiac cycle [13]. However, this study used a physical model of the left ventricle without parallel conductance. Our findings suggest that parallel conductance is not a comprehensive explanation for why the calibration coefficient varies as a function of the ventricular volume. Although conductance volume measurements can be calibrated against another synchronous estimate of ven- tricular volume [3,10,18], they are generally calibrated with an alternate measurement of stroke volume [6,10]. Calibration with either an alternate measurement of ven- tricular volume or stroke volume are generally consid- ered equivalent. This study also identified that the αV(t) and αSV are different. The stroke volume quotient, αSV was lower than αV(t) and the calibration coefficient ratio, αSV / αV(t) became progressively smaller as the ventricular volume increased. Calibrating conductance volume measurements with αSV resulted in the significant over- estimation of end-diastolic and end-systolic volume, and the degree of overestimation was even more pronounced at higher volumes. This demonstrates that conductance volume measurements should ideally be calibrating us- ing an independent measure of ventricular volume like, for example, contrast cineangiography, echocardiogra- phy or magnetic resonance imaging. The difference between the αV(t)-volume and αSV- volume relations may be attributed to the non-homoge- neous electrical field distribution established by the conductance catheter [4,12]. Conductance volume mea- surements are disproportionately influenced by the areas around the longitudinal axis of the ventricle where the electrical field is strongest. By contrast, changes in vo- lume that occur during ejection or when loading condi- tions are varied primarily affect the myocardial boun- dary where the electrical field density is weakest. Con- sequently, αSV and αV(t) are not equivalent and cannot be used interchangeably. 4.1. Study Limitations The physical model of the isolated left ventricle used in this study did not allow changes in the volume loading conditions could not be modelled continuously. Instead, a series of steady-state experiments were made at incre- mental end-diastolic volumes in three separate models, which carries with it the risk of repeated measurement errors. The changes in ventricular volume resulted from changes in the short-axis dimension of the model only. It was not possible to examine any effect of changing ven- tricular length, such as those that may occur during the cardiac cycle [19]. Ideally, the volumes within the model ventricle would have been acquired simultaneously using the conduc- tance catheter and another independent method. In the original design, the ejected volume was measured ac- cording to the pressure generated within the fluid col- umn [14]. However, preliminary experiments demon- strated that the fluid-filled micromanometer was not sufficiently accurate to enable instantaneous volume measurements throughout the cardiac cycle and, there- fore, measurements were made with the calibrated measuring cylinder. 5. CONCLUSIONS The conductance catheter technique incorporates a cali- bration coefficient, α, in order to obtain accurate volume SciRes Copyright © 2009 JBiSE 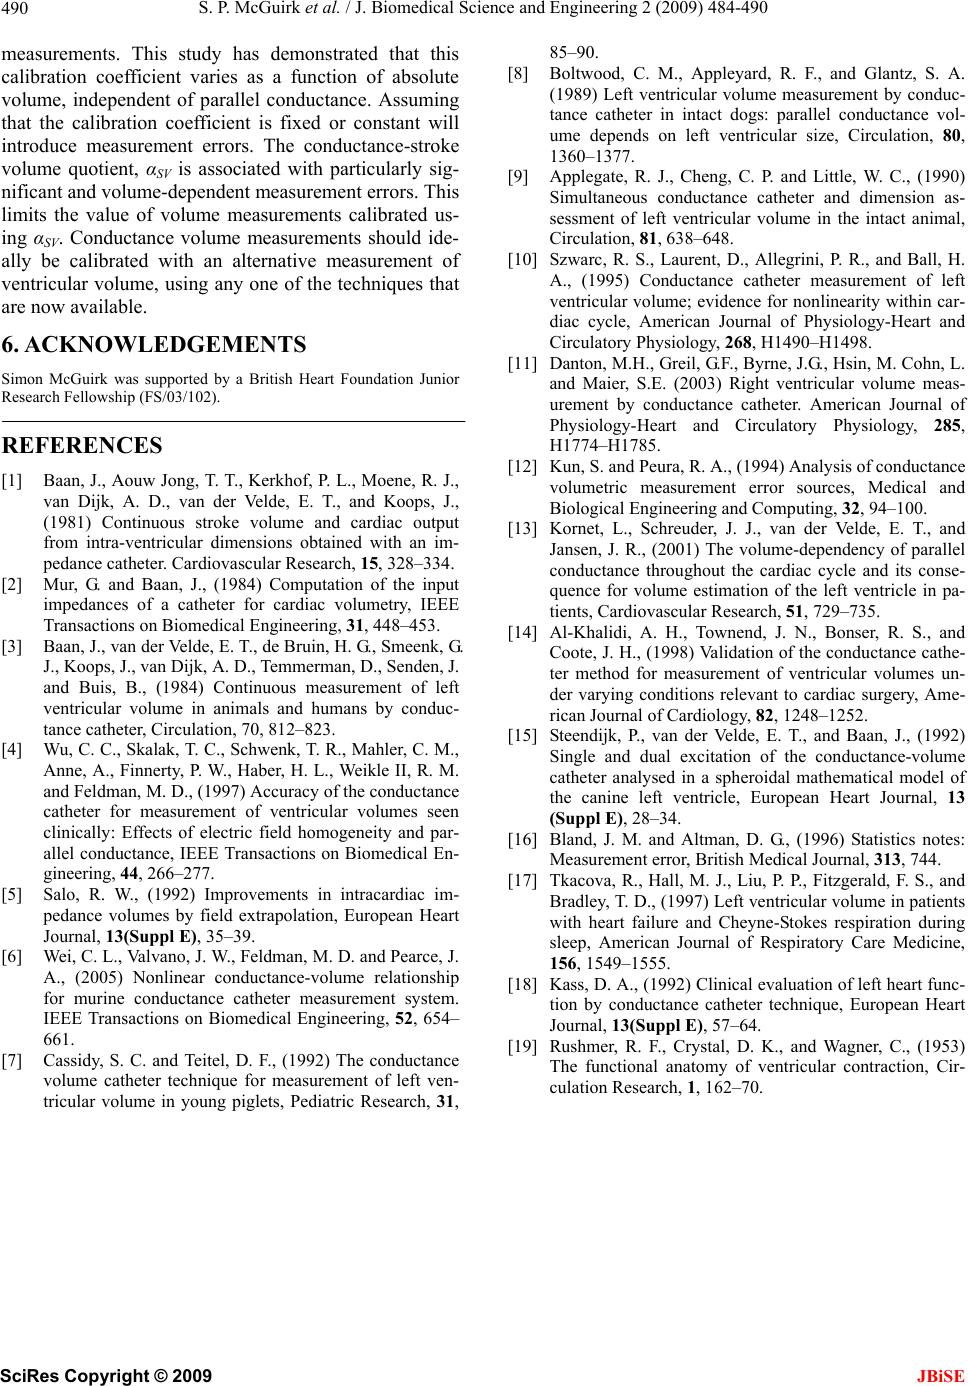 S. P. McGuirk et al. / J. Biomedical Science and Engineering 2 (2009) 484-490 SciRes Copyright © 2009 490 measurements. This study has demonstrated that this calibration coefficient varies as a function of absolute volume, independent of parallel conductance. Assuming that the calibration coefficient is fixed or constant will introduce measurement errors. The conductance-stroke volume quotient, αSV is associated with particularly sig- nificant and volume-dependent measurement errors. This limits the value of volume measurements calibrated us- ing αSV. Conductance volume measurements should ide- ally be calibrated with an alternative measurement of ventricular volume, using any one of the techniques that are now available. JBiSE 6. ACKNOWLEDGEMENTS Simon McGuirk was supported by a British Heart Foundation Junior Research Fellowship (FS/03/102). REFERENCES [1] Baan, J., Aouw Jong, T. T., Kerkhof, P. L., Moene, R. J., van Dijk, A. D., van der Velde, E. T., and Koops, J., (1981) Continuous stroke volume and cardiac output from intra-ventricular dimensions obtained with an im- pedance catheter. Cardiovascular Research, 15, 328–334. [2] Mur, G. and Baan, J., (1984) Computation of the input impedances of a catheter for cardiac volumetry, IEEE Transactions on Biomedical Engineering, 31, 448–453. [3] Baan, J., van der Velde, E. T., de Bruin, H. G., Smeenk, G. J., Koops, J., van Dijk, A. D., Temmerman, D., Senden, J. and Buis, B., (1984) Continuous measurement of left ventricular volume in animals and humans by conduc- tance catheter, Circulation, 70, 812–823. [4] Wu, C. C., Skalak, T. C., Schwenk, T. R., Mahler, C. M., Anne, A., Finnerty, P. W., Haber, H. L., Weikle II, R. M. and Feldman, M. D., (1997) Accuracy of the conductance catheter for measurement of ventricular volumes seen clinically: Effects of electric field homogeneity and par- allel conductance, IEEE Transactions on Biomedical En- gineering, 44, 266–277. [5] Salo, R. W., (1992) Improvements in intracardiac im- pedance volumes by field extrapolation, European Heart Journal, 13(Suppl E), 35–39. [6] Wei, C. L., Valvano, J. W., Feldman, M. D. and Pearce, J. A., (2005) Nonlinear conductance-volume relationship for murine conductance catheter measurement system. IEEE Transactions on Biomedical Engineering, 52, 654– 661. [7] Cassidy, S. C. and Teitel, D. F., (1992) The conductance volume catheter technique for measurement of left ven- tricular volume in young piglets, Pediatric Research, 31, 85–90. [8] Boltwood, C. M., Appleyard, R. F., and Glantz, S. A. (1989) Left ventricular volume measurement by conduc- tance catheter in intact dogs: parallel conductance vol- ume depends on left ventricular size, Circulation, 80, 1360–1377. [9] Applegate, R. J., Cheng, C. P. and Little, W. C., (1990) Simultaneous conductance catheter and dimension as- sessment of left ventricular volume in the intact animal, Circulation, 81, 638–648. [10] Szwarc, R. S., Laurent, D., Allegrini, P. R., and Ball, H. A., (1995) Conductance catheter measurement of left ventricular volume; evidence for nonlinearity within car- diac cycle, American Journal of Physiology-Heart and Circulatory Physiology, 268, H1490–H1498. [11] Danton, M.H., Greil, G.F., Byrne, J.G., Hsin, M. Cohn, L. and Maier, S.E. (2003) Right ventricular volume meas- urement by conductance catheter. American Journal of Physiology-Heart and Circulatory Physiology, 285, H1774–H1785. [12] Kun, S. and Peura, R. A., (1994) Analysis of conductance volumetric measurement error sources, Medical and Biological Engineering and Computing, 32, 94–100. [13] Kornet, L., Schreuder, J. J., van der Velde, E. T., and Jansen, J. R., (2001) The volume-dependency of parallel conductance throughout the cardiac cycle and its conse- quence for volume estimation of the left ventricle in pa- tients, Cardiovascular Research, 51, 729–735. [14] Al-Khalidi, A. H., Townend, J. N., Bonser, R. S., and Coote, J. H., (1998) Validation of the conductance cathe- ter method for measurement of ventricular volumes un- der varying conditions relevant to cardiac surgery, Ame- rican Journal of Cardiology, 82, 1248–1252. [15] Steendijk, P., van der Velde, E. T., and Baan, J., (1992) Single and dual excitation of the conductance-volume catheter analysed in a spheroidal mathematical model of the canine left ventricle, European Heart Journal, 13 (Suppl E), 28–34. [16] Bland, J. M. and Altman, D. G., (1996) Statistics notes: Measurement error, British Medical Journal, 313, 744. [17] Tkacova, R., Hall, M. J., Liu, P. P., Fitzgerald, F. S., and Bradley, T. D., (1997) Left ventricular volume in patients with heart failure and Cheyne-Stokes respiration during sleep, American Journal of Respiratory Care Medicine, 156, 1549–1555. [18] Kass, D. A., (1992) Clinical evaluation of left heart func- tion by conductance catheter technique, European Heart Journal, 13(Suppl E), 57–64. [19] Rushmer, R. F., Crystal, D. K., and Wagner, C., (1953) The functional anatomy of ventricular contraction, Cir- culation Research, 1, 162–70. |