

Paper Menu >>
Journal Menu >>
 American Journal of Anal yt ical Chemistry, 2011, 2, 840-848 doi:10.4236/ajac.2011.27095 Published Online November 2011 (http://www.SciRP.org/journal/ajac) Copyright © 2011 SciRes. AJAC The Influence of Initial Carbonate Concen tra tio n o n th e Folin-Ciocalteu Micro-Method for the Determination of Phenolics with Low Concentration in the Presence of Methanol: A Comparative Study of Real-Time Monitored Reactions Nunzia Cicco1, Vincenzo Lattanzio2 1Institute of Methodologies for Environmental Analysis, National Research Council, Tito Scalo, Italy 2Department of Agro-Environmental Sciences, Chemistry and Crop Protection, University of Foggia, Foggia, Italy E-mail: [email protected] Received August 17, 2011; revised September 19, 2011; accepted October 8, 2011 Abstract During the Folin Ciocalteu (F-C) micro-assay for the determination of phenolics in the presence of methanol, fine solids can form. In a previous paper, we hypothesized that the interference from alcohol on the F-C re- action can be minimized depending on the particular procedure used to reach the alkalinity condition. In or- der to demonstrate our hypothesis we studied, by spectrophotometrically monitoring, the time-behaviour of the reactions carried out in the presence of different methanol concentrations at the same alkalinity condition from two protocols. The results showed that the interfering effect of methanol on the F-C micro-method can be affect and even prevented depending on working conditions. In particular, the formation of fine solids can be delayed, slowed down and prevented depending on the initial carbonate concentration used. We have ex- plained why the initial carbonate concentration, used to reach the final alkalinity condition, plays an impor- tant role in the F-C reaction carried out in the presence of methanol. Moreover, the results from real-time monitoring showed that, differently from traditional F-C procedure, our procedure allows us to carry out the F-C micro method in the presence of 6% methanol, as an extreme concentration, reading the absorbance at real time 24 min. The real-time monitoring of absorbance can be considered as a useful means to explore the effect of other parameters on precipitate formation caused by the presence of methanol in the F-C reaction. Keywords: F-C Micro-Method, Phenolics, Carbonate Influence, Methanol Effect 1. Introduction Phenolic compounds, widely distributed in plants and food plants, are thoroughly studied by different resear- chers because of their health beneficial properties [1,2]. Many analytical procedures have been developed to study polyphenolic compounds, in any case, a quantifica- tion study is always undertaken as a preliminary step. Al- though the chromatographic methodology is considered as the most important analytical tool for the quantitative determination of phenolics, the traditional colorimetric methodology is frequently employed for this purpose because of its easier availability in many laboratories. The colorimetric method generally used is the Folin Ciocalteu (F-C) one that consists of a rapid oxidation reaction of phenols by using alkali, generally sodium car- bonate, which yields an appreciable concentration of the phenolate ions. The phenolates reduce the yellow F-C re- active changing it into a blue pigment, spectrophoto- metrically measured. Due to the complexity of the com- peting reactions involved in the F-C method, reaction equilibrium is fairly unstable and it is not easy to find the exact conditions for the assay [3]. In order to find the optimal conditions to accomplish the assay, only few authors [3-6] widely studied the influence of parameters such as temperature, reaction time, amount of F-C reac- tive and initial as well as final concentration of alkali. Although the optimized conditions by Singleton are gen-  841 N. CICCO ET AL. erally used [3], different variations in the F-C method are reported in literature [7-13]. However, even though this colorimetric method is of- ten used for the determination of phenolic content in numerous and complex samples, the many insuperable difficulties involved bring its usefulness into question. In fact, due to the lack of selectivity which is peculiar to this method, some substances react with the yellow reac- tive causing an overestimation of the phenolic content. Moreover, an important F-C method drawback/limitation is that under some conditions precipitates can form. Consequently, it is necessary to resort to additional tech- niques, such as filtration or centrifugation, which are time-consuming and can sometimes reduce the blue col- our yield [3]. In order to prevent the precipitate formation, Singleton and Rossi [3] suggest accomplishing the assay at room temperature and not exceeding the 3% concentration of the sodium carbonate in the final mixture, although the initial carbonate solution to be used may be relatively concentrated (20%). Moreover, to obtain reproducible re- sults, Singleton et al. [14] suggest not exceeding the 1% alcoholic concentration in the final reaction mixture. In this regard, a sample dilution is carried out to avoid problem of precipitate formation but, sometimes, no di- lution of alcoholic extracts can be carried out because of their low phenolic content. In a recent paper [7], aimed at quickly determining the total content of phenolics in little diluted methanol ex- tracts, we tested an F-C micro-procedure compatible with the final concentration of alcohol equal to 4%. The detail of our procedure is to have used 800 l of a car- bonate solution at 5%, carrying out the F-C reaction in the presence of 4% alkali and at 40˚C. In other words, we used an initial carbonate solution with a very low con- centration when compared to that used by Singleton, carrying out the assay at a higher final carbonate concen- tration and a higher temperature than those suggested by Singleton. This procedure allowed us to reduce the reac- tion time by combining together the effects of alkali and temperature [7]. We hypothesized that the peculiarity of the procedure used in our F-C micro-assay can minimize the interfer- ence from alcohol. The aim of this study is to validate such a hypothesis and to understand why the use of the 5% carbonate solu- tion is important for the determination of phenolics in the presence of methanol. With this purpose in mind, we have compared the F-C reactions carried out in the pres- ence of different methanol concentrations and derived from two procedures (protocols A and B). In each of these a different carbonate concentration has been used to reach the same alkali amount in the tested reaction mixtures which have the same final volumes. The F-C reactions were monitored in real-time and the formation of the precipitate was investigated for the first time. 2. Material and Methods 2.1. Reagents Experiments were performed using the F-C reagent from Merck (1.09001), sodium carbonate (S6139) and pure caffeic acid (C0626), chosen as a standard phenol, from Sigma. Methanol solutions at the different concentrations each containing 80 mg/l of caffeic acid, which is the up- per limit concentration of the standard that can be used in the assay, were prepared as described in the previous paper [7]. 2.2. Protocols A and B The details of protocols A and B are briefly reported here. 100 μl of standard solution (80 mg/l or 0-blank) at differ- ent methanol concentrations were pipetted into separate test tubes and 100 μl of F-C reagent were added to each. The mixtures were mixed well and allowed to equilibrate. For protocol A, after exactly 2 min, 800 μl of the 5% (w/v) sodium carbonate solution were added. For protocol B, within the 2 min, 600 l of distilled water were added and the mixtures were mixed again, then 200 μl of the 20% (w/v) sodium carbonate solution were added. The absorbance time-behaviour of investigated mix- tures, previously swirled and poured into 1-cm cuvettes, was monitored over a period of 2 h at 40˚C recording the absorbance data every two minutes. 2.3. Apparatus The absorbance variations of investigated mixtures were monitored by the spectrophotometer UV/visible ultro- spec 4000 (Pharmacia) equipped with a 6 position water heated cell changer. The morphological observation of some precipitates from both procedures was made by Scanning Electron Microscopy (SEM Zeiss Supra 40). 3. Results and Discussion 3.1. Plan Working In order to verify the previously mentioned hypothesis, the following steps were taken to obtain the data used in this study. Copyright © 2011 SciRes. AJAC  N. CICCO ET AL. 842 1) The investigated reactions were carried out at 40˚C and at 4% carbonate concentration in the final mixture, which corresponds to that of our previous paper [7]. The final carbonate concentration was reached using two dif- ferent carbonate solutions. The former at 5%, already e- mployed in our previous paper [7], was the lowest con- centration reported in literature, the latter at 20% was the highest concentration reported in literature [3,14]. 2) Only the 20%-40%-60%-80%-100% methanol solu- tions were investigated to obtain a comprehensive view. Moreover, 3 replicates were carried out on each solution for 4 times to get a fair amount of data. 3) The absorbance time-behaviour of the investigated mixtures was monitored over a period equal to 2 h, which we considered long enough, recording the absorbance data every two minutes, which we considered short enough. 4) To describe the influence of the initial carbonate concentration used (i.e. 5% carbonate of our procedure) on the F-C micro-method carried out in the presence of methanol, a comparative study of the mean kinetics was made. For reasons of simplicity, the incremental ratios of the first and second order were calculated between adja- cent mean absorbance values. The incremental ratio ana- lysis allowed us to determine the beginning and the end of the phenomenon of each mean kinetic with a good degree of approximation. In fact, even though the con- stant time increments were not infinitely small, they were small enough (two minutes) with respect to the two hours of kinetics so that possible errors in the time determina- tions are at the most two minutes. 3.2. Comparison between the Mean Kinetics within Each Procedure The overlays of mean kinetics at different methanol con- centrations from protocols A and B are showed in Fig- ures 1 and 2, respectively. Mean kinetics at the single methanol concentrations are also showed in these figures to ensure clarity of details. As expected, the interfering effect of methanol caused the formation of an atypical peak on some reaction curves (Figures 1(a)-(c), Figures 2(a)-(d)), producing an unusual kinetic behaviour. In fact, when the F-C reaction was car- ried out in the presence of methanol, fine solids formed and precipitated in time (clouding and precipitation), out- lining the left and the right sides of the peak, respectively. The whole phenomenon appeared spectrophotometrically unhomogeneous, showing high standard deviations (Figures 1(a)-(c), Figures 2(a)-(d)). Moreover, it was rather general with the exception of the kinetics carried out in the presence of 2% and 4% methanol from proce- dure A, where the phenomenon never appeared (Figures 1(d)-(e)), and in the presence of 2% methanol from pro- cedure B, where only the beginning of the clouding was possible to observe (Figure 2(e)). On the basis of a comparative analysis among the mean kinetics within each procedure we can claim that both the appearance and the duration of peaks are corre- lated with methanol concentration. In particular, the peaks of mean kinetics within each procedure shift and the phenomenon duration increases with decreasing methanol concentration (Figures 1 and 2). The behav- iours observed within each procedure can be ascribed to the fact that, as the methanol concentration rises, solute (i.e. inorganic salts or ionic species) solubility in reaction mixtures decreases. Theoretically, alcohol affects the dielectric constant of the medium, the inter-ionic attrac- tion, and the solute-solvent interaction [15]. Thus, alco- hol can reduce the solubility of inorganic salts decreasing on the one hand the solvation of the ions and on the other the dissociation of salts. In any case, when an alcohol solvent is mixed with a salt water solution, the dielectric property of the newly-formed mixed solvent decreases and the solubility of the solute in the reaction mixture correspondingly decreases [16] bringing about the pre- cipitation phenomenon observed. Furthermore, it was also reported that the presence of alcohol accelerated the particle growth rate [17]. It is important to mention briefly that the precipitate formation ensues from a two-step process. In the first step, called nucleation, some tiny particles known as nuclei are generated. In the second step, called growth, the nuclei grow and the visible solid-phase particles are formed. The rates of these two consecutive steps deter- mine the particle size and its distribution [18]. Moreover, it is worth recalling that, the supersaturation of reaction mixture, the ability to dissolve more solids than that of its equilibrium state, is the primary driving force for the precipitate formation. Generally, a higher degree of su- persaturation can generate a rapid nucleation and a slow growth. On the contrary, a lower degree of supersatura- tion promotes a slow nucleation and a fast growth [19]. It is known that the control of supersaturation requires the knowledge of all the variables affecting the formation of fine solids, such as impurities, temperature, pH ect. The effects of these parameters on F-C method in the pres- ence of methanol are very interesting and still need to be completely understood. In this section and in following one, we discussed the results about the effect from the initial carbonate concen- tration on F-C method in the presence of an increasing methanol concentration in the final reaction mixture. In the context of this section, the difference observed can be attributed to the fact that, as the methanol concentration rises, the degree of supersaturation of solute in reaction mixtures decreases due to the resulting reduction in Copyright © 2011 SciRes. AJAC 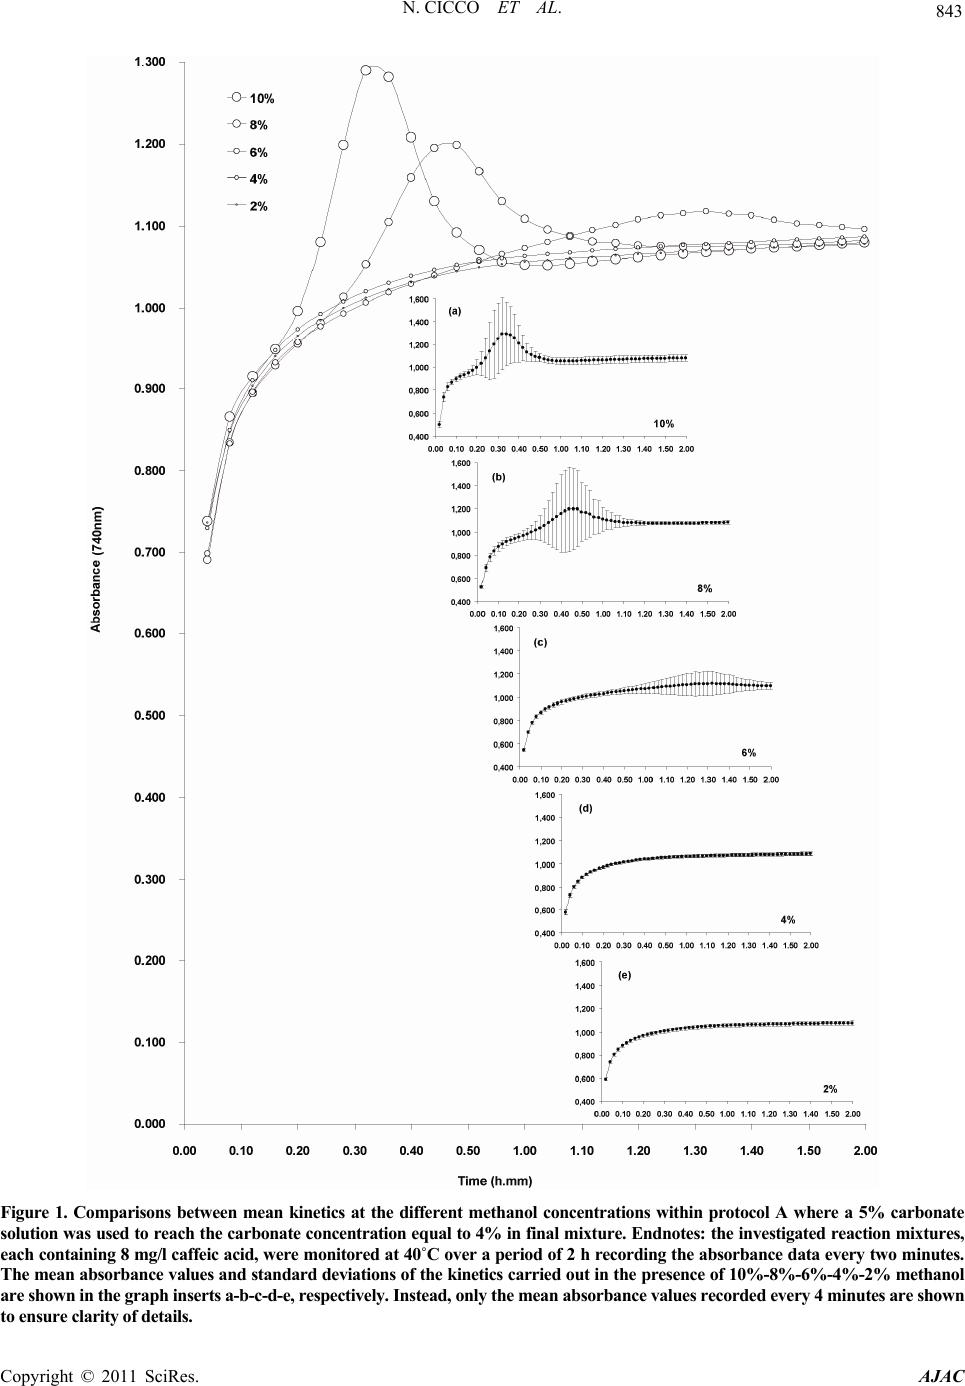 N. CICCO ET AL. Copyright © 2011 SciRes. AJAC 843 Figure 1. Comparisons between mean kinetics at the different methanol concentrations within protocol A where a 5% carbonate solution was used to reach the carbonate co ncentration equal to 4% in final mixture. Endnotes: the investigated re action mixtures, each containing 8 mg/l ca ffeic acid, w ere monitored at 40 ˚C over a period of 2 h recording the absorbance data every two minutes. The mean absorbance values and standard deviations of the kinetics carried out in the presence of 10%-8%-6%-4%-2% methanol are shown in the graph inserts a-b-c-d-e, respectively. Instead, only the m ean ab sorb ance valu es reco rded ev ery 4 min utes a re shown to ensure clarit y of details . 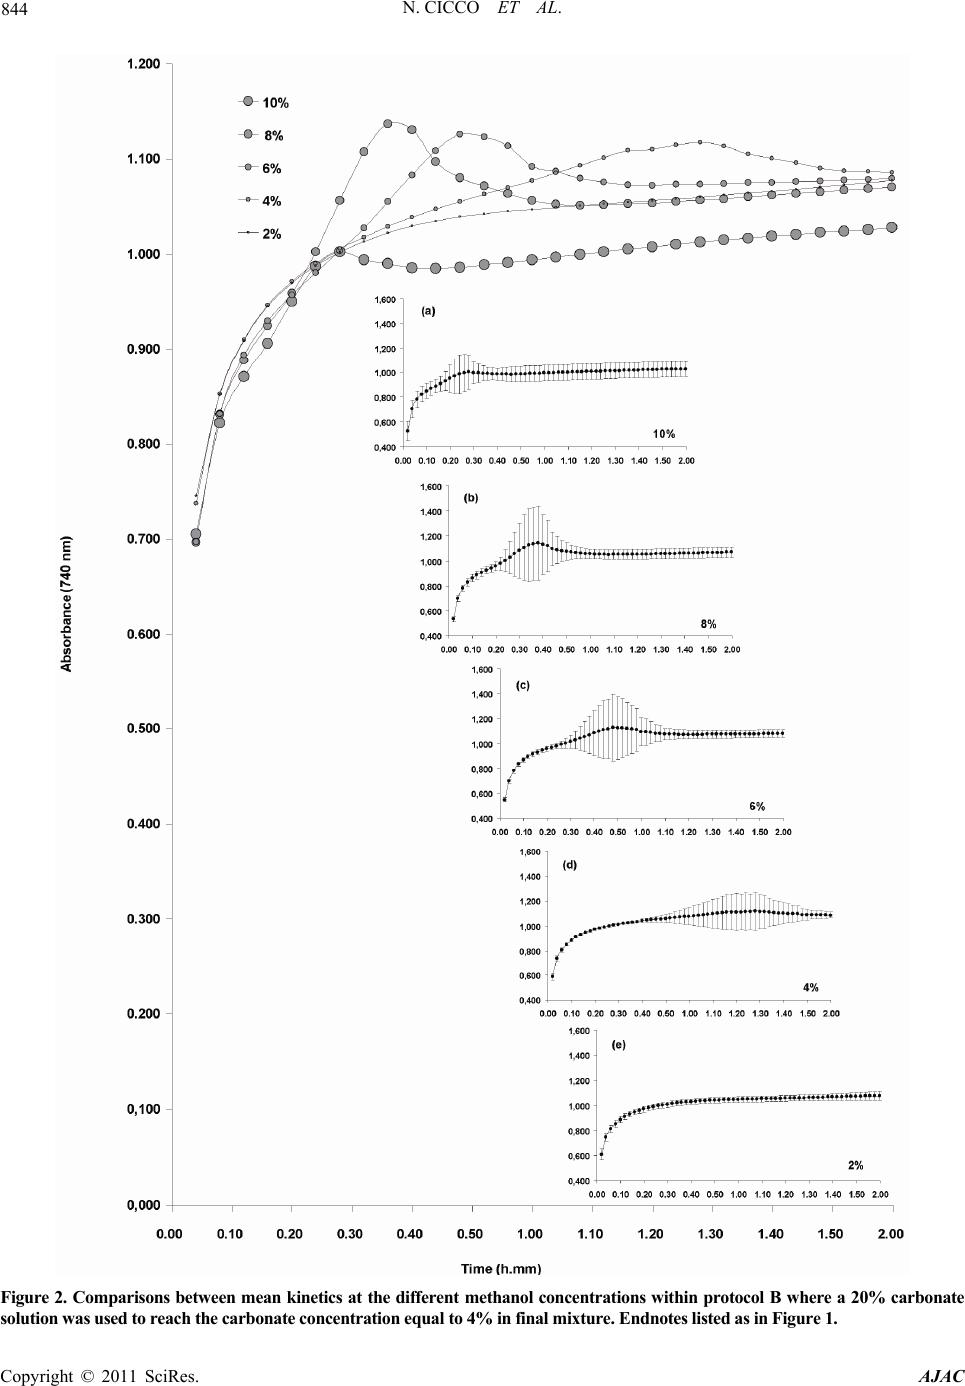 N. CICCO ET AL. 844 Figure 2. Comparisons between mean kinetics at the different methanol concentrations within protocol B where a 20% carbonate solution was used to reach the carbonate concentration equal to 4% in fina l mixtu re. Endnot es listed as in Figure 1 . Copyright © 2011 SciRes. AJAC 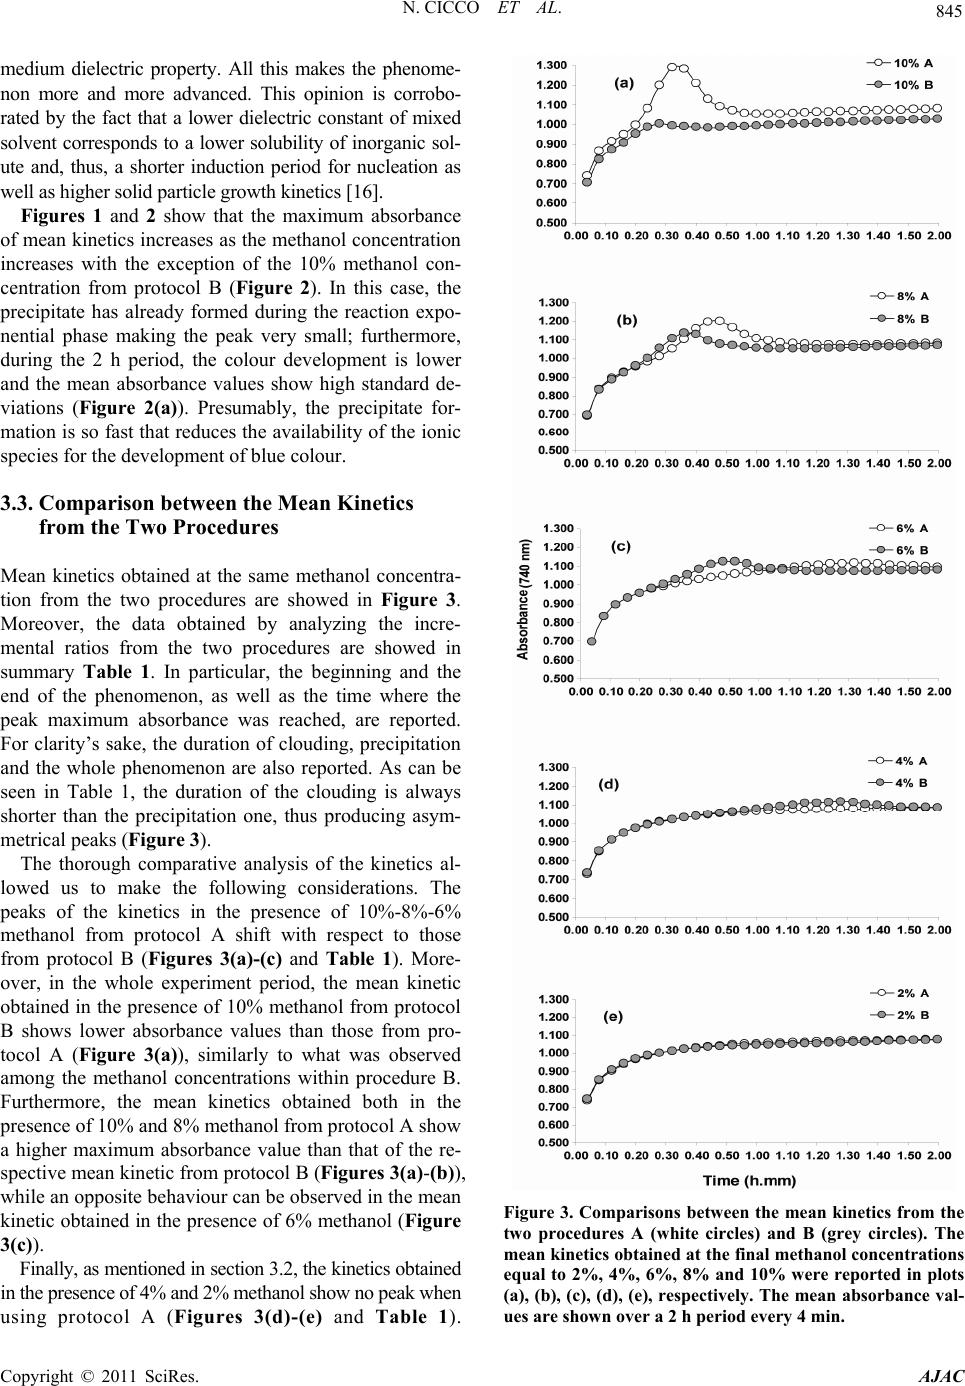 N. CICCO ET AL. Copyright © 2011 SciRes. AJAC 845 medium dielectric property. All this makes the phenome- non more and more advanced. This opinion is corrobo- rated by the fact that a lower dielectric constant of mixed solvent corresponds to a lower solubility of inorganic sol- ute and, thus, a shorter induction period for nucleation as well as higher solid particle growth kinetics [16]. Figures 1 and 2 show that the maximum absorbance of mean kinetics increases as the methanol concentration increases with the exception of the 10% methanol con- centration from protocol B (Figure 2). In this case, the precipitate has already formed during the reaction expo- nential phase making the peak very small; furthermore, during the 2 h period, the colour development is lower and the mean absorbance values show high standard de- viations (Figure 2(a)). Presumably, the precipitate for- mation is so fast that reduces the availability of the ionic species for the development of blue colour. 3.3. Comparison between the Mean Kinetics from the Two Procedures Mean kinetics obtained at the same methanol concentra- tion from the two procedures are showed in Figure 3. Moreover, the data obtained by analyzing the incre- mental ratios from the two procedures are showed in summary Table 1. In particular, the beginning and the end of the phenomenon, as well as the time where the peak maximum absorbance was reached, are reported. For clarity’s sake, the duration of clouding, precipitation and the whole phenomenon are also reported. As can be seen in Table 1, the duration of the clouding is always shorter than the precipitation one, thus producing asym- metrical peaks (Figure 3). The thorough comparative analysis of the kinetics al- lowed us to make the following considerations. The peaks of the kinetics in the presence of 10%-8%-6% methanol from protocol A shift with respect to those from protocol B (Figures 3(a)-(c) and Table 1). More- over, in the whole experiment period, the mean kinetic obtained in the presence of 10% methanol from protocol B shows lower absorbance values than those from pro- tocol A (Figure 3(a)), similarly to what was observed among the methanol concentrations within procedure B. Furthermore, the mean kinetics obtained both in the presence of 10% and 8% methanol from protocol A show a higher maximum absorbance value than that of the re- spective mean kinetic from protocol B (Figures 3(a)-(b)), while an opposite behaviour can be observed in the mean kinetic obtained in the presence of 6% methanol (Figure 3(c)). Figure 3. Comparisons between the mean kinetics from the two procedures A (white circles) and B (grey circles). The mean kinetics obtained at the final methanol concentrations equal to 2%, 4%, 6%, 8% and 10% were reported in plots (a), (b), (c), (d), (e), respectively. The mean absorbance val- ues are shown over a 2 h period every 4 min. Finally, as mentioned in section 3.2, the kinetics obtained in the presence of 4% and 2% methanol show no peak when using protocol A (Figures 3(d)-(e) and Table 1). 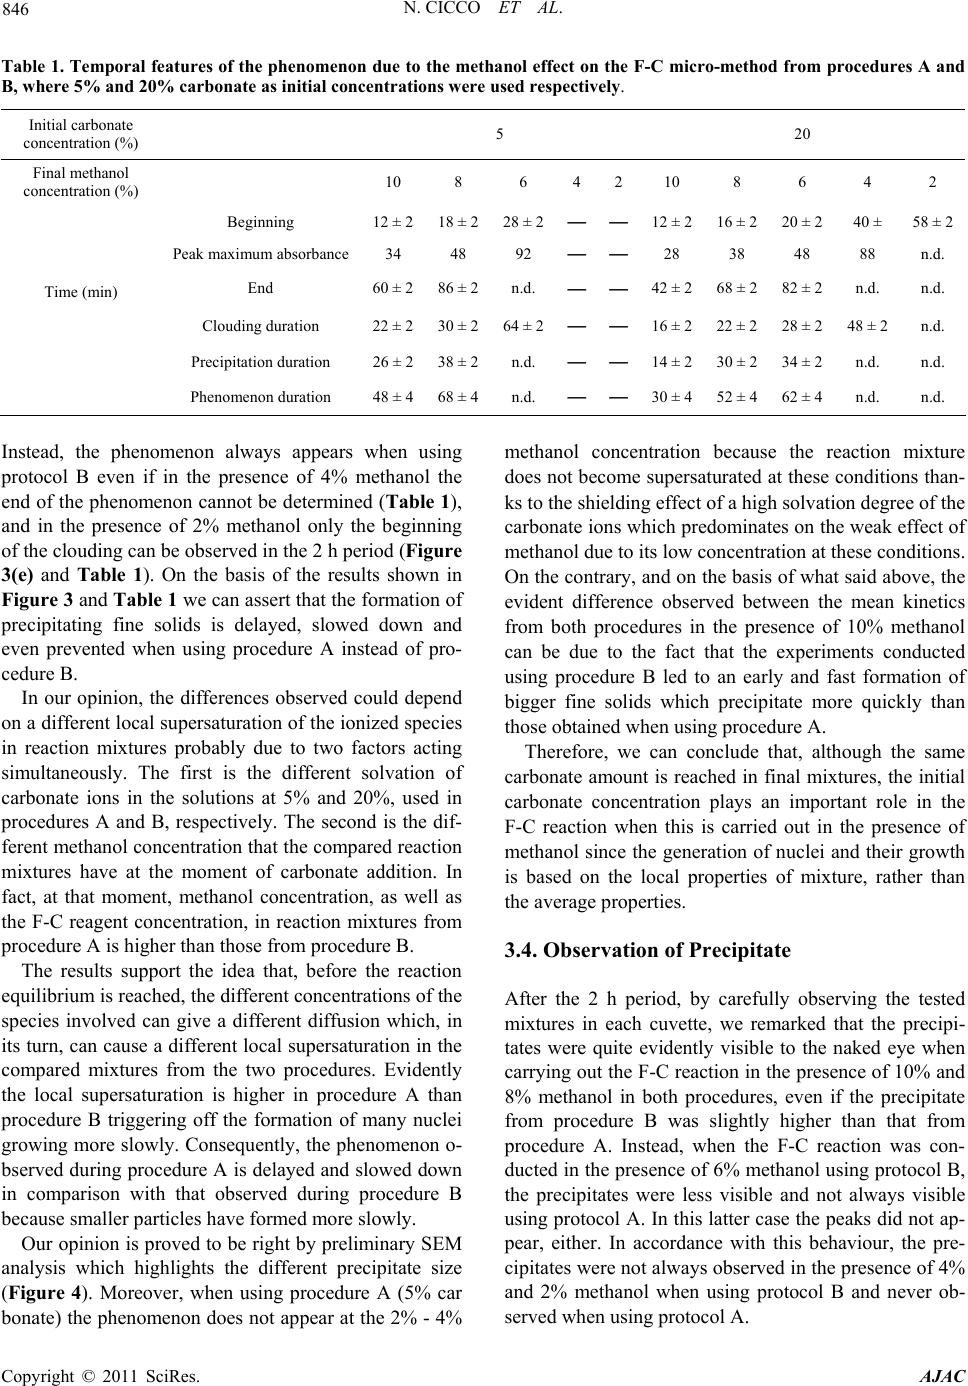 N. CICCO ET AL. 846 Table 1. Temporal features of the phenomenon due to the methanol effect on the F-C micro-method from procedures A and B, where 5% and 20% carbonate as initial concentrations were used respectively. Initial carbonate concentration (%) 5 20 Final methanol concentration (%) 10 8 6 4 2 10 8 6 4 2 Beginning 12 ± 218 ± 228 ± 2― ―12 ± 216 ± 2 20 ± 2 40 ± 58 ± 2 Peak maximum absorbance 34 48 92 ――28 38 48 88 n.d. End 60 ± 286 ± 2n.d. ― ―42 ± 268 ± 2 82 ± 2 n.d. n.d. Clouding duration 22 ± 230 ± 264 ± 2― ―16 ± 222 ± 2 28 ± 2 48 ± 2n.d. Time (min) Precipitation duration 26 ± 238 ± 2n.d. ― ―14 ± 230 ± 2 34 ± 2 n.d. n.d. Phenomenon duration 48 ± 468 ± 4n.d. ― ―30 ± 452 ± 4 62 ± 4 n.d. n.d. Instead, the phenomenon always appears when using protocol B even if in the presence of 4% methanol the end of the phenomenon cannot be determined (Tab le 1), and in the presence of 2% methanol only the beginning of the clouding can be observed in the 2 h period (Figure 3(e) and Table 1). On the basis of the results shown in Figure 3 and Table 1 we can assert that the formation of precipitating fine solids is delayed, slowed down and even prevented when using procedure A instead of pro- cedure B. In our opinion, the differences observed could depend on a different local supersaturation of the ionized species in reaction mixtures probably due to two factors acting simultaneously. The first is the different solvation of carbonate ions in the solutions at 5% and 20%, used in procedures A and B, respectively. The second is the dif- ferent methanol concentration that the compared reaction mixtures have at the moment of carbonate addition. In fact, at that moment, methanol concentration, as well as the F-C reagent concentration, in reaction mixtures from procedure A is higher than those from procedure B. The results support the idea that, before the reaction equilibrium is reached, the different concentrations of the species involved can give a different diffusion which, in its turn, can cause a different local supersaturation in the compared mixtures from the two procedures. Evidently the local supersaturation is higher in procedure A than procedure B triggering off the formation of many nuclei growing more slowly. Consequently, the phenomenon o- bserved during procedure A is delayed and slowed down in comparison with that observed during procedure B because smaller particles have formed more slowly. Our opinion is proved to be right by preliminary SEM analysis which highlights the different precipitate size (Figure 4). Moreover, when using procedure A (5% car bonate) the phenomenon does not appear at the 2% - 4% methanol concentration because the reaction mixture does not become supersaturated at these conditions than- ks to the shielding effect of a high solvation degree of the carbonate ions which predominates on the weak effect of methanol due to its low concentration at these conditions. On the contrary, and on the basis of what said above, the evident difference observed between the mean kinetics from both procedures in the presence of 10% methanol can be due to the fact that the experiments conducted using procedure B led to an early and fast formation of bigger fine solids which precipitate more quickly than those obtained when using procedure A. Therefore, we can conclude that, although the same carbonate amount is reached in final mixtures, the initial carbonate concentration plays an important role in the F-C reaction when this is carried out in the presence of methanol since the generation of nuclei and their growth is based on the local properties of mixture, rather than the average properties. 3.4. Observation of Precipitate After the 2 h period, by carefully observing the tested mixtures in each cuvette, we remarked that the precipi- tates were quite evidently visible to the naked eye when carrying out the F-C reaction in the presence of 10% and 8% methanol in both procedures, even if the precipitate from procedure B was slightly higher than that from procedure A. Instead, when the F-C reaction was con- ducted in the presence of 6% methanol using protocol B, the precipitates were less visible and not always visible using protocol A. In this latter case the peaks did not ap- pear, either. In accordance with this behaviour, the pre- cipitates were not always observed in the presence of 4% and 2% methanol when using protocol B and never ob- served when using protocol A. Copyright © 2011 SciRes. AJAC 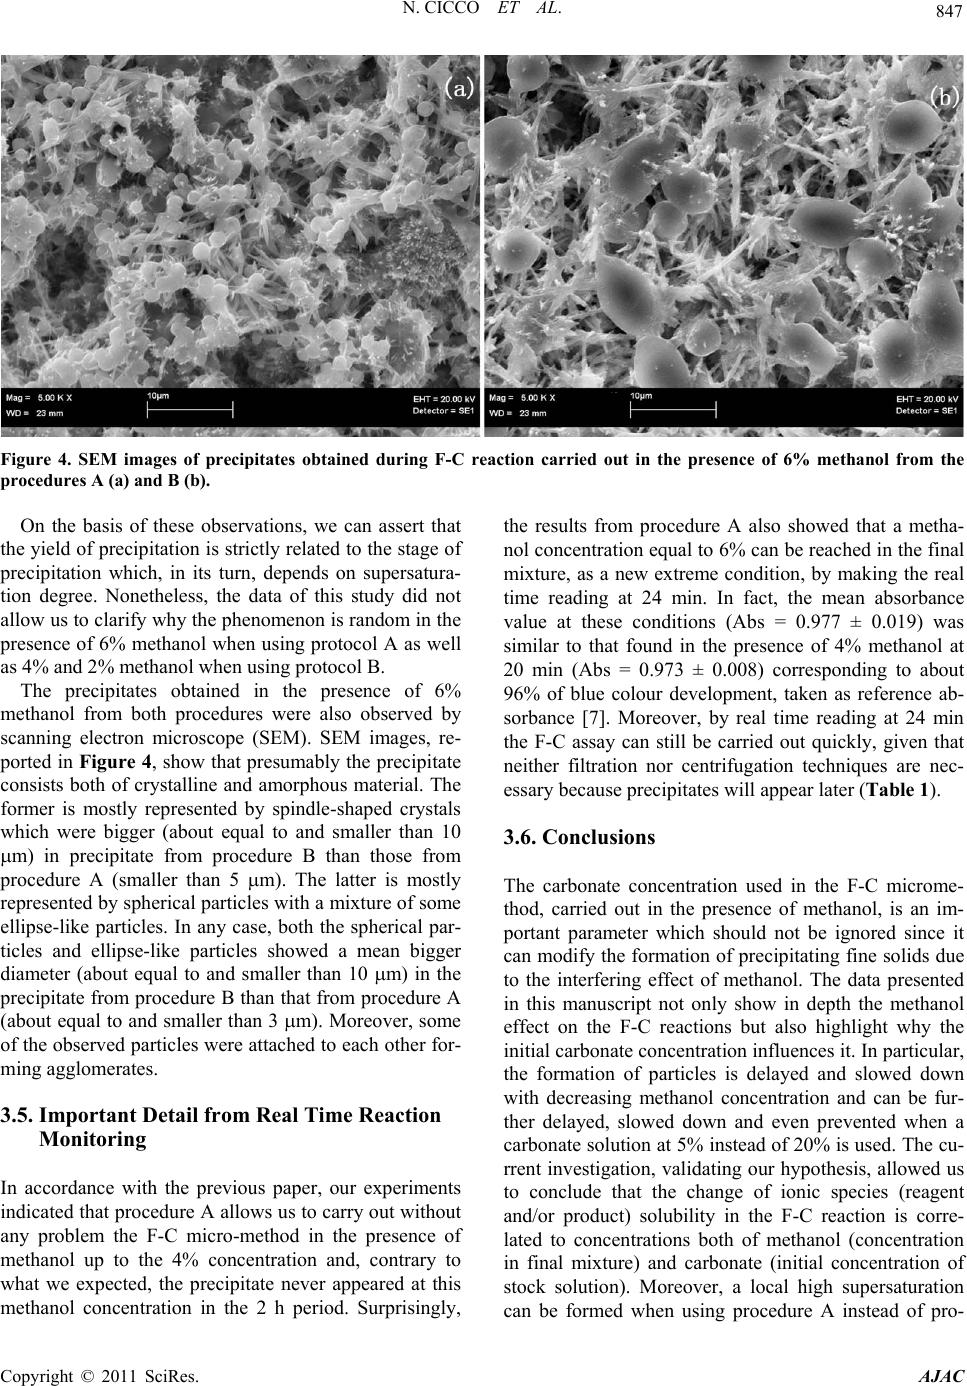 847 N. CICCO ET AL. Figure 4. SEM images of precipitates obtained during F-C reaction carried out in the presence of 6% methanol from the procedures A (a) and B (b). On the basis of these observations, we can assert that the yield of precipitation is strictly related to the stage of precipitation which, in its turn, depends on supersatura- tion degree. Nonetheless, the data of this study did not allow us to clarify why the phenomenon is random in the presence of 6% methanol when using protocol A as well as 4% and 2% methanol when using protocol B. The precipitates obtained in the presence of 6% methanol from both procedures were also observed by scanning electron microscope (SEM). SEM images, re- ported in Figure 4, show that presumably the precipitate consists both of crystalline and amorphous material. The former is mostly represented by spindle-shaped crystals which were bigger (about equal to and smaller than 10 m) in precipitate from procedure B than those from procedure A (smaller than 5 m). The latter is mostly represented by spherical particles with a mixture of some ellipse-like particles. In any case, both the spherical par- ticles and ellipse-like particles showed a mean bigger diameter (about equal to and smaller than 10 m) in the precipitate from procedure B than that from procedure A (about equal to and smaller than 3 m). Moreover, some of the observed particles were attached to each other for- ming agglomerates. 3.5. Important Detail from Real Time Reaction Monitoring In accordance with the previous paper, our experiments indicated that procedure A allows us to carry out without any problem the F-C micro-method in the presence of methanol up to the 4% concentration and, contrary to what we expected, the precipitate never appeared at this methanol concentration in the 2 h period. Surprisingly, the results from procedure A also showed that a metha- nol concentration equal to 6% can be reached in the final mixture, as a new extreme condition, by making the real time reading at 24 min. In fact, the mean absorbance value at these conditions (Abs = 0.977 ± 0.019) was similar to that found in the presence of 4% methanol at 20 min (Abs = 0.973 ± 0.008) corresponding to about 96% of blue colour development, taken as reference ab- sorbance [7]. Moreover, by real time reading at 24 min the F-C assay can still be carried out quickly, given that neither filtration nor centrifugation techniques are nec- essary because precipitates will appear later (Table 1). 3.6. Conclusions The carbonate concentration used in the F-C microme- thod, carried out in the presence of methanol, is an im- portant parameter which should not be ignored since it can modify the formation of precipitating fine solids due to the interfering effect of methanol. The data presented in this manuscript not only show in depth the methanol effect on the F-C reactions but also highlight why the initial carbonate concentration influences it. In particular, the formation of particles is delayed and slowed down with decreasing methanol concentration and can be fur- ther delayed, slowed down and even prevented when a carbonate solution at 5% instead of 20% is used. The cu- rrent investigation, validating our hypothesis, allowed us to conclude that the change of ionic species (reagent and/or product) solubility in the F-C reaction is corre- lated to concentrations both of methanol (concentration in final mixture) and carbonate (initial concentration of stock solution). Moreover, a local high supersaturation can be formed when using procedure A instead of pro- Copyright © 2011 SciRes. AJAC  N. CICCO ET AL. 848 cedure B resulting in a higher formation of nuclei grow- ing more slowly. Furthermore, we can assert that F-C assay can be car- ried out in the presence of 6% methanol, as a new ex- treme concentration, by real time reading the absorbance at 24 min. In our opinion, the real time monitoring of absorbance can be a useful means to explore the effect of other pa- rameters on precipitate formation caused by interference from methanol in the F-C reaction. The results of this study provide important information for further investigations aimed at increasing the alcohol concentration in the final F-C reaction mixture. 4. Acknowledgements The authors wish to acknowledge Dr. Luca Medici and Dr. Antonio Lettino for their scientific and technical as- sistance in SEM analysis. 5. References [1] N. C. Cook and S. Samman, “Flavonoids-Chemistry, Metabolism, Cardioprotective Effects and Dietary sour- ces,” The Journal of Nutritional Biochemistry, Vol. 7, 1996, pp. 66-76. doi:10.1016/0955-2863(95)00168-9 [2] C. A. Rice-Evans, R. N. J. Mille and G. Paganga, “Anti- Oxidant Properties of Phenolic Compounds,” Trends in Plant Science, Vol. 2, 1997, pp. 152-159. doi:10.1016/S1360-1385(97)01018-2 [3] V. L. Singleton and J. A. Rossi, “Colorimetry of Total Phenolics with Phosphomolybdic-Phosphotungstic Acid Reagents,” American Journal of Enology and Viticulture, Vol. 16, 1965, pp. 144-158. [4] J. Blouin, L. LLorca, F. R. Montreau and J. H. Dufour, “Etude des Conditions Optimales Pour la Determination des Composes Phenoliques Totaux par le Reactif de Folin Ciocalteu,” Connaissance de la Vigne et du Vin, Vol. 6, 1972, pp. 405-413. [5] F. R. Montreau, “Sur le Dosage des Composes Pheno- liques Totaux dans les vins par la Methode F-C,” Connaissance de la Vigne et du Vin, Vol. 6, 1972, pp. 397-404. [6] K. Slinkard and V. L. Singleton, “Total Phenol Analysis: Automation and Comparison with Manual Methods,” American Journal of Enology and Viticulture, Vol. 28, 1977, pp. 49-55. [7] N. Cicco, M. T. Lanorte, M. Paraggio, M. Viaggiano and V. Lattanzio, “A Reproducible Rapid and Inexpensive Folin-Ciocalteu Micro-Method in Determining Phenolics of Plant Methanol Extracts,” Microchemical Journal, Vol. 91, No. 1, 2009, pp. 107-110. doi:10.1016/j.microc.2008.08.011 [8] O. S. Balogun and T. Teraoka, “Time-Course Analysis of the Accumulation of Phenols in Tomato Seedlings In- fected with Potato Virus X and Tobacco mosaic virus,” Biokem, Vol. 16, No. 2, 2004, pp. 112-120. [9] M. Monagas, V. Nunez, B. Bartolomé and C. Go- mez-Cordoves, “Phenolic Content of Blends of Tem- pranillo with Graciano or Cabernet Sauvignon Wines Produced in Spain,” Food Technology and Biotechnology, Vol. 44, No. 4, 2006, pp. 507-513. [10] V. Papadimitriou, T. G. Sotiroudis, A. Xenakis, N. Sofi- kiti, V. Stavyiannoudaki and N. A. Chaniotakis, “Oxida- tive Stability and Radical Scavenging Activity of Extra Virgin Olive Oils: An Electron Paramagnetic Resonance Spectroscopy Study,” Analytica Chimica Acta, Vol. 573- 574, 2006, pp. 453-458. doi:10.1016/j.aca.2006.02.007 [11] G. Marigo, “Sur une Methode de Fractionnement et d’E- stimation des Composes Phenoliques Chez lez Vege- taux,” Analusis, Vol. 2, 1973, pp. 106-110. [12] G. A. Spanos and R. E. Wrolstad, “Influence of Process- ing and Storage on the Phenolic Composition of Thomp- son Seedless Grape Juice,” Journal of Agricultural and Food Chemistry, Vol. 38, No. 7, 1990, pp. 1565-1571. doi:10.1021/jf00097a030 [13] N. Sadler and H. Jacobs, “Application of the Folin-Cio- calteu Reagent to the Determination of Salbutamol in Pharmaceutical Preparations,” Talanta, Vol. 42, No. 10, 1995, pp. 1385-1388. doi:10.1016/0039-9140(95)01534-I [14] V. L. Singleton, R. O. Orthofer and R. M. Lamuela-Ra- ventos, “Analysis of Total Phenols and Other Oxidation Substrates and Antioxidants by Means of Folin-Ciocalteu Reagent,” Methods in Enzymology, Vol. 299, 1999, pp. 152-178. doi:10.1016/S0076-6879(99)99017-1 [15] F. Manoli and E. Dalas, “Spontaneous Precipitation of Calcium Carbonate in the Presence of Ethanol, Isopropa- nol and Diethylene Glycol,” Journal of Crystal Growth, Vol. 218, No. 2-4, 2000, pp. 359-364. doi:10.1016/S0022-0248(00)00560-1 [16] M. Z. C. Hu, E. A. Payzant and C. H. Byers, “Sol-Gel and Ultrafine Particle Formation via Dielectric Tuning of Inorganic Salt-Alcohol-Water Solutions,” Journal of Colloid and Interface Science, Vol. 222, 2000, pp. 20-36. [17] G. Guo, G. Yan, L. Wang and J. Huang, “Crystallization of Strontium Carbonate in Alcohol or Water Solution Containing Mixed Nonionic/Anionic Surfactants,” Mate- rials Letters, Vol. 62, No. 24, 2008, pp. 4018-4021. doi:10.1016/j.matlet.2008.05.052 [18] A. S. Myerson, “Crystal, Crystal Growth and Nuclea- tion,” Handbook of Industrial Crystallization, Butter- worth-Heinmann Publications, London, 1993, pp. 33-63. [19] V. Liotta and V. Sabesan, “Monitoring and Feedback Control of Supersaturation Using ATR-FTIR to Produce an Active Pharmaceutical Ingredient of a Desired Crystal Size,” Organic Process Research & Development, Vol. 8, No. 3, 2004, pp. 488-494. doi:10.1021/op049959n Copyright © 2011 SciRes. AJAC |