

Paper Menu >>
Journal Menu >>
 American Journal of Anal yt ical Chemistry, 2011, 2, 776-782 doi:10.4236/ajac.2011.27089 Published Online November 2011 (http://www.SciRP.org/journal/ajac) Copyright © 2011 SciRes. AJAC Hydralazine Hydrochloride: An Alternative Complexometric Reagent for Total Iron Spectrophotometric Determination Arlan de Assis Gonsalves1, Cleônia Roberta Melo Araújo1, Cristiane Xavier Galhardo2, Marília Oliveira Fonseca Goulart3, Fabiane Caxico de Abreu3 1Colegiado de Ciências Farmacêuticas, Universidade Federal do Vale do São Francisco, Petrolina, Brazil 2Colegiado de Engenharia Agronômica, Universidade Federal do Vale do São Francisco, Petrolina, Brazil 3Instituto de Química e Biotecnologia, Universidade Federal de Alagoas, Maceió, Brazil E-mail: [email protected] Received July 14, 2011; revised August 22, 2011; accepted September 3, 2011 Abstract An alternative spectrophotometric method has been developed for total iron determination using flow injec- tion analysis (FIA). The procedure is based on the coordination reaction between hydralazine and Fe2+ ions, which results in the formation of a purple complex monitored at 538 nm. For determination of total iron, Fe3+ ions were reduced using ascorbic acid. Under optimized conditions, a linear calibration graph (0.1 - 6.0 g·ml–1; n = 6) was obtained. The method allows LOD (3 of blank/slope = 0.06 g·ml–1) and LOQ (10 of blank/slope = 0.22 g·ml–1). The RSD ((s/x) × 100) for a mixed standard containing 0.60 g·ml–1 Fe2+ and Fe3+ was 0.10% (n = 10). Recoveries of spiked samples were 94.3% - 106.0%. The analytical frequency was 60 h–1. The effect of possible interferences has been studied. The procedure was successfully applied for analysis of environmental samples. The real samples results were comparable with those obtained by the of- ficial method considering a paired t-test and 95% of confidence level. Keywords: Hydralazine, Total Iron Determination, Spectrophotometry, Flow Injection Analysis 1. Introduction The iron element (Fe) is the fourth most abundant chemical specie of the planet and is present in nature in the following oxidation states: Fe2+ and Fe3+ [1]. Nowadays the determination of iron in some real sam- ples cannot be considered an analytical challenge but the introduction of alternative complexing agents for this purpose it is very attractive. Some analytical procedures already employed commercial drugs to determine iron, for example: the antibiotics chlortetracycline and nor- floxacin were used by Ruengsitagoon and Pojanagaroon respectively to quantify Fe3+ in real samples [1,2]. Using the same strategy, this work comes demonstrate the use of hydralazine hydrochloride for total iron determination in real samples. A list of some complexometric organic reagents not usual used for iron determination employing spectrophotometry is shown in Table 1. Hydralazine hydrochloride (Figure 1) is an antihyper- tensive drug that acts as a potent arteriolar dilator and Table 1. Some complexometric organic reagents not usual used for iron determination employing spectrophotometry. Organic Reagent Type of Iron λMAX (nm) Ref. DPQHa Fe2+ 504 [3] 1,10-Phenantroline Totalb 510 [4] Thioglycolic acid Fe3+ 535 [5] DPPHa Fe2+ and Fe3+c 535 [6] 5-Br-PSAAa Totalb 558 [7] Nitro-PAPSa Totalb 582 [8] Tirona Totald and Fe3+ 635 [9] DPKBHa Totalb 686 [10] DPFTHa Totalb 738 [11] TLCRa Fe2+ 741 [12] aSee list of acronyms in section 10 of this paper; bTotal iron expressed as Fe2+ after a reduction of Fe3+; cConversion of Fe3+ to Fe2+ with a reduction agent; dTotal iron expressed as Fe3+ after an oxidation of Fe2+. 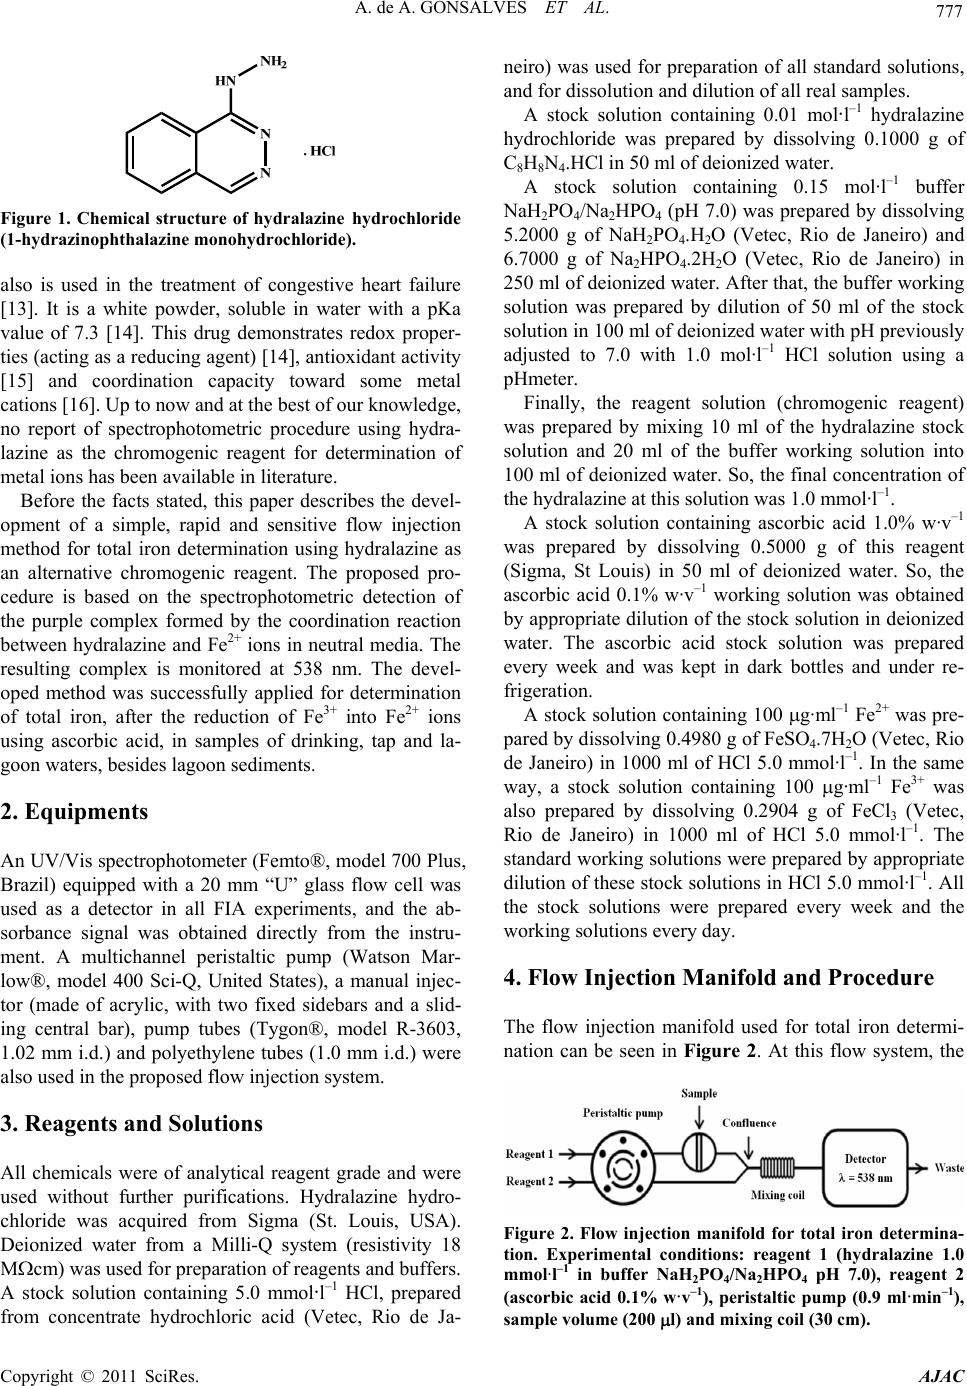 777 A. de A. GONSALVES ET AL. Figure 1. Chemical structure of hydralazine hydrochloride (1-hydrazinophthalazine monohy dr oc hloride ) . also is used in the treatment of congestive heart failure [13]. It is a white powder, soluble in water with a pKa value of 7.3 [14]. This drug demonstrates redox proper- ties (acting as a reducing agent) [14], antioxidant activity [15] and coordination capacity toward some metal cations [16]. Up to now and at the best of our knowledge, no report of spectrophotometric procedure using hydra- lazine as the chromogenic reagent for determination of metal ions has been available in literature. Before the facts stated, this paper describes the devel- opment of a simple, rapid and sensitive flow injection method for total iron determination using hydralazine as an alternative chromogenic reagent. The proposed pro- cedure is based on the spectrophotometric detection of the purple complex formed by the coordination reaction between hydralazine and Fe2+ ions in neutral media. The resulting complex is monitored at 538 nm. The devel- oped method was successfully applied for determination of total iron, after the reduction of Fe3+ into Fe2+ ions using ascorbic acid, in samples of drinking, tap and la- goon waters, besides lagoon sediments. 2. Equipments An UV/Vis spectrophotometer (Femto®, model 700 Plus, Brazil) equipped with a 20 mm “U” glass flow cell was used as a detector in all FIA experiments, and the ab- sorbance signal was obtained directly from the instru- ment. A multichannel peristaltic pump (Watson Mar- low®, model 400 Sci-Q, United States), a manual injec- tor (made of acrylic, with two fixed sidebars and a slid- ing central bar), pump tubes (Tygon®, model R-3603, 1.02 mm i.d.) and polyethylene tubes (1.0 mm i.d.) were also used in the proposed flow injection system. 3. Reagents and Solutions All chemicals were of analytical reagent grade and were used without further purifications. Hydralazine hydro- chloride was acquired from Sigma (St. Louis, USA). Deionized water from a Milli-Q system (resistivity 18 Mcm) was used for preparation of reagents and buffers. A stock solution containing 5.0 mmol·l–1 HCl, prepared from concentrate hydrochloric acid (Vetec, Rio de Ja- neiro) was used for preparation of all standard solutions, and for dissolution and dilution of all real samples. A stock solution containing 0.01 mol·l–1 hydralazine hydrochloride was prepared by dissolving 0.1000 g of C8H8N4.HCl in 50 ml of deionized water. A stock solution containing 0.15 mol·l–1 buffer NaH2PO4/Na2HPO4 (pH 7.0) was prepared by dissolving 5.2000 g of NaH2PO4.H2O (Vetec, Rio de Janeiro) and 6.7000 g of Na2HPO4.2H2O (Vetec, Rio de Janeiro) in 250 ml of deionized water. After that, the buffer working solution was prepared by dilution of 50 ml of the stock solution in 100 ml of deionized water with pH previously adjusted to 7.0 with 1.0 mol·l–1 HCl solution using a pHmeter. Finally, the reagent solution (chromogenic reagent) was prepared by mixing 10 ml of the hydralazine stock solution and 20 ml of the buffer working solution into 100 ml of deionized water. So, the final concentration of the hydralazine at this solution was 1.0 mmol·l–1. A stock solution containing ascorbic acid 1.0% w·v–1 was prepared by dissolving 0.5000 g of this reagent (Sigma, St Louis) in 50 ml of deionized water. So, the ascorbic acid 0.1% w·v–1 working solution was obtained by appropriate dilution of the stock solution in deionized water. The ascorbic acid stock solution was prepared every week and was kept in dark bottles and under re- frigeration. A stock solution containing 100 g·ml–1 Fe2+ was pre- pared by dissolving 0.4980 g of FeSO4.7H2O (Vetec, Rio de Janeiro) in 1000 ml of HCl 5.0 mmol·l–1. In the same way, a stock solution containing 100 g·ml–1 Fe3+ was also prepared by dissolving 0.2904 g of FeCl3 (Vetec, Rio de Janeiro) in 1000 ml of HCl 5.0 mmol·l–1. The standard working solutions were prepared by appropriate dilution of these stock solutions in HCl 5.0 mmol·l–1. All the stock solutions were prepared every week and the working solutions every day. 4. Flow Injection Manifold and Procedure The flow injection manifold used for total iron determi- nation can be seen in Figure 2. At this flow system, the Figure 2. Flow injection manifold for total iron determina- tion. Experimental conditions: reagent 1 (hydralazine 1.0 mmol·l–1 in buffer NaH2PO4/Na2HPO4 pH 7.0), reagent 2 (ascorbic acid 0.1% w·v–1), peristaltic pump (0.9 ml·min–1), sample volume (200 l) and mixing coil (30 cm). Copyright © 2011 SciRes. AJAC 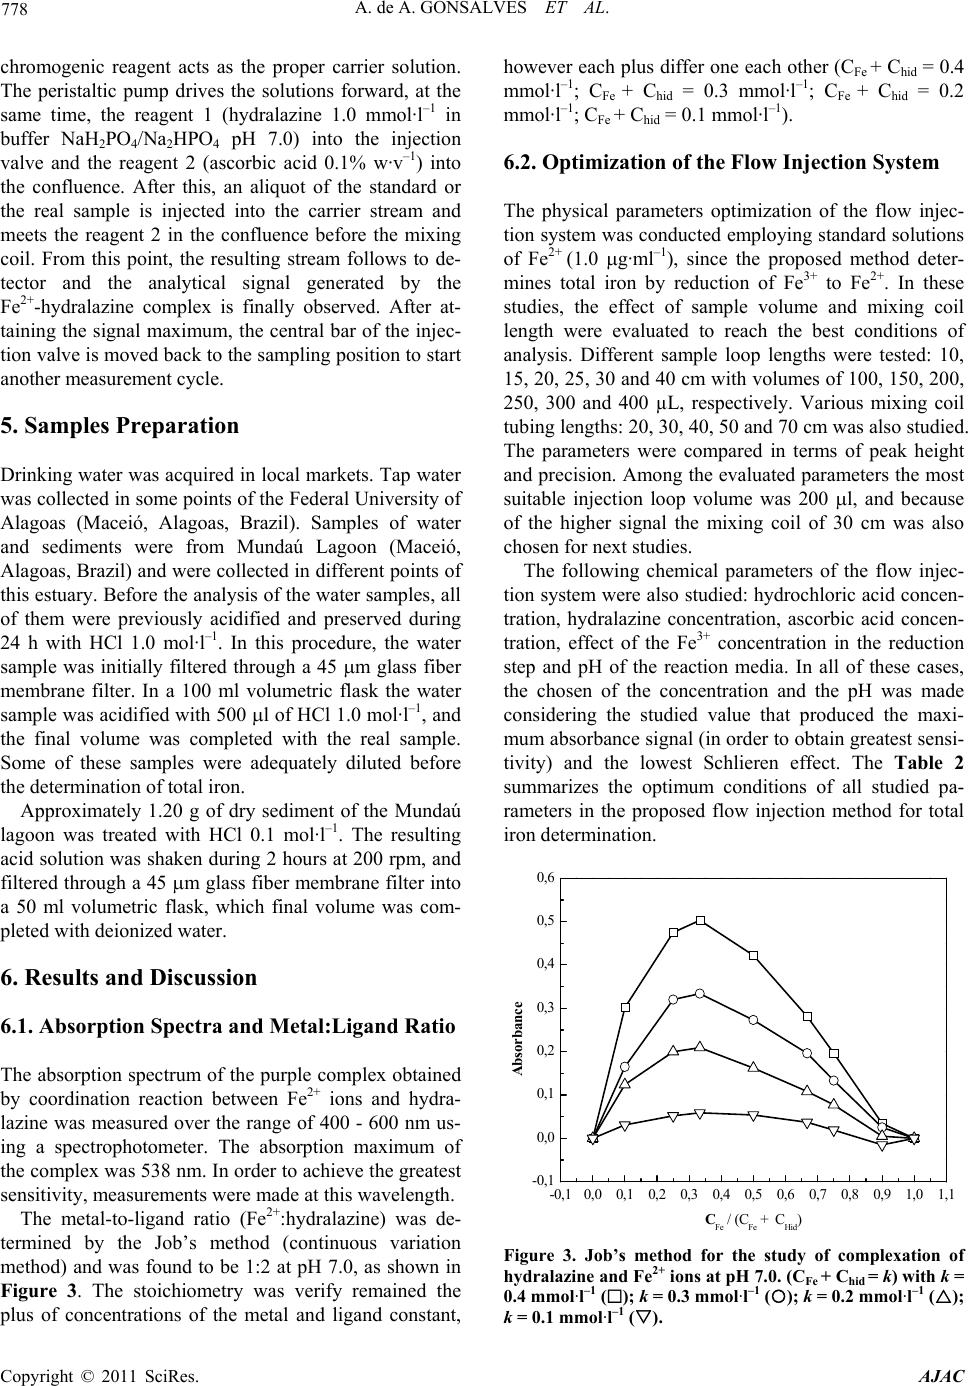 A. de A. GONSALVES ET AL. 778 chromogenic reagent acts as the proper carrier solution. The peristaltic pump drives the solutions forward, at the same time, the reagent 1 (hydralazine 1.0 mmol·l–1 in buffer NaH2PO4/Na2HPO4 pH 7.0) into the injection valve and the reagent 2 (ascorbic acid 0.1% w·v–1) into the confluence. After this, an aliquot of the standard or the real sample is injected into the carrier stream and meets the reagent 2 in the confluence before the mixing coil. From this point, the resulting stream follows to de- tector and the analytical signal generated by the Fe2+-hydralazine complex is finally observed. After at- taining the signal maximum, the central bar of the injec- tion valve is moved back to the sampling position to start another measurement cycle. 5. Samples Preparation Drinking water was acquired in local markets. Tap water was collected in some points of the Federal University of Alagoas (Maceió, Alagoas, Brazil). Samples of water and sediments were from Mundaú Lagoon (Maceió, Alagoas, Brazil) and were collected in different points of this estuary. Before the analysis of the water samples, all of them were previously acidified and preserved during 24 h with HCl 1.0 mol·l–1. In this procedure, the water sample was initially filtered through a 45 m glass fiber membrane filter. In a 100 ml volumetric flask the water sample was acidified with 500 l of HCl 1.0 mol·l–1, and the final volume was completed with the real sample. Some of these samples were adequately diluted before the determination of total iron. Approximately 1.20 g of dry sediment of the Mundaú lagoon was treated with HCl 0.1 mol·l–1. The resulting acid solution was shaken during 2 hours at 200 rpm, and filtered through a 45 m glass fiber membrane filter into a 50 ml volumetric flask, which final volume was com- pleted with deionized water. 6. Results and Discussion 6.1. Absorption Spectra and Metal:Ligand Ratio The absorption spectrum of the purple complex obtained by coordination reaction between Fe2+ ions and hydra- lazine was measured over the range of 400 - 600 nm us- ing a spectrophotometer. The absorption maximum of the complex was 538 nm. In order to achieve the greatest sensitivity, measurements were made at this wavelength. The metal-to-ligand ratio (Fe2+:hydralazine) was de- termined by the Job’s method (continuous variation method) and was found to be 1:2 at pH 7.0, as shown in Figure 3. The stoichiometry was verify remained the plus of concentrations of the metal and ligand constant, however each plus differ one each other (CFe + Chid = 0.4 mmol·l–1; CFe + Chid = 0.3 mmol·l–1; CFe + Chid = 0.2 mmol·l–1; CFe + Chid = 0.1 mmol·l–1). 6.2. Optimization of the Flow Injection System The physical parameters optimization of the flow injec- tion system was conducted employing standard solutions of Fe2+ (1.0 g·ml–1), since the proposed method deter- mines total iron by reduction of Fe3+ to Fe2+. In these studies, the effect of sample volume and mixing coil length were evaluated to reach the best conditions of analysis. Different sample loop lengths were tested: 10, 15, 20, 25, 30 and 40 cm with volumes of 100, 150, 200, 250, 300 and 400 µL, respectively. Various mixing coil tubing lengths: 20, 30, 40, 50 and 70 cm was also studied. The parameters were compared in terms of peak height and precision. Among the evaluated parameters the most suitable injection loop volume was 200 l, and because of the higher signal the mixing coil of 30 cm was also chosen for next studies. The following chemical parameters of the flow injec- tion system were also studied: hydrochloric acid concen- tration, hydralazine concentration, ascorbic acid concen- tration, effect of the Fe3+ concentration in the reduction step and pH of the reaction media. In all of these cases, the chosen of the concentration and the pH was made considering the studied value that produced the maxi- mum absorbance signal (in order to obtain greatest sensi- tivity) and the lowest Schlieren effect. The Table 2 summarizes the optimum conditions of all studied pa- rameters in the proposed flow injection method for total iron determination. -0,10,0 0,1 0,2 0,3 0,4 0,5 0,6 0,7 0,8 0,9 1,0 1,1 -0,1 0,0 0,1 0,2 0,3 0,4 0,5 0,6 Absorbance CFe / (CFe + CHid) Figure 3. Job’s method for the study of complexation of hydralazine and Fe2+ ions at pH 7.0. (CFe + Chid = k) wi t h k = 0.4 mmol·l–1 (); k = 0.3 mmol·l–1 (); k = 0.2 mmol·l–1 (); k = 0.1 mmol·l–1 (). Copyright © 2011 SciRes. AJAC 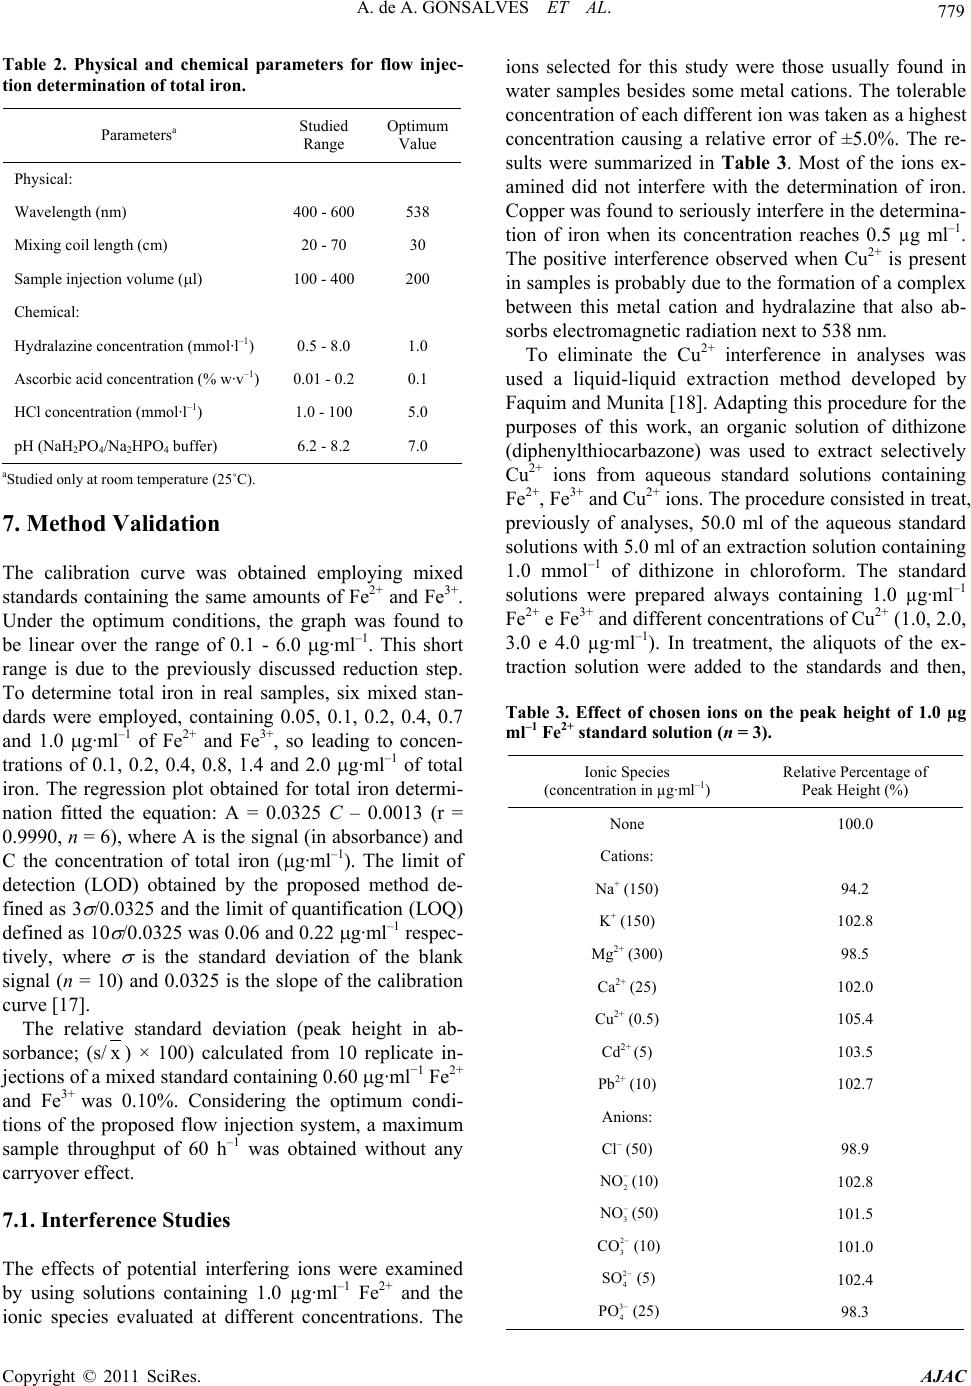 779 A. de A. GONSALVES ET AL. Table 2. Physical and chemical parameters for flow injec- tion determination of total iron. Parametersa Studied Range Optimum Value Physical: Wavelength (nm) 400 - 600 538 Mixing coil length (cm) 20 - 70 30 Sample injection volume (l) 100 - 400 200 Chemical: Hydralazine concentration (mmol·l–1) 0.5 - 8.0 1.0 Ascorbic acid concentration (% w·v–1) 0.01 - 0.2 0.1 HCl concentration (mmol·l–1) 1.0 - 100 5.0 pH (NaH2PO4/Na2HPO4 buffer) 6.2 - 8.2 7.0 aStudied only at room temperature (25˚C). 7. Method Validation The calibration curve was obtained employing mixed standards containing the same amounts of Fe2+ and Fe3+. Under the optimum conditions, the graph was found to be linear over the range of 0.1 - 6.0 g·ml–1. This short range is due to the previously discussed reduction step. To determine total iron in real samples, six mixed stan- dards were employed, containing 0.05, 0.1, 0.2, 0.4, 0.7 and 1.0 g·ml–1 of Fe2+ and Fe3+, so leading to concen- trations of 0.1, 0.2, 0.4, 0.8, 1.4 and 2.0 g·ml–1 of total iron. The regression plot obtained for total iron determi- nation fitted the equation: A = 0.0325 C – 0.0013 (r = 0.9990, n = 6), where A is the signal (in absorbance) and C the concentration of total iron (g·ml–1). The limit of detection (LOD) obtained by the proposed method de- fined as 3 /0.0325 and the limit of quantification (LOQ) defined as 10 /0.0325 was 0.06 and 0.22 g·ml–1 respec- tively, where is the standard deviation of the blank signal (n = 10) and 0.0325 is the slope of the calibration curve [17]. The relative standard deviation (peak height in ab- sorbance; (s/x) × 100) calculated from 10 replicate in- jections of a mixed standard containing 0.60 g·ml−1 Fe2+ and Fe3+ was 0.10%. Considering the optimum condi- tions of the proposed flow injection system, a maximum sample throughput of 60 h–1 was obtained without any carryover effect. 7.1. Interference Studies The effects of potential interfering ions were examined by using solutions containing 1.0 µg·ml–1 Fe2+ and the ionic species evaluated at different concentrations. The ions selected for this study were those usually found in water samples besides some metal cations. The tolerable concentration of each different ion was taken as a highest concentration causing a relative error of ±5.0%. The re- sults were summarized in Table 3. Most of the ions ex- amined did not interfere with the determination of iron. Copper was found to seriously interfere in the determina- tion of iron when its concentration reaches 0.5 µg ml–1. The positive interference observed when Cu2+ is present in samples is probably due to the formation of a complex between this metal cation and hydralazine that also ab- sorbs electromagnetic radiation next to 538 nm. To eliminate the Cu2+ interference in analyses was used a liquid-liquid extraction method developed by Faquim and Munita [18]. Adapting this procedure for the purposes of this work, an organic solution of dithizone (diphenylthiocarbazone) was used to extract selectively Cu2+ ions from aqueous standard solutions containing Fe2+, Fe3+ and Cu2+ ions. The procedure consisted in treat, previously of analyses, 50.0 ml of the aqueous standard solutions with 5.0 ml of an extraction solution containing 1.0 mmol–1 of dithizone in chloroform. The standard solutions were prepared always containing 1.0 µg·ml–1 Fe2+ e Fe3+ and different concentrations of Cu2+ (1.0, 2.0, 3.0 e 4.0 µg·ml–1). In treatment, the aliquots of the ex- traction solution were added to the standards and then, Table 3. Effect of chosen ions on the peak height of 1.0 µg ml–1 Fe2+ standard solution (n = 3). Ionic Species (concentration in µg·ml–1) Relative Percentage of Peak Height (%) None 100.0 Cations: Na+ (150) 94.2 K+ (150) 102.8 Mg2+ (300) 98.5 Ca2+ (25) 102.0 Cu2+ (0.5) 105.4 Cd2+ (5) 103.5 Pb2+ (10) 102.7 Anions: Cl– (50) 98.9 2 NO (10) 102.8 3 NO (50) 101.5 2 3 CO (10) 101.0 2 4 SO (5) 102.4 3 4 PO (25) 98.3 Copyright © 2011 SciRes. AJAC 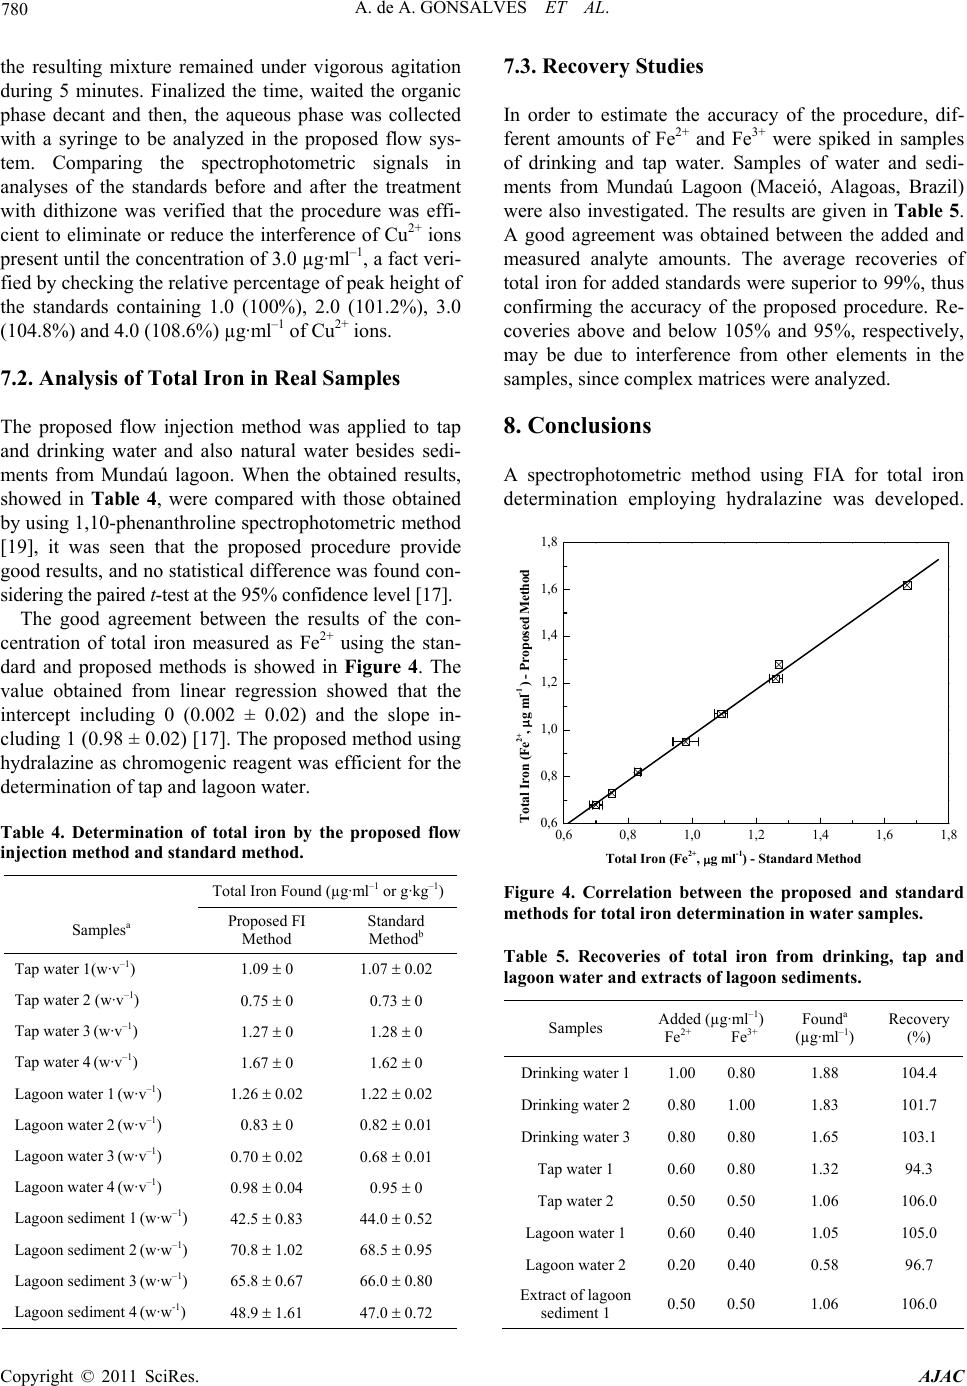 A. de A. GONSALVES ET AL. 780 the resulting mixture remained under vigorous agitation during 5 minutes. Finalized the time, waited the organic phase decant and then, the aqueous phase was collected with a syringe to be analyzed in the proposed flow sys- tem. Comparing the spectrophotometric signals in analyses of the standards before and after the treatment with dithizone was verified that the procedure was effi- cient to eliminate or reduce the interference of Cu2+ ions present until the concentration of 3.0 µg·ml–1, a fact veri- fied by checking the relative percentage of peak height of the standards containing 1.0 (100%), 2.0 (101.2%), 3.0 (104.8%) and 4.0 (108.6%) µg·ml–1 of Cu2+ ions. 7.2. Analysis of Total Iron in Real Samples The proposed flow injection method was applied to tap and drinking water and also natural water besides sedi- ments from Mundaú lagoon. When the obtained results, showed in Table 4, were compared with those obtained by using 1,10-phenanthroline spectrophotometric method [19], it was seen that the proposed procedure provide good results, and no statistical difference was found con- sidering the paired t-test at the 95% confidence level [17]. The good agreement between the results of the con- centration of total iron measured as Fe2+ using the stan- dard and proposed methods is showed in Figure 4. The value obtained from linear regression showed that the intercept including 0 (0.002 ± 0.02) and the slope in- cluding 1 (0.98 ± 0.02) [17]. The proposed method using hydralazine as chromogenic reagent was efficient for the determination of tap and lagoon water. Table 4. Determination of total iron by the proposed flow injection method and standard me thod. Total Iron Found (µg·ml–1 or g·kg–1) Samplesa Proposed FI Method Standard Methodb Tap water 1(w·v–1) 1.09 0 1.07 0.02 Tap water 2 (w·v–1) 0.75 0 0.73 0 Tap water 3 (w·v–1) 1.27 0 1.28 0 Tap water 4 (w·v–1) 1.67 0 1.62 0 Lagoon water 1 (w·v–1) 1.26 0.02 1.22 0.02 Lagoon water 2 (w·v–1) 0.83 0 0.82 0.01 Lagoon water 3 (w·v–1) 0.70 0.02 0.68 0.01 Lagoon water 4 (w·v–1) 0.98 0.04 0.95 0 Lagoon sediment 1 (w·w–1) 42.5 0.83 44.0 0.52 Lagoon sediment 2 (w·w–1) 70.8 1.02 68.5 0.95 Lagoon sediment 3 (w·w–1) 65.8 0.67 66.0 0.80 Lagoon sediment 4 (w·w-1) 48.9 1.61 47.0 0.72 7.3. Recovery Studies In order to estimate the accuracy of the procedure, dif- ferent amounts of Fe2+ and Fe3+ were spiked in samples of drinking and tap water. Samples of water and sedi- ments from Mundaú Lagoon (Maceió, Alagoas, Brazil) were also investigated. The results are given in Table 5. A good agreement was obtained between the added and measured analyte amounts. The average recoveries of total iron for added standards were superior to 99%, thus confirming the accuracy of the proposed procedure. Re- coveries above and below 105% and 95%, respectively, may be due to interference from other elements in the samples, since complex matrices were analyzed. 8. Conclusions A spectrophotometric method using FIA for total iron determination employing hydralazine was developed. 0,6 0,8 1,01,2 1,4 1,6 1,8 0,6 0,8 1,0 1,2 1,4 1,6 1,8 Total Iron (Fe2+, g ml-1) - Standard Method Total Iron (Fe2+, g ml-1 ) - Proposed Method Figure 4. Correlation between the proposed and standard methods for total iron determination in water samples. Table 5. Recoveries of total iron from drinking, tap and lagoon water and extracts of lagoon sediments. Samples Added (µg·ml–1) Fe2+ Fe 3+ Founda (µg·ml–1) Recovery (%) Drinking water 1 1.00 0.80 1.88 104.4 Drinking water 2 0.80 1.00 1.83 101.7 Drinking water 3 0.80 0.80 1.65 103.1 Tap water 1 0.60 0.80 1.32 94.3 Tap water 2 0.50 0.50 1.06 106.0 Lagoon water 1 0.60 0.40 1.05 105.0 Lagoon water 2 0.20 0.40 0.58 96.7 Extract of lagoon sediment 1 0.50 0.50 1.06 106.0 Copyright © 2011 SciRes. AJAC 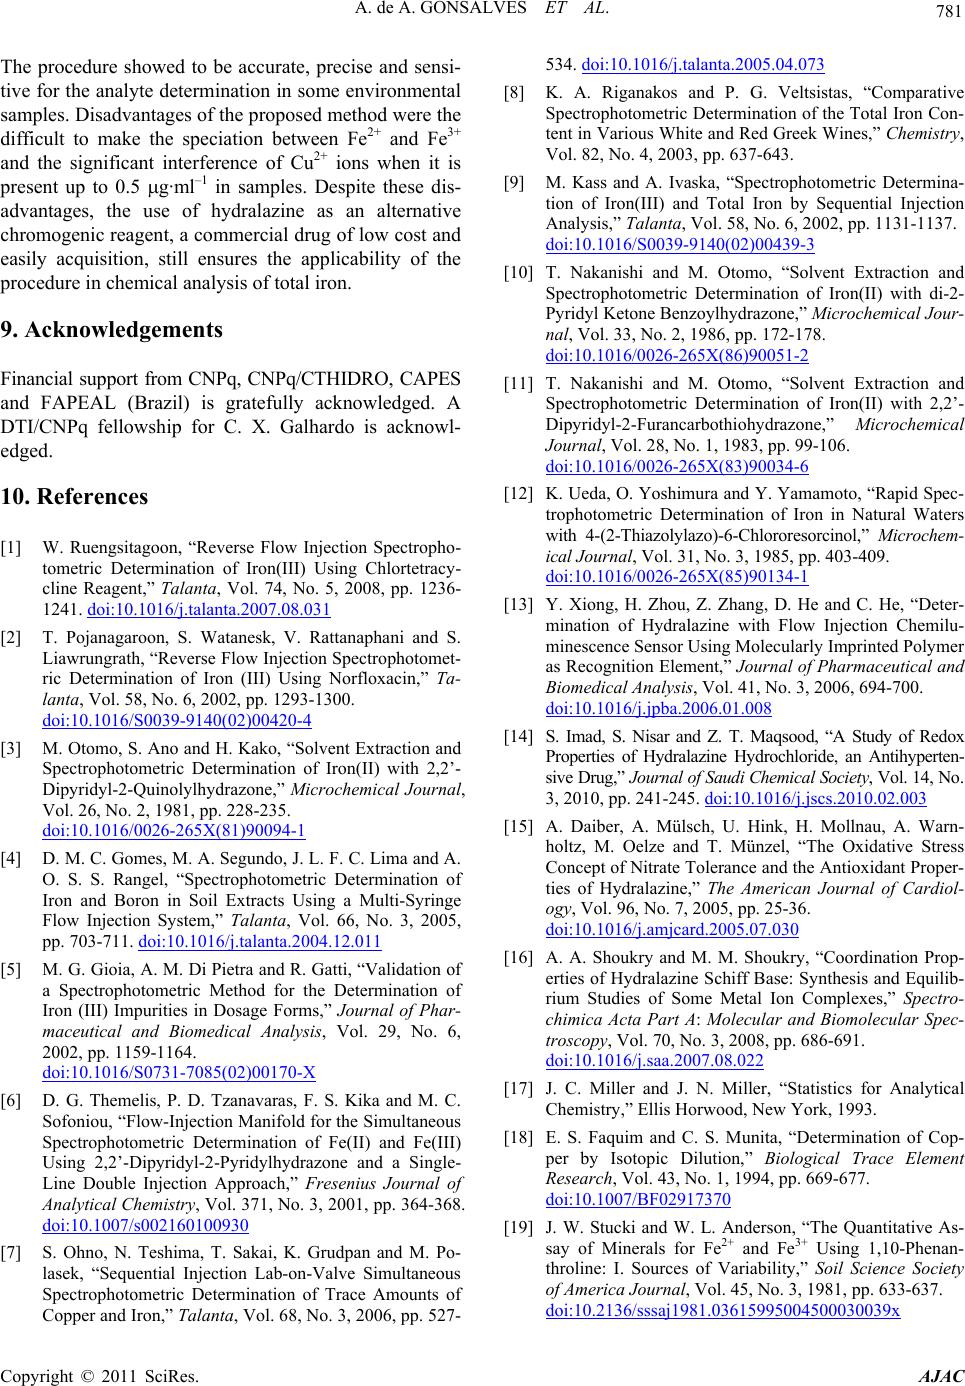 781 A. de A. GONSALVES ET AL. The procedure showed to be accurate, precise and sensi- tive for the analyte determination in some environmental samples. Disadvantages of the proposed method were the difficult to make the speciation between Fe2+ and Fe3+ and the significant interference of Cu2+ ions when it is present up to 0.5 g·ml–1 in samples. Despite these dis- advantages, the use of hydralazine as an alternative chromogenic reagent, a commercial drug of low cost and easily acquisition, still ensures the applicability of the procedure in chemical analysis of total iron. 9. Acknowledgements Financial support from CNPq, CNPq/CTHIDRO, CAPES and FAPEAL (Brazil) is gratefully acknowledged. A DTI/CNPq fellowship for C. X. Galhardo is acknowl- edged. 10. References [1] W. Ruengsitagoon, “Reverse Flow Injection Spectropho- tometric Determination of Iron(III) Using Chlortetracy- cline Reagent,” Talanta, Vol. 74, No. 5, 2008, pp. 1236- 1241. doi:10.1016/j.talanta.2007.08.031 [2] T. Pojanagaroon, S. Watanesk, V. Rattanaphani and S. Liawrungrath, “Reverse Flow Injection Spectrophotomet- ric Determination of Iron (III) Using Norfloxacin,” Ta- lanta, Vol. 58, No. 6, 2002, pp. 1293-1300. doi:10.1016/S0039-9140(02)00420-4 [3] M. Otomo, S. Ano and H. Kako, “Solvent Extraction and Spectrophotometric Determination of Iron(II) with 2,2’- Dipyridyl-2-Quinolylhydrazone,” Microchemical Journal, Vol. 26, No. 2, 1981, pp. 228-235. doi:10.1016/0026-265X(81)90094-1 [4] D. M. C. Gomes, M. A. Segundo, J. L. F. C. Lima and A. O. S. S. Rangel, “Spectrophotometric Determination of Iron and Boron in Soil Extracts Using a Multi-Syringe Flow Injection System,” Talanta, Vol. 66, No. 3, 2005, pp. 703-711. doi:10.1016/j.talanta.2004.12.011 [5] M. G. Gioia, A. M. Di Pietra and R. Gatti, “Validation of a Spectrophotometric Method for the Determination of Iron (III) Impurities in Dosage Forms,” Journal of Phar- maceutical and Biomedical Analysis, Vol. 29, No. 6, 2002, pp. 1159-1164. doi:10.1016/S0731-7085(02)00170-X [6] D. G. Themelis, P. D. Tzanavaras, F. S. Kika and M. C. Sofoniou, “Flow-Injection Manifold for the Simultaneous Spectrophotometric Determination of Fe(II) and Fe(III) Using 2,2’-Dipyridyl-2-Pyridylhydrazone and a Single- Line Double Injection Approach,” Fresenius Journal of Analytical Chemistry, Vol. 371, No. 3, 2001, pp. 364-368. doi:10.1007/s002160100930 [7] S. Ohno, N. Teshima, T. Sakai, K. Grudpan and M. Po- lasek, “Sequential Injection Lab-on-Valve Simultaneous Spectrophotometric Determination of Trace Amounts of Copper and Iron,” Talanta, Vol. 68, No. 3, 2006, pp. 527- 534. doi:10.1016/j.talanta.2005.04.073 [8] K. A. Riganakos and P. G. Veltsistas, “Comparative Spectrophotometric Determination of the Total Iron Con- tent in Various White and Red Greek Wines,” Chemistry, Vol. 82, No. 4, 2003, pp. 637-643. [9] M. Kass and A. Ivaska, “Spectrophotometric Determina- tion of Iron(III) and Total Iron by Sequential Injection Analysis,” Talanta, Vol. 58, No. 6, 2002, pp. 1131-1137. doi:10.1016/S0039-9140(02)00439-3 [10] T. Nakanishi and M. Otomo, “Solvent Extraction and Spectrophotometric Determination of Iron(II) with di-2- Pyridyl Ketone Benzoylhydrazone,” Microchemical Jour- nal, Vol. 33, No. 2, 1986, pp. 172-178. doi:10.1016/0026-265X(86)90051-2 [11] T. Nakanishi and M. Otomo, “Solvent Extraction and Spectrophotometric Determination of Iron(II) with 2,2’- Dipyridyl-2-Furancarbothiohydrazone,” Microchemical Journal, Vol. 28, No. 1, 1983, pp. 99-106. doi:10.1016/0026-265X(83)90034-6 [12] K. Ueda, O. Yoshimura and Y. Yamamoto, “Rapid Spec- trophotometric Determination of Iron in Natural Waters with 4-(2-Thiazolylazo)-6-Chlororesorcinol,” Microchem- ical Journal, Vol. 31, No. 3, 1985, pp. 403-409. doi:10.1016/0026-265X(85)90134-1 [13] Y. Xiong, H. Zhou, Z. Zhang, D. He and C. He, “Deter- mination of Hydralazine with Flow Injection Chemilu- minescence Sensor Using Molecularly Imprinted Polymer as Recognition Element,” Journal of Pharmaceutical and Biomedical Analysis, Vol. 41, No. 3, 2006, 694-700. doi:10.1016/j.jpba.2006.01.008 [14] S. Imad, S. Nisar and Z. T. Maqsood, “A Study of Redox Properties of Hydralazine Hydrochloride, an Antihyperten- sive Drug,” Journal of Saudi Chemical Society, Vol. 14, No. 3, 2010, pp. 241-245. doi:10.1016/j.jscs.2010.02.003 [15] A. Daiber, A. Mülsch, U. Hink, H. Mollnau, A. Warn- holtz, M. Oelze and T. Münzel, “The Oxidative Stress Concept of Nitrate Tolerance and the Antioxidant Proper- ties of Hydralazine,” The American Journal of Cardiol- ogy, Vol. 96, No. 7, 2005, pp. 25-36. doi:10.1016/j.amjcard.2005.07.030 [16] A. A. Shoukry and M. M. Shoukry, “Coordination Prop- erties of Hydralazine Schiff Base: Synthesis and Equilib- rium Studies of Some Metal Ion Complexes,” Spectro- chimica Acta Part A: Molecular and Biomolecular Spec- troscopy, Vol. 70, No. 3, 2008, pp. 686-691. doi:10.1016/j.saa.2007.08.022 [17] J. C. Miller and J. N. Miller, “Statistics for Analytical Chemistry,” Ellis Horwood, New York, 1993. [18] E. S. Faquim and C. S. Munita, “Determination of Cop- per by Isotopic Dilution,” Biological Trace Element Research, Vol. 43, No. 1, 1994, pp. 669-677. doi:10.1007/BF02917370 [19] J. W. Stucki and W. L. Anderson, “The Quantitative As- say of Minerals for Fe2+ and Fe3+ Using 1,10-Phenan- throline: I. Sources of Variability,” Soil Science Society of America Journal, Vol. 45, No. 3, 1981, pp. 633-637. doi:10.2136/sssaj1981.03615995004500030039x Copyright © 2011 SciRes. AJAC 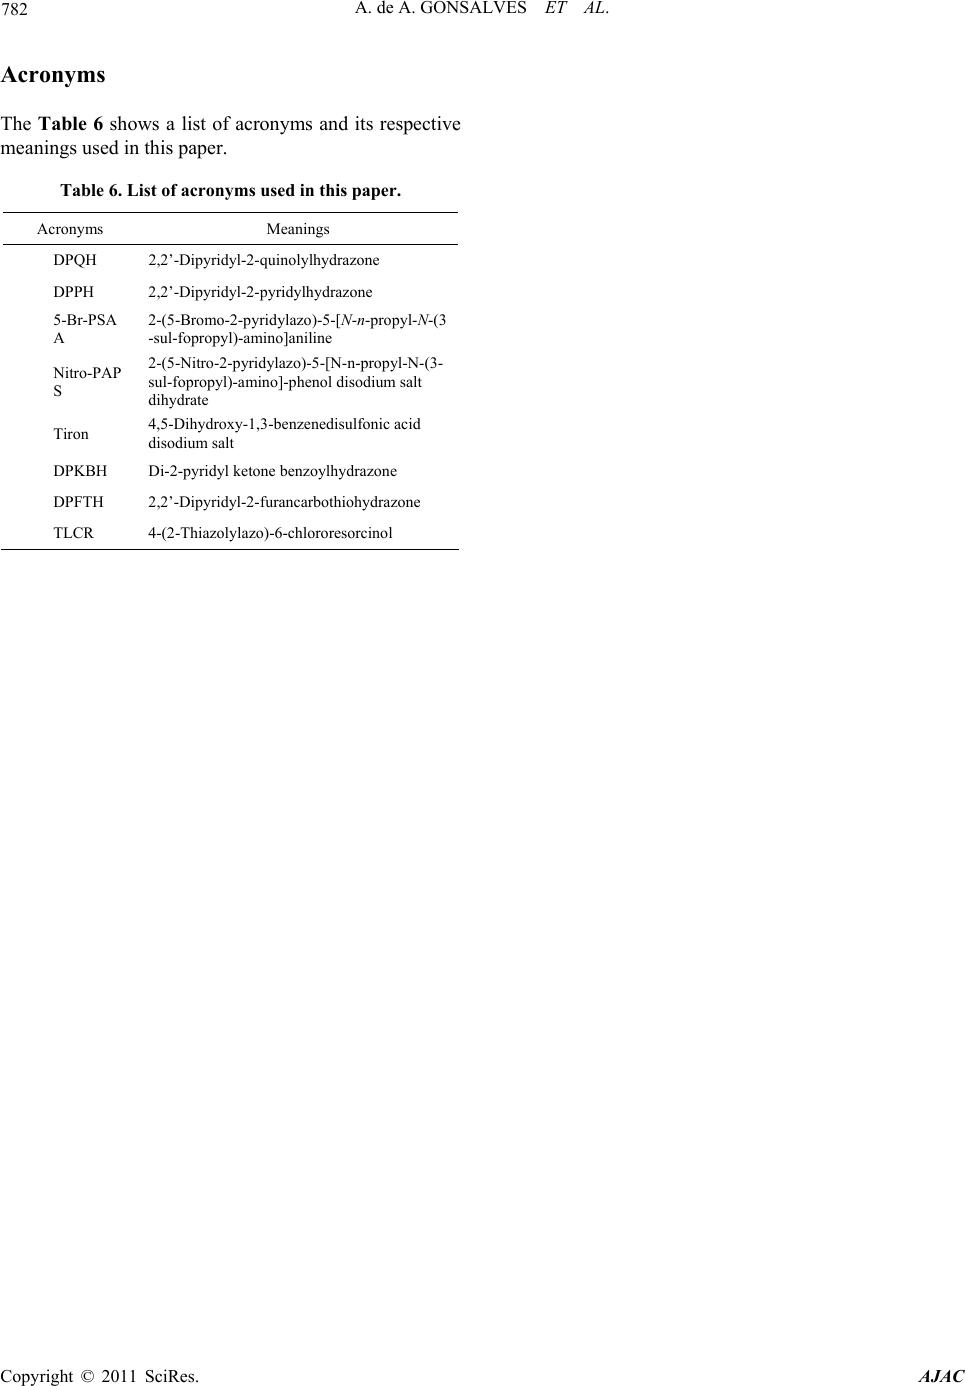 A. de A. GONSALVES ET AL. Copyright © 2011 SciRes. AJAC 782 Acronyms The Table 6 shows a list of acronyms and its respective meanings used in this paper. Table 6. List of acronyms used in this paper. Acronyms Meanings DPQH 2,2’-Dipyridyl-2-quinolylhydrazone DPPH 2,2’-Dipyridyl-2-pyridylhydrazone 5-Br-PSA A 2-(5-Bromo-2-p yri d ylazo)-5 -[N-n-propyl-N-(3 -sul-fopropyl)-amino]aniline Nitro-PAP S 2-(5-Nitro-2-pyridylazo)-5-[N-n-propyl-N-(3- sul-fopropyl)-amino]-phenol disodium salt dihydrate Tiron 4,5-Dihydroxy-1,3-benzenedisulfonic acid disodium salt DPKBH Di-2-pyridyl ketone benzoylhydrazone DPFTH 2,2’-Dipyridyl-2-furancarbothiohydrazone TLCR 4-(2-Thiazolylazo)-6-chlororesorcinol |