

Paper Menu >>
Journal Menu >>
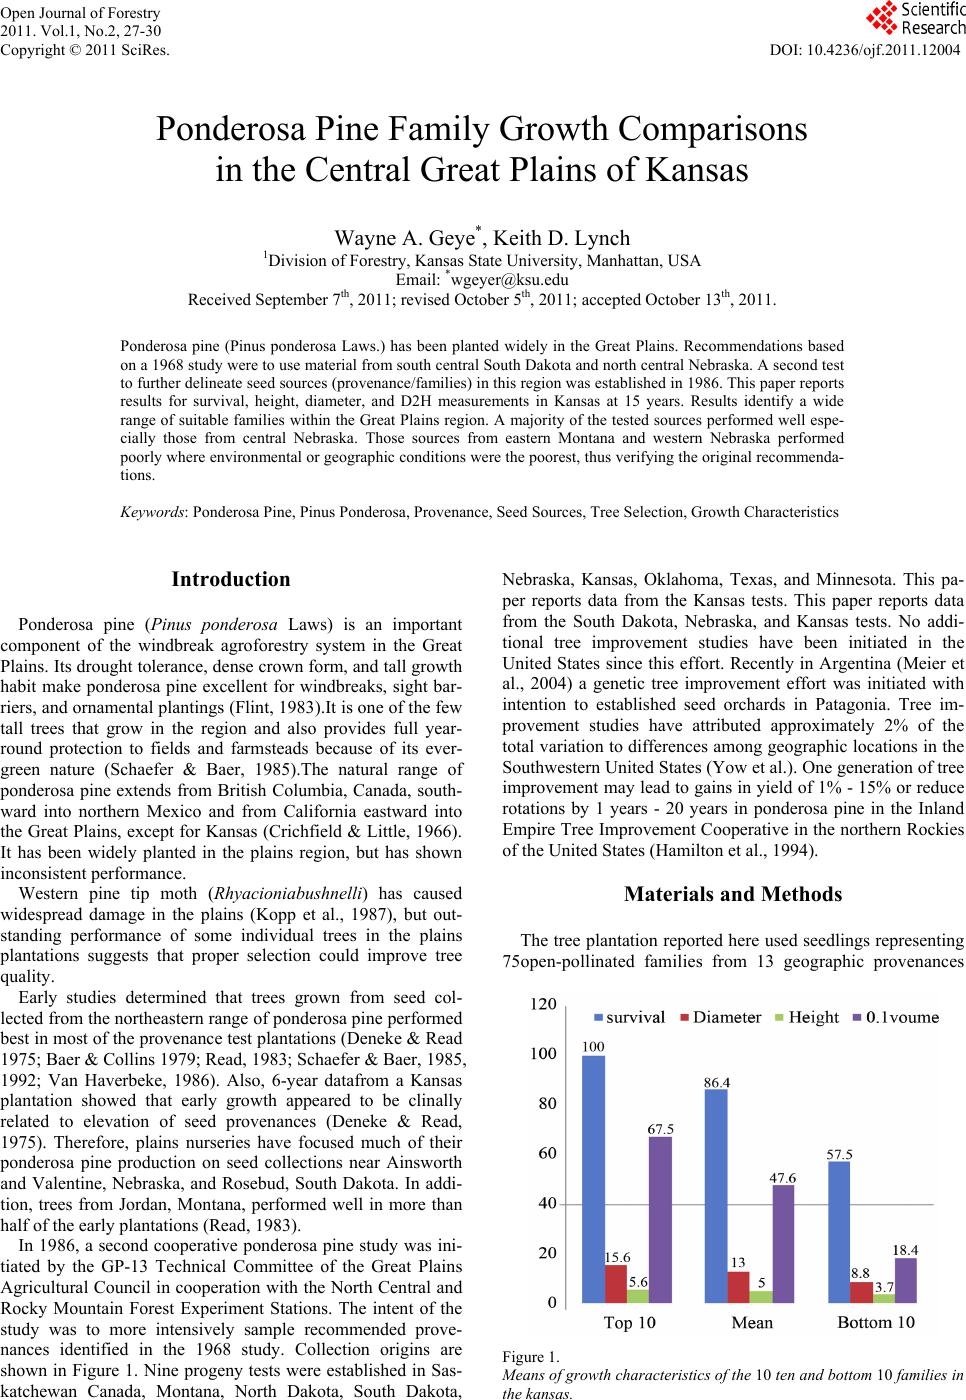 Open Journal of Forestry 2011. Vol.1, No.2, 27-30 Copyright © 2011 SciRes. DOI: 10.4236/ojf.2011.12004 Ponderosa Pine Family Growth Comparisons in the Central Great Plains of Kansas Wayne A. Geye*, Keith D. Lynch 1Division of Forestry, Kansas State University, Manhattan, USA Email: *[email protected] Received September 7th, 2011; revised October 5th, 2011; accepted October 13th, 2011. Ponderosa pine (Pinus ponderosa Laws.) has been planted widely in the Great Plains. Recommendations based on a 1968 study were to use material from south central South Dakota and north central Nebraska. A second test to further delineate seed sources (provenance/families) in this region was established in 1986. This paper reports results for survival, height, diameter, and D2H measurements in Kansas at 15 years. Results identify a wide range of suitable families within the Great Plains region. A majority of the tested sources performed well espe- cially those from central Nebraska. Those sources from eastern Montana and western Nebraska performed poorly where environmental or geographic conditions were the poorest, thus verifying the original recommenda- tions. Keywords: Ponderosa Pine, Pinus Pon de rosa, Provenance, Seed Sources, Tree Selectio n, Growth Characteristics Introduction Ponderosa pine (Pinus ponderosa Laws) is an important component of the windbreak agroforestry system in the Great Plains. Its drought tolerance, dense crown form, and tall growth habit make ponderosa pine excellent for windbreaks, sight bar- riers, and ornamental plantings (Flint, 1983).It is one of the few tall trees that grow in the region and also provides full year- round protection to fields and farmsteads because of its ever- green nature (Schaefer & Baer, 1985).The natural range of ponderosa pine extends from British Columbia, Canada, south- ward into northern Mexico and from California eastward into the Great Plains, except for Kansas (Crichfield & Little, 1966). It has been widely planted in the plains region, but has shown inconsistent performance. Western pine tip moth (Rhyacioniabushnelli) has caused widespread damage in the plains (Kopp et al., 1987), but out- standing performance of some individual trees in the plains plantations suggests that proper selection could improve tree quality. Early studies determined that trees grown from seed col- lected from the northeastern range of ponderosa pine performed best in most of the provenance test plantations (Deneke & Read 1975; Baer & Collins 1979; Read, 1983; Schaefer & Baer, 1985, 1992; Van Haverbeke, 1986). Also, 6-year datafrom a Kansas plantation showed that early growth appeared to be clinally related to elevation of seed provenances (Deneke & Read, 1975). Therefore, plains nurseries have focused much of their ponderosa pine production on seed collections near Ainsworth and Valentine, Nebraska, and Rosebud, South Dakota. In addi- tion, trees from Jordan, Montana, performed well in more than half of the early plantations (Read, 1983). In 1986, a second cooperative ponderosa pine study was ini- tiated by the GP-13 Technical Committee of the Great Plains Agricultural Council in cooperation with the North Central and Rocky Mountain Forest Experiment Stations. The intent of the study was to more intensively sample recommended prove- nances identified in the 1968 study. Collection origins are shown in Figure 1. Nine progeny tests were established in Sas- katchewan Canada, Montana, North Dakota, South Dakota, Nebraska, Kansas, Oklahoma, Texas, and Minnesota. This pa- per reports data from the Kansas tests. This paper reports data from the South Dakota, Nebraska, and Kansas tests. No addi- tional tree improvement studies have been initiated in the United States since this effort. Recently in Argentina (Meier et al., 2004) a genetic tree improvement effort was initiated with intention to established seed orchards in Patagonia. Tree im- provement studies have attributed approximately 2% of the total variation to differences among geographic locations in the Southwestern United States (Yow et al.). One generation of tree improvement may lead to gains in yield of 1% - 15% or reduce rotations by 1 years - 20 years in ponderosa pine in the Inland Empire Tree Improvement Cooperative in the northern Rockies of the United States (Hamilton et al., 1994). Materials and Methods The tree plantation reported here used seedlings representing 75open-pollinated families from 13 geographic provenances Figure 1. Means of growth characteristics of the 10 ten and bottom 10 families in the kansas. 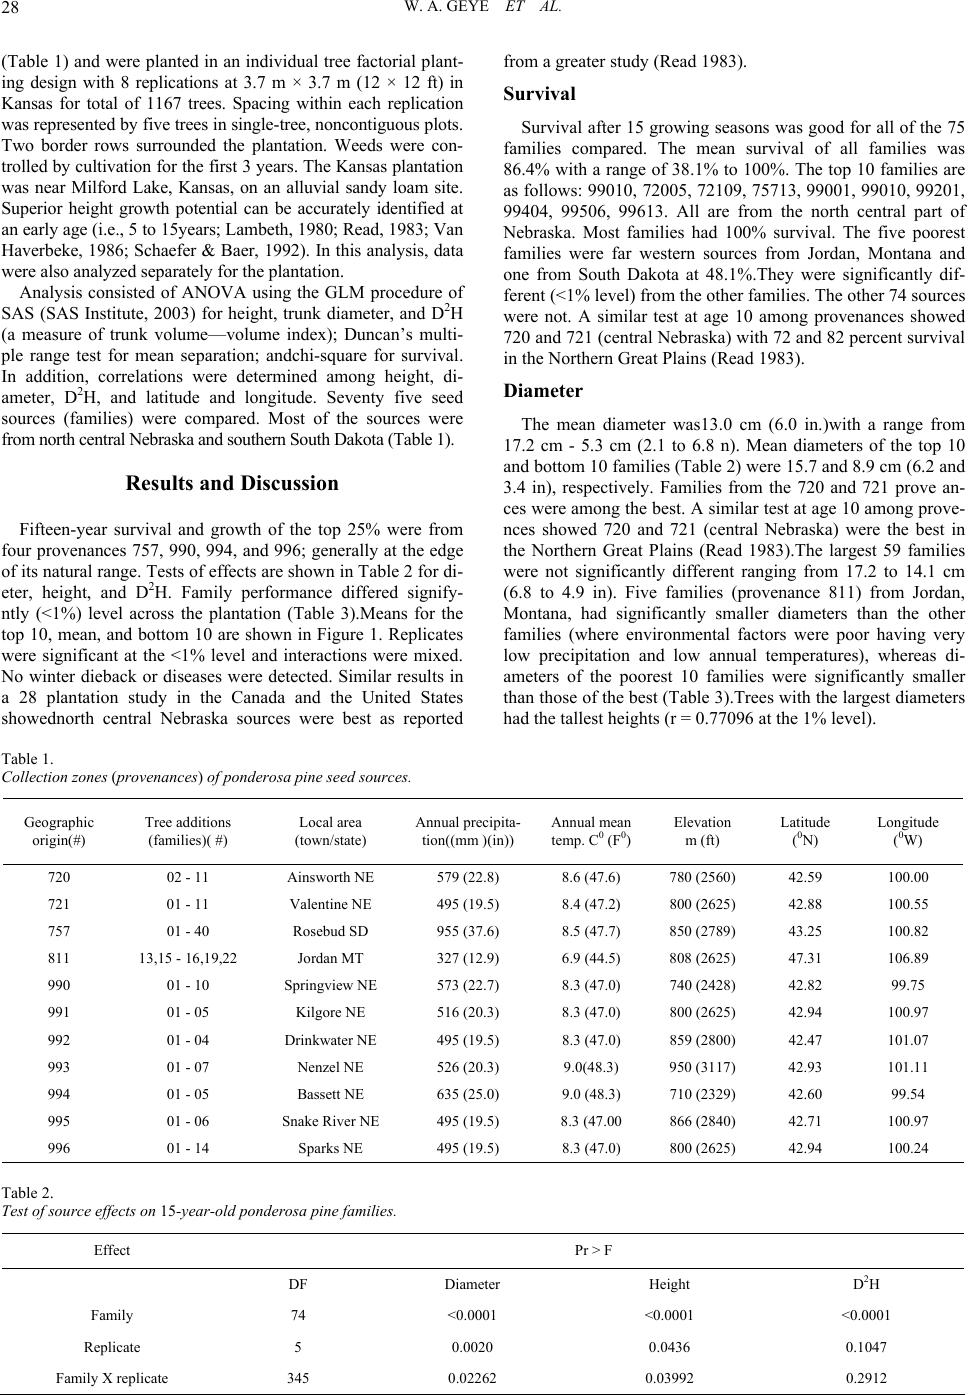 W. A. GEYE ET AL. 28 (Table 1) and were planted in an individual tree factorial plant- ing design with 8 replications at 3.7 m × 3.7 m (12 × 12 ft) in Kansas for total of 1167 trees. Spacing within each replication was represented by five trees in single-tree, noncontiguous plots. Two border rows surrounded the plantation. Weeds were con- trolled by cultivation for the first 3 years. The Kansas plantation was near Milford Lake, Kansas, on an alluvial sandy loam site. Superior height growth potential can be accurately identified at an early age (i.e., 5 to 15years; Lambeth, 1980; Read, 1983; Van Haverbeke, 1986; Schaefer & Baer, 1992). In this analysis, data were also analyzed separatel y for the plantation. Analysis consisted of ANOVA using the GLM procedure of SAS (SAS Institute, 2003) for height, trunk diameter, and D2H (a measure of trunk volume—volume index); Duncan’s multi- ple range test for mean separation; andchi-square for survival. In addition, correlations were determined among height, di- ameter, D2H, and latitude and longitude. Seventy five seed sources (families) were compared. Most of the sources were from north central Nebraska and southern South Dakota (Table 1). Results and Discussion Fifteen-year survival and growth of the top 25% were from four provenances 757, 990, 994, and 996; generally at the edge of its natural range. Tests of effects are shown in Table 2 for di- eter, height, and D2H. Family performance differed signify- ntly (<1%) level across the plantation (Table 3).Means for the top 10, mean, and bottom 10 are shown in Figure 1. Replicates were significant at the <1% level and interactions were mixed. No winter dieback or diseases were detected. Similar results in a 28 plantation study in the Canada and the United States showednorth central Nebraska sources were best as reported from a greater study (Read 1983). Survival Survival after 15 growing seasons was good for all of the 75 families compared. The mean survival of all families was 86.4% with a range of 38.1% to 100%. The top 10 families are as follows: 99010, 72005, 72109, 75713, 99001, 99010, 99201, 99404, 99506, 99613. All are from the north central part of Nebraska. Most families had 100% survival. The five poorest families were far western sources from Jordan, Montana and one from South Dakota at 48.1%.They were significantly dif- ferent (<1% level) from the other families. The other 74 sources were not. A similar test at age 10 among provenances showed 720 and 721 (central Nebraska) with 72 and 82 percent survival in the Northern Great Plains (Read 1983). Diameter The mean diameter was13.0 cm (6.0 in.)with a range from 17.2 cm - 5.3 cm (2.1 to 6.8 n). Mean diameters of the top 10 and bottom 10 families (Table 2) were 15.7 and 8.9 cm (6.2 and 3.4 in), respectively. Families from the 720 and 721 prove an- ces were among the best. A similar test at age 10 among prove- nces showed 720 and 721 (central Nebraska) were the best in the Northern Great Plains (Read 1983).The largest 59 families were not significantly different ranging from 17.2 to 14.1 cm (6.8 to 4.9 in). Five families (provenance 811) from Jordan, Montana, had significantly smaller diameters than the other families (where environmental factors were poor having very low precipitation and low annual temperatures), whereas di- ameters of the poorest 10 families were significantly smaller than those of the best (Table 3).Trees with the largest diameters had the tallest heights (r = 0.77096 at the 1% level). Table 1. Collection zones (provenances) of ponderosa p ine seed sources. Geographic origin(#) Tree additio ns (families)( #) Local area (town/state) Annual prec ipi ta- tion((mm )(in)) Annual mean temp. C0 (F0) Elevation m (ft) Latitude (0N) Longitude (0W) 720 02 - 11 Ainsworth NE 579 (22.8) 8.6 (47.6) 780 (2560) 42.59 100.00 721 01 - 11 Valentine NE 495 (19.5) 8.4 (47.2) 8 00 (2625) 42.88 100.55 757 01 - 40 Rosebud SD 955 (37.6) 8.5 (47.7) 850 (2789) 43.25 100.82 811 13,15 - 16,19,22 Jordan MT 327 (12.9) 6.9 (44.5) 808 (2625) 47.31 106.89 990 01 - 10 Springview NE 5 73 (22.7) 8.3 (47.0) 740 (2428) 42.82 99.75 991 01 - 05 Kilgore NE 516 (20.3) 8.3 (47.0) 800 (2625) 42.94 100.97 992 01 - 04 Drinkwater NE 495 (19.5) 8.3 (47.0) 859 (2800) 42.47 101.07 993 01 - 07 Nenzel NE 526 (20.3) 9.0(48.3) 950 (3117) 42.93 101.11 994 01 - 05 Bassett NE 635 (25.0) 9.0 (48.3) 71 0 ( 2329) 42.60 99.54 995 01 - 06 Snake Ri ver NE 495 (19.5) 8.3 (47.00 866 (2840) 42.71 100.97 996 01 - 14 Sparks NE 495 (19.5) 8.3 (47. 0) 800 (2625) 42.94 100.24 Table 2. Test of source effects on 15-year-old ponderosa pine families. Effect Pr > F DF Diameter Height D2H Family 74 <0.0001 <0.0001 <0.0001 Replicate 5 0.0020 0.0436 0.1047 Family X replicate 345 0.02262 0.03992 0.2912 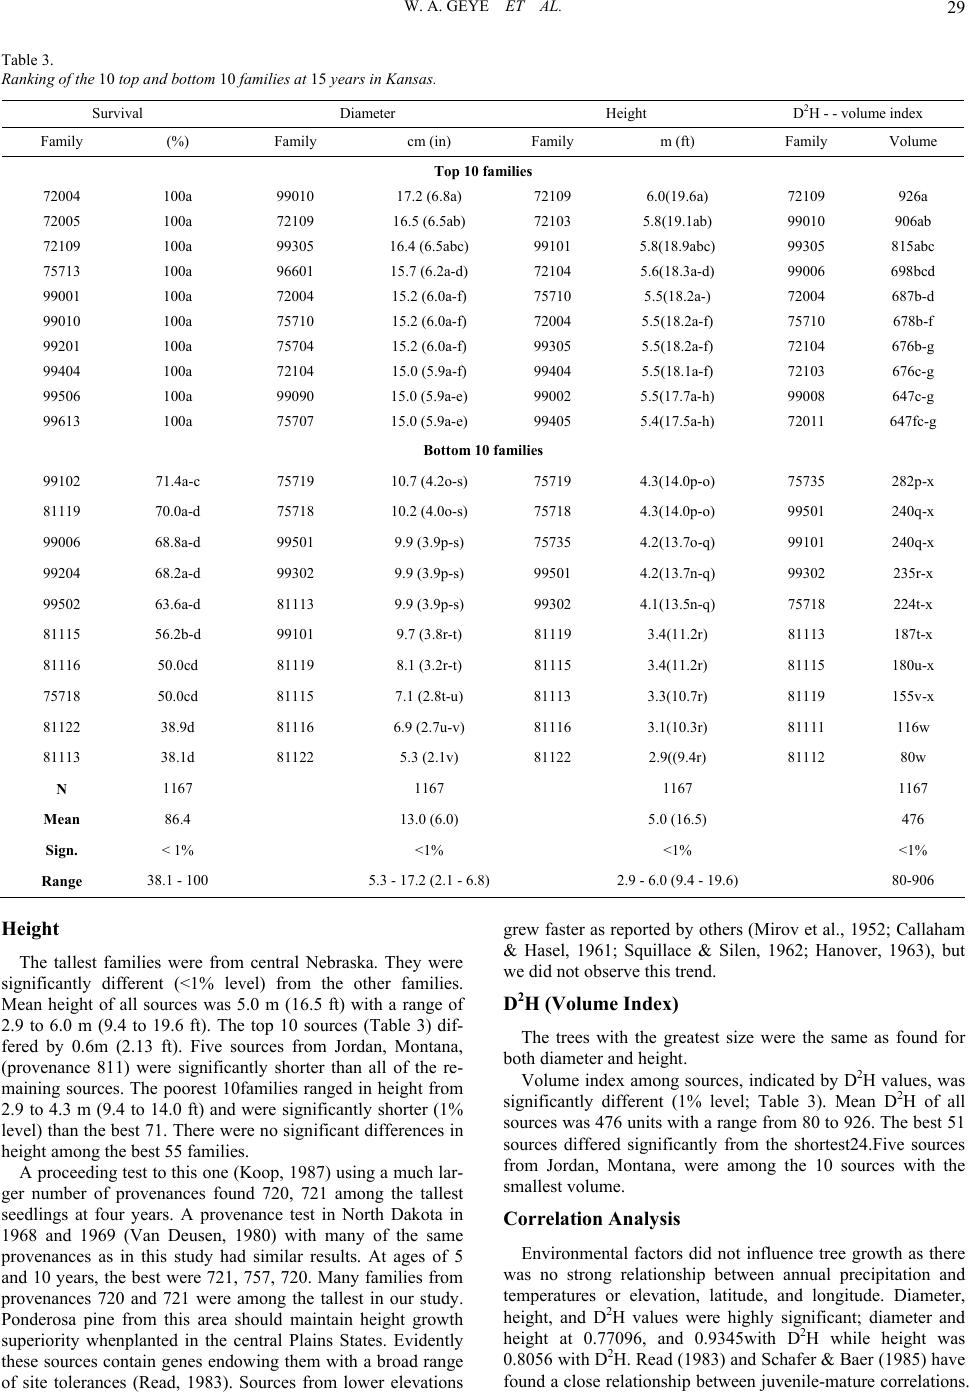 W. A. GEYE ET AL. 29 Table 3. Ranking of the 10 top and bottom 10 families at 15 years in Kansas. Survival Diameter Height D2H - - volume index Family (%) Family cm (in) Family m (ft) Family Volume Top 10 families 72004 100a 99010 17.2 (6.8a) 72109 6.0(19.6a) 72109 926a 72005 100a 72109 16.5 (6.5ab) 72103 5.8(19.1ab) 99010 906ab 72109 100a 99305 16.4 (6.5abc) 99101 5.8(18.9abc) 99305 815abc 75713 100a 96601 15.7 (6.2a-d) 72104 5.6(18.3a-d) 99006 698bcd 99001 100a 72004 15.2 (6.0a-f) 75710 5.5(18.2a-) 72004 687b-d 99010 100a 75710 15.2 (6.0a-f) 72004 5.5(18.2a-f) 75710 678b-f 99201 100a 75704 15.2 (6.0a-f) 99305 5.5(18.2a-f) 72104 676b-g 99404 100a 72104 15.0 (5.9a-f) 99404 5.5(18.1a-f) 72103 676c-g 99506 100a 99090 15.0 (5.9a-e) 99002 5.5(17.7a-h) 99008 647c-g 99613 100a 75707 15.0 (5.9a-e) 99405 5.4(17.5a-h) 72011 647fc-g Bottom 10 f a milies 99102 71.4a-c 75719 10.7 (4.2o-s) 75719 4.3(14.0p-o) 75735 282p-x 81119 70.0a-d 75718 10.2 (4.0o-s) 75718 4.3(14.0p-o) 99501 240q-x 99006 68.8a-d 99501 9.9 (3.9p-s) 75735 4.2(13.7o-q) 99101 240q-x 99204 68.2a-d 99302 9.9 (3.9p-s) 99501 4.2(13.7n-q) 99302 235r-x 99502 63.6a-d 81113 9.9 (3.9p-s) 99302 4.1(13.5n-q) 75718 224t-x 81115 56.2b-d 99101 9.7 (3.8r-t) 81119 3.4(11.2r) 81113 187t-x 81116 50.0cd 81119 8.1 (3.2r-t) 81115 3.4(11.2r) 81115 180u-x 75718 50.0cd 81115 7.1 (2.8t-u) 81113 3.3(10.7r) 81119 155v-x 81122 38.9d 81116 6.9 (2.7u-v) 81116 3.1(10.3r) 81111 116w 81113 38.1d 81122 5.3 (2.1v) 81122 2.9((9.4r) 81112 80w N 1167 1167 1167 1167 Mean 86.4 13.0 (6.0) 5.0 (16.5) 476 Sign. < 1% <1% <1% <1% Range 38.1 - 100 5.3 - 17.2 (2.1 - 6.8) 2 .9 - 6.0 (9.4 - 19.6) 80-906 Height The tallest families were from central Nebraska. They were significantly different (<1% level) from the other families. Mean height of all sources was 5.0 m (16.5 ft) with a range of 2.9 to 6.0 m (9.4 to 19.6 ft). The top 10 sources (Table 3) dif- fered by 0.6m (2.13 ft). Five sources from Jordan, Montana, (provenance 811) were significantly shorter than all of the re- maining sources. The poorest 10families ranged in height from 2.9 to 4.3 m (9.4 to 14.0 ft) and were significantly shorter (1% level) than the best 71. There were no significant differences in height among the best 55 families. A proceeding test to this one (Koop, 1987) using a much lar- ger number of provenances found 720, 721 among the tallest seedlings at four years. A provenance test in North Dakota in 1968 and 1969 (Van Deusen, 1980) with many of the same provenances as in this study had similar results. At ages of 5 and 10 years, the best were 721, 757, 720. Many families from provenances 720 and 721 were among the tallest in our study. Ponderosa pine from this area should maintain height growth superiority whenplanted in the central Plains States. Evidently these sources contain genes endowing them with a broad range of site tolerances (Read, 1983). Sources from lower elevations grew faster as reported by others (Mirov et al., 1952; Callaham & Hasel, 1961; Squillace & Silen, 1962; Hanover, 1963), but we did not observe this trend. D2H (Volume Index) The trees with the greatest size were the same as found for both diameter and height. Volume index among sources, indicated by D2H value s, was significantly different (1% level; Table 3). Mean D2H of all sources was 476 units with a range from 80 to 926. The best 51 sources differed significantly from the shortest24.Five sources from Jordan, Montana, were among the 10 sources with the smallest volume. Correlation Analysis Environmental factors did not influence tree growth as there was no strong relationship between annual precipitation and temperatures or elevation, latitude, and longitude. Diameter, height, and D2H values were highly significant; diameter and height at 0.77096, and 0.9345with D2H while height was 0.8056 with D2H. Read (1983) and Schafer & Baer (1985) have found a close relationship between juvenile-mature correlations.  W. A. GEYE ET AL. 30 Superior sources may be found at a fairly early age. Read (1983) noted that 2- and 3-year-old seedlings from the NE-SD areas among the tallest in his nursery study. Summary and Conclusion Fast-growing trees are desirable for establishment in the Great Plains. Ponderosa pine is often planted in homestead and field plantings in the Central and Northern Plains. Plains-wide studies conducted in the 1960s showed that sources from south central South Dakota and north central Nebraska were the best planting material. The present study was conducted to test a greater number of families to further refine selection areas for ponderosa pine sources. Materials from 75 individual trees were planted in the Central Plains sites for evaluation. Within this relatively small area, analyses indicated that ponderosa pine provenances affected growth of this 15-year-oldplantation. The best families came from central Nebraska. Environmental or geographic factors did not influence growth. References Baer, N, & Collins, P. (1979). Ten-year performance of a ponderosa pine provenance study in eastern South Dakota. South Dakota State University. Agricultural Experiment Station. TB- 52, Brookings, 6. Callaham, R. Z., & Hasel, A. A. (1961). Pinus ponderosa height growt h of wind-pollinated progenies. Silvae Ge net ica , 10, 32-42. Critchfield, W. B., & Little, Jr. E. (1966). Geographic distribution of the pines of the world .USDA. Miscellaneous Publication, 99, 97. Flint, H. L. (1983). Landscape Plants for eastern North America (p. 677). New York: John Wi ley & Sons. Deneke, F. J, & Read, R. A. (1957). Early survival and growth of pon- derosa pine provenances in East-Central Kansas. USDA Forest Ser- vice, Research Note RM-297, 4pp. Hamiliton, D. A., & Rehfeldt, G. E. (1994). Using individual tree growth projection models to estimate stand-level gains attributable to genetically improved stock. Forest Ecology and Management, 68, 189-207. doi:10.1016/0378-1127(94)90045-0 Hanover, J. W. (1963). Geographic variation in ponderosa pine leader growth. Forest Science, 9, 86-95. Lambeth, C. C. (1980). Juvenile-mature correlations in Pineaceae and implications or early selection. Forest Science, 26, 571-580. Koop, R. F., Geyer, W. A., & Argent, R. M. (1987). Evaluation of ponderosa pine seed sources for the eastern Great Plains. Journal Arboriculture, 13, 139-144. Read, R. (1983). Ten-year performance of ponderosa pine provenances in the Great Plains of North America. USDA Forest Service Research Paper 250, 17. Meier Martinez, A., Mondino, V., & Gallo, L. (2004). Criteria for the selection of plus trees of ponderosa pine (Pinus ponderosa) and Oregon pine (Pseudosugamenziesii) for the establishment of seed orchards in the Andean Patagonia Region of Argentin. Sgapya Fore- stal, 33, 2-9. Mirov, N. T., Dufield, J. W., & Liddicoet, A. R. (1952). Altitudinal races of Pinus ponderosa—A 12-year progress report. Journal of Forestry, 50, 825-831. SAS Institute Inc. (2004). SAS 2002-2003 SAS/STAT User’s guide. Version 9.1. Cary NC: SAS Institute Inc. Schaffer, P. R., & Baer, W. (1985). Ponderosa pine provenance for windbreaks in eastern South Dakota.North. Journal of Forestry, 2, 105-107. Schaffer, P. R., & Baer, N. W. (1992). Stability of ponderosa pine provenance: results after 21 years in eastern South Dakota. Northern Journal of Forestry, 9, 102-107. Squillace, A. E., & Silen, R. (1962). Racial variation in ponderosa pine. Forest Science Monograph, 2, 27. Van Deusen, J. L. (1980). Ponderosa pine provenances for the northern Great Plains. USDA Forest Service, Research Paper RM-223, 8. Van Haverbeke, D. (1986). Genetic variation in ponderosa pine: A 15-year test of provenances in the Great Plains. USDA Forest Service Rocky Mountain Forest Range Experiment Station Research Paper 80526, 16. Yow, T. H., Wagner, M. R., Wommack, D. E., & Tuskan, G. A. (1992). Influence of selection for volume growth on the genetic-variability of southwestern ponderosa pine. Silvae Genetica, 41, 326-333. |