

Paper Menu >>
Journal Menu >>
 Open Journal of Marine Science, 2011, 3, 98- 1 07 doi:10.4236/ojms.2011.13010 Published Online October 2011 (http://www.SciRP.org/journal/ojms) Copyright © 2011 SciRes. OJMS An Evaluation of the Selectivity Characteristics of Different Juvenile Fish Escape Panel Designs for the Demersal Trap Fishery of Abu Dhabi, United Arab Emirates Edwin Mark Grandcourt*, Thabit Zahran Al Abdessalaam, Stanley Alexander Hartmann, Ahmed Tarish Al Shamsi, Franklin Francis Biodiversity Management Sector, Environment Agency–Abu Dhabi, Abu Dhabi, United Arab Emirates E-mail: [email protected] Received June 27, 2011; revised September 8, 2011; accepted September 18, 2011 Abstract The selectivity characteristics of 4 juvenile fish escape panel designs and their utility for the regulation of a multi-species demersal trap fishery were evaluated using a suite of objective socio-economic and biological criteria. The panel designs consisted of a control (type A) which had a hexagonal mesh size which was the same as that of the body of the trap (3.5 cm), a rectangular mesh (type B) which was representative of the current regulation (5.0 × 7.6 cm) and 2 escape panels with square meshes of 7.5 × 7.5 cm (type C) and 10.0 × 10.0 cm (type D). The results demonstrated that there was only a limited reduction in the proportion of juve- nile fish and by-catch retained for the existing juvenile escape panel design (type B). Furthermore, as the se- lectivity characteristics for the key species (Epinephelus coioides and Diagramma pictum) were similar to the control type, the predicted increases in yields, revenues and spawning stock biomass were small by com- parison. The escape panel with the largest mesh size (type D) retained the least un-utilized and discarded by-catch. Whilst simulations predicted the highest spawner biomass per recruit, long term yields and reve- nues for the key species, its use was associated with a dramatic short-term decline in revenues which were 23.3% of the value of the control type. Traps fitted with the type C which had a square mesh of 7.5 × 7.5 cm had the lowest juvenile retention and the highest overall score for all the assessment criteria combined. The study provides an empirical basis for gear regulations for the demersal trap fishery of the Emirate of Abu Dhabi and the wider Arabian Gulf region. Keywords: Trap Fisheries, Selectivity, Escape Panel, By-Catch, Multi-Species Fisheries 1. Introduction The fisheries of the southern Arabian Gulf are typically multi-species in nature with over 100 species being ex- ploited. They provide a source of income, employment and recreation at the same time as contributing to the cul- tural heritage and food security of the inhabitants of the littoral states [1]. Dome shaped wire traps known locally as ‘gargoor’ operated from traditional wooden dhows are the most common method used to exploit demersal species. In common with other trap fisheries [2], the construction material has changed over time from natural materials (inter-woven palm fronds) to galvanized steel wire. The diameter of the trap base varies between 1 and 3 m, they are supported by tubular steel bars and have a funnel en- trance [3]. Some of the demersal fish populations in the region have been heavily exploited and fishing effort may be above optimum levels for many species [4], furthermore, the lack of appropriate data on most stocks underscores the need to assess fisheries resources [5]. The results of stock assessment studies for the key species caught in the demersal fisheries of Abu Dhabi in the southern Arabian Gulf have revealed that there are a large number of juve- nile fish retained by the trap fishery. More than half of the landed catches of the sparids (Acanthopagrus bifas- ciatus and Argyrops spinifer) for example are composed of immature fish [6]. Juvenile retention is a critical ma-  E. M. GRANDCOURT ET AL.99 Copyright © 2011 SciRes. OJMS nagement issue because in combination with intensive exploitation, it has resulted in both ‘growth overfishing’ where yields are in excess of the production potential and “recruitment overfishing” where the populations have been reduced to such low levels that their reproductive capacity is impaired [7]. There are two principal benefits of increasing the size at which fish become vulnerable to capture, firstly, the fishery can benefit from increased yields as the full growth potential of the resource base is realized, and secondly, the stock size can increase through greater re- productive capacity and a reduction in the proportion of the stock that is vulnerable to capture. Higher yields in a trap fishery in the Caribbean have been documented just 3 years after the introduction of larger mesh sizes [8]. Increasing the mesh-size selectivity of fish traps may also result in a reduction of discarded by-catch species [9]. Such benefits are consistent with management objec- tives of resource/biodiversity conservation, stock rebuil- ding and improving the socio-economic status of fishers. Existing gear regulations for the demersal trap fishery in the waters off Abu Dhabi include the requirement for a stainless steel juvenile escape panel to be fitted to all traps. The escape panel has a rectangular mesh of 7.6 × 5.0 cm and given the potential for traps to ‘ghost fish’ after being lost [10], a magnesium/zinc alloy sacrificial anode pin, which allows the panel to open after 2 weeks is mandatory. As juvenile retention persisted following the implementation of this regulation, there was clearly a need for an objective evaluation of its utility in relation to specified fisheries management objectives. In this context, the aim of this study was to evaluate the selectivity characteristics of traps fitted with the ex- isting juvenile escape panel and two other designs with larger mesh sizes against a control. A set of criteria based on fishery management objectives were used to ascertain which escape panel design is most appropriate for use in the regulation of the demersal trap fishery of Abu Dhabi. 2. Materials and Methods 2.1. Escape Panel Designs Escape panels measured 30 × 40 cm and were con- structed of solid 304 stainless steel bar with a 4 mm di- ameter. Plastic frames were used to attach the escape panels to hemispherical traps constructed of galvanized wire with a hexagonal mesh of 3.5 cm. Escape panels were attached to the trap opposite to the funnel. Trap type A was the control which only had a plastic frame secured over the normal mesh of the trap. Trap type B consisted of an escape panel with a rectangular mesh of 7.6 × 5.0 cm, the longer axis of which was orientated horizontally. Trap type C consisted of an escape panel with a square mesh of 7.5 × 7.5 cm and trap type D consisted of an es- cape panel with a square mesh of 10.0 × 10.0 cm. 2.2. Sampling Protocol and Study Site Sampling trips were conducted using a traditional woo- den dhow between November 2005 and February 2008 in the waters off Abu Dhabi in the southern Arabian Gulf (Figure 1). During each sampling trip, traps were set in strings approximately 1 km apart. Each of the strings contained 1 of each trap type arranged in a random order and set approximately 20m apart. Traps were baited with bread and dried sardinella held in a bait bag. Approxi- mately 12 trap strings were set on each trip representing 48 trap sets per trip in total. The date and time of hauling were recorded along with the depth. Catches from each trap were bagged and labeled by trap type, fork or total length (cm) and total weight (g) were later measured and recorded for each species. 2.3. Data Analyses 1) The proportion of juvenile fish retained for key com- mercially exploited species in terms of numbers and weight. The proportion of juvenile fish retained for key com- mercially exploited species in terms of numbers and weight was calculated for each escape panel type. Size at maturity was obtained from published literature for Abu Dhabi, when not available locally, the closest geo- graphical location was selected (Table 1). Species were excluded from the analyses if they did not occur in the catches of all trap types, there were insufficient sample sizes to make valid comparisons between trap types, or if there was no data available on the size at maturity. Of the 65 species caught, 10 species were included in the analyses representing 70.1% of the total catch weight. 2) The proportion of un-utilized and discarded by- catch species retained by numbers and weight. Species were classified as commercially traded target species or un-utilized or discarded by-catch. The propor- tion of un-utilized or discarded by-catch in terms of num- bers and weight was calculated for each escape panel type. 3) The simulated long term increase in yields using differences in yield per recruit (YPR) as a proxy for key commercially exploited species. Yield per recruit simulations were conducted for Dia- gramma pictum and Epinephelus coioides as these were the only species which had sufficient data for all trap types. Together they represented 68% of the total catch weight (excluding by-catch) and were therefore collec- tively representative of the most important commercial 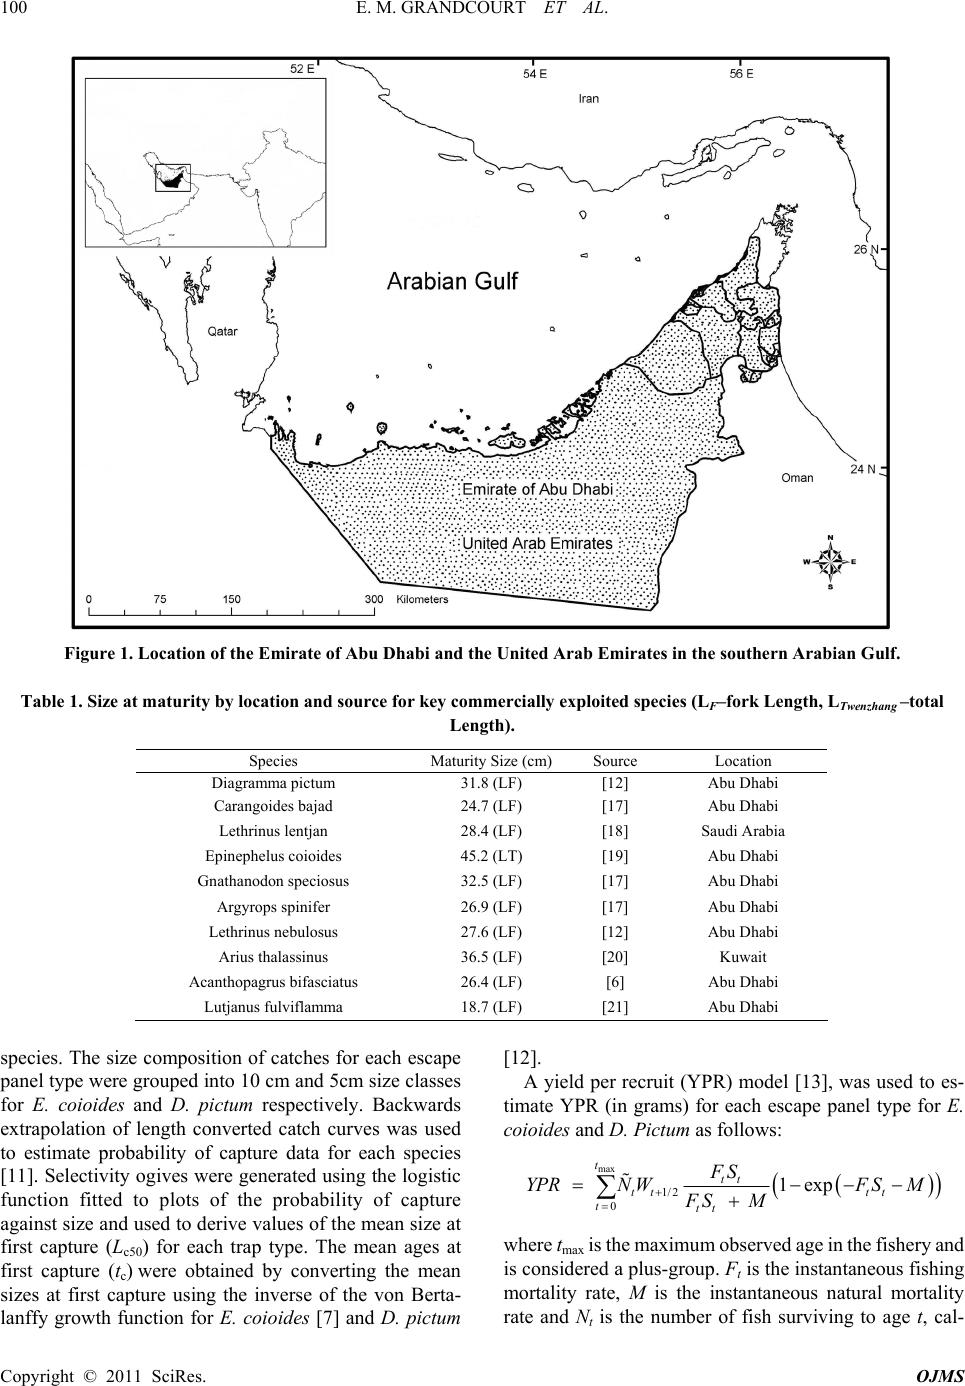 E. M. GRANDCOURT ET AL. 100 Figure 1. Location of the Emirate of Abu Dhabi and the United Arab Emirates in the southern Arabian Gulf. Table 1. Size at maturity by location and source for key commercially exploited species (L F –fork Length, L Twenzhang –total Length). Species Maturity Size (cm) Source Location Diagramma pictum 31.8 (LF) [12] Abu Dhabi Carangoides bajad 24.7 (LF) [17] Abu Dhabi Lethrinus lentjan 28.4 (LF) [18] Saudi Arabia Epinephelus coioides 45.2 (LT) [19] Abu Dhabi Gnathanodon speciosus 32.5 (LF) [17] Abu Dhabi Argyrops spinifer 26.9 (LF) [17] Abu Dhabi Lethrinus nebulosus 27.6 (LF) [12] Abu Dhabi Arius thalassinus 36.5 (LF) [20] Kuwait Acanthopagrus bifasciatus 26.4 (LF) [6] Abu Dhabi Lutjanus fulviflamma 18.7 (LF) [21] Abu Dhabi species. The size composition of catches for each escape panel type were grouped into 10 cm and 5cm size classes for E. coioides and D. pictum respectively. Backwards extrapolation of length converted catch curves was used to estimate probability of capture data for each species [11]. Selectivity ogives were generated using the logistic function fitted to plots of the probability of capture against size and used to derive values of the mean size at first capture (Lc50) for each trap type. The mean ages at first capture (tc) were obtained by converting the mean sizes at first capture using the inverse of the von Berta- lanffy growth function for E. coioides [7] and D. pictum [12]. A yield per recruit (YPR) model [13], was used to es- timate YPR (in grams) for each escape panel type for E. coioides and D. Pictum as follows: max 1/2 0 1exp t tt tt tt t tt FS YPRN WF SM FS M where tmax is the maximum observed age in the fishery and is considered a plus-group. Ft is the instantaneous fishing mortality rate, M is the instantaneous natural mortality rate and Nt is the number of fish surviving to age t, cal- Copyright © 2011 SciRes. OJMS 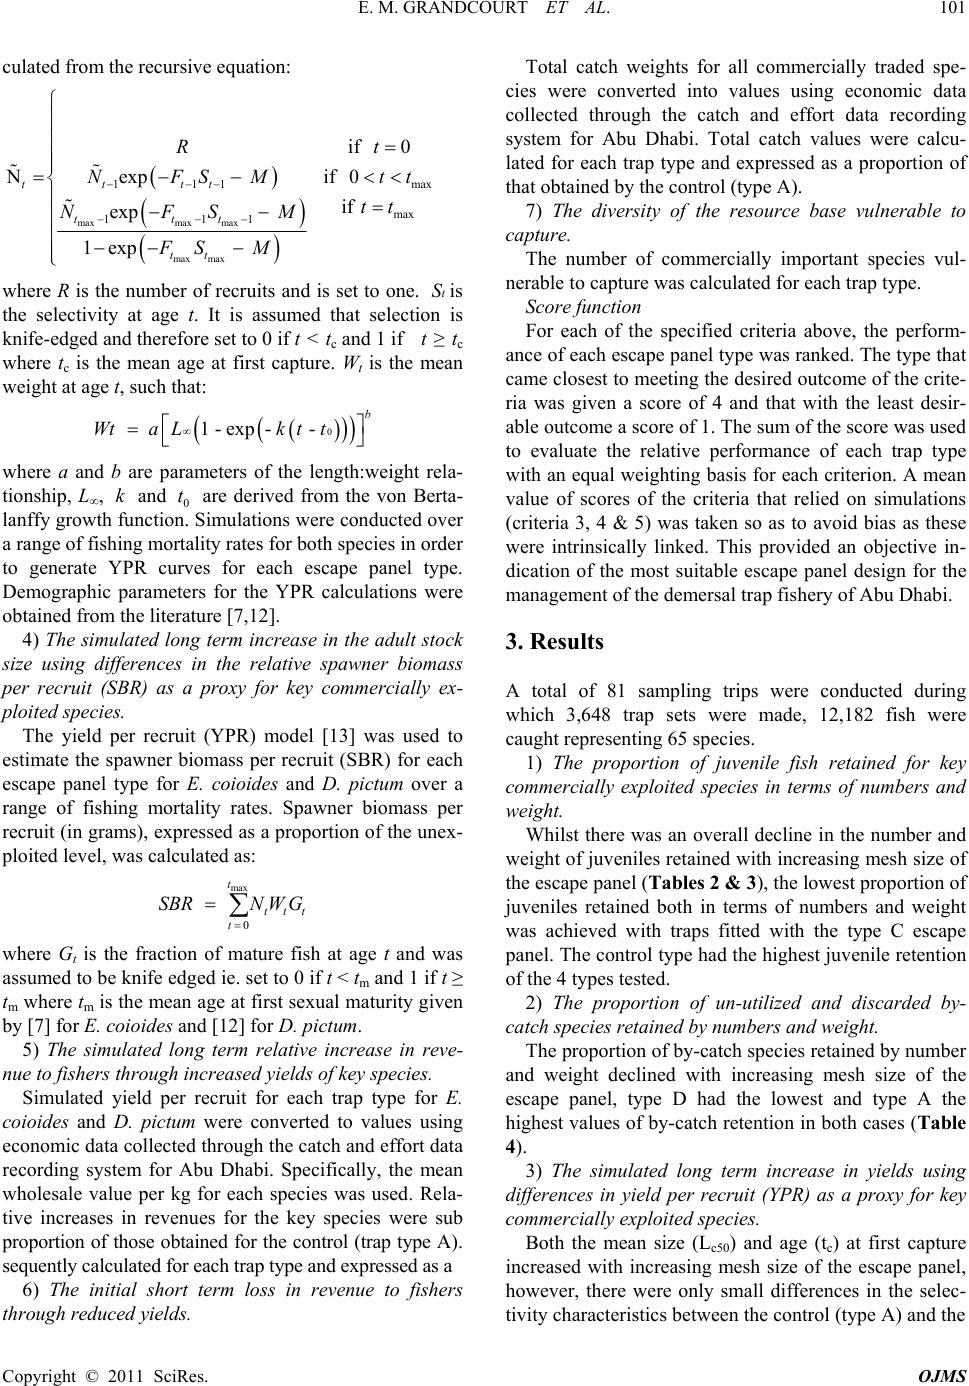 E. M. GRANDCOURT ET AL.101 Copyright © 2011 SciRes. OJMS culated from the recursive equation: maxmax max max max 111 max 111 if 0 Nexp if0 if exp 1exp tttt ttt tt R NFSM tt tt NFSM FS M max t where R is the number of recruits and is set to one. is the selectivity at age t. It is assumed that selection is knife-edged and therefore set to 0 if t < t c and 1 if t ≥ t c where t c is the mean age at first capture. W t is the mean weight at age t, such that: t S 0 1 - exp- - b WtaLk tt where a and b are parameters of the length:weight rela- tionship, L, and 0 are derived from the von Berta- lanffy growth function. Simulations were conducted over a range of fishing mortality rates for both species in order to generate YPR curves for each escape panel type. Demographic parameters for the YPR calculations were obtained from the literature [7,12]. k t 4) The simulated long term increase in the adult stock size using differences in the relative spawner biomass per recruit (SBR) as a proxy for key commercially ex- ploited species. The yield per recruit (YPR) model [13] was used to estimate the spawner biomass per recruit (SBR) for each escape panel type for E. coioides and D. pictum over a range of fishing mortality rates. Spawner biomass per recruit (in grams), expressed as a proportion of the unex- ploited level, was calculated as: max 0 t ttt t SBRNW G where Gt is the fraction of mature fish at age t and was assumed to be knife edged ie. set to 0 if t < tm and 1 if t ≥ tm where tm is the mean age at first sexual maturity given by [7] for E. coioides and [12] for D. pictum. 5) The simulated long term relative increase in reve- nue to fishers through increased yields of key species. Simulated yield per recruit for each trap type for E. coioides and D. pictum were converted to values using economic data collected through the catch and effort data recording system for Abu Dhabi. Specifically, the mean wholesale value per kg for each species was used. Rela- tive increases in revenues for the key species were sub proportion of those obtained for the control (trap type A). sequently calculated for each trap type and expressed as a 6) The initial short term loss in revenue to fishers through reduced yields. Total catch weights for all commercially traded spe- cies were converted into values using economic data collected through the catch and effort data recording system for Abu Dhabi. Total catch values were calcu- lated for each trap type and expressed as a proportion of that obtained by the control (type A). 7) The diversity of the resource base vulnerable to capture. The number of commercially important species vul- nerable to capture was calculated for each trap type. Score function For each of the specified criteria above, the perform- ance of each escape panel type was ranked. The type that came closest to meeting the desired outcome of the crite- ria was given a score of 4 and that with the least desir- able outcome a score of 1. The sum of the score was used to evaluate the relative performance of each trap type with an equal weighting basis for each criterion. A mean value of scores of the criteria that relied on simulations (criteria 3, 4 & 5) was taken so as to avoid bias as these were intrinsically linked. This provided an objective in- dication of the most suitable escape panel design for the management of the demersal trap fishery of Abu Dhabi. 3. Results A total of 81 sampling trips were conducted during which 3,648 trap sets were made, 12,182 fish were caught representing 65 species. 1) The proportion of juvenile fish retained for key commercially exploited species in terms of numbers and weight. Whilst there was an overall decline in the number and weight of juveniles retained with increasing mesh size of the escape panel (Tables 2 & 3), the lowest proportion of juveniles retained both in terms of numbers and weight was achieved with traps fitted with the type C escape panel. The control type had the highest juvenile retention of the 4 types tested. 2) The proportion of un-utilized and discarded by- catch species retained by numbers and weight. The proportion of by-catch species retained by number and weight declined with increasing mesh size of the escape panel, type D had the lowest and type A the highest values of by-catch retention in both cases (Table 4). 3) The simulated long term increase in yields using differences in yield per recruit (YPR) as a proxy for key commercially exploited species. Both the mean size (Lc50) and age (tc) at first capture increased with increasing mesh size of the escape panel, however, there were only small differences in the selec- tivity characteristics between the control (type A) and the  E. M. GRANDCOURT ET AL. 102 Copyright © 2011 SciRes. OJMS Table 2. Juvenile retention (%) for key commercial species by escape panel type. Escape Panel Type Species A B C D Diagramma pictum 52.9 38.9 6.8 14.5 Carangoides bajad 86.0 53.1 68.4 20.0 Lethrinus lentjan 77.0 50.0 26.7 100.0 Epinephelus coioides 49.0 46.8 15.6 22.0 Gnathanodon speciosus 88.4 42.1 12.5 0.0 Argyrops spinifer 95.3 76.3 76.9 0.0 Lethrinus nebulosus 50.0 12.5 0.0 0.0 Arius thalassinus 27.3 33.3 0.0 100.0 Acanthopagrus bifasciatus 80.0 57.1 0.0 0.0 Lutjanus fulviflamma 21.8 44.4 81.8 0.0 Table 3. Overall number and weight of juveniles retained by escape panel type. Escape Panel Type A B C D # juveniles retained 1823 710 110 31 % juveniles retained 59.7 42.3 12.9 15.7 Weight of juveniles retained (kg) 489.8 273.8 44.5 23.4 % juveniles retained by weight 28.8 20.8 4.5 6.3 Table 4. The proportion by weight and number of by-catch species retained by escape panel type. Escape Panel Type A B C D % by-catch by weight 5.6 4.3 3.1 0.5 % by-catch by numbers 9.2 6.0 3.9 0.6 escape panel that is currently used in the fishery (type B) (Figure 2, Table 5). Simulations of yield per recruit in- dicated that the long term benefits in terms of increasing catches would be small with the current escape panel when compared with the control (Figures 3 & 4). In- creases in yield per recruit were predicted to occur for the type C panel. However, the greatest long term bene- fits in terms of increasing catches for both E. coioides and D. pictum were predicted to occur for the escape panel with the largest mesh size (type D) (Figures 3 & 4). Yield per recruit was predicted to be 58% (E. coioides) and 128% (D. pictum) greater than the control (type A) for the type D escape panel (Figure 4). YPR analyses also indicated that the current level of fishing effort (2008) is greater than that required to maximize YPR for all escape panel types for both E. coioides and D. pictum. 4) The simulated long term increase in the adult stock size using differences in the relative spawner biomass per recruit (SBR) as a proxy for key commercially ex- ploited species. Simulations of spawner biomass per recruit indicated that the long term benefits in terms of stock rebuilding would be small with the current escape panel (type B) when compared with the control (Figures 5 & 6). Large increases in spawner biomass per recruit were predicted to occur for trap type C for both E. coioides and D. pic- tum. However, the greatest long term benefits in terms of stock rebuilding for both species were predicted to occur for the escape panel with the largest mesh size (trap type D) (Figures 5 & 6). Spawner biomass per recruit was predicted to be 398% (E. coioides) and 258% (D. pictum) greater than the control type (type A) for panel type D (Figure 6). The SBR analyses also indicated that even with the escape panel with the largest mesh size, the SBR would be less than the existing target reference point (SBR40%) currently used for the management of the fish- ery for both E. coioides and D. pictum. 5) The simulated long term relative increase in reve- nue to fishers through increased yields of key species. A limited increase in revenue was predicted to occur for the type B panel (5.8%) for the key species (E. coioides and D. pictum) by comparison with the control. Revenues were predicted to increase by 44.9% and  E. M. GRANDCOURT ET AL. 103 Table 5. Selectivity parameters for Epinephelus coioides and Diagramma pictum (L c50 –mean size at first capture, t c –mean age at first capture) by esc ape panel type. Escape Panel Type Species Parameter A B C D D. pictum Lc50 (cm LF) 27.0 28.9 37.1 44.1 tc (yrs) 0.9 1.2 2.3 3.6 E. coioides Lc50 (cm LT) 37.2 38.8 49.4 55 tc (yrs) 1.9 2.1 3.5 4.4 Table 6. Total catch values and the proportion relative to the control (type A) by escape pane l type. Escape Panel Type A B C D Total catch value (Dirhams) 23,447 17,327 12,900 5,469 Proportion (relative to trap type A) (%) - 73.9 55.0 23.3 0.0 0.1 0.2 0.3 0.4 0.5 0.6 0.7 0.8 0.9 1.0 0 10203040506070 Probability of capture Fork length (cm) Type A Type B Type C Type D (a ) 0.0 0.1 0.2 0.3 0.4 0.5 0.6 0.7 0.8 0.9 1.0 0 102030405060708090 Probability of capture Fork length (cm) Type A Type B Type C Type D (b ) Figure 2. Selectivity ogives for (a) D. pictum and (b) E. coioides by escape panel type. 0 200 400 600 800 1000 1200 00.511.522.5 F cur (a) 0 100 200 300 400 500 600 700 00.1 0.2 0.3 0.4 0.5 0.6 0.7 0.8 0.91 Typ e A Typ e B Typ e C Typ e D F cur Fishing mortality rate (F) YPR (g) (b) YPR (g) Typ e A Typ e B Typ e C Typ e D Fishing mortality rate (F) Figure 3. Yield per recruit curves by escape panel type for (a) E. coioides and (b) D. Pictum. Vertical lines show the existing fishing mortality rate (F cur ). 250.6% for trap types C and D respectively when com- pared to those for the control (type A). 6) The initial short term loss in revenue to fishers through reduced yields. There was a consistent decline in the total value of the catch with increasing mesh size of the escape panel. Trap Copyright © 2011 SciRes. OJMS  E. M. GRANDCOURT ET AL. 104 Copyright © 2011 SciRes. OJMS 0 20 40 60 80 100 120 140 BCD E. c o ioid e s D. pict um Difference in YPR (%) Escape panel t type Figure 4. The difference in YPR for E. coioides and D. pic- tum for each escape panel type in comparison with the con- trol. type D had the largest and trap type B the smallest re- duction in value relative to the control (type A) (Table 6). 7) The diversity of the resource base vulnerable to capture. There was a reduction in the number of commercial species vulnerable to capture with increasing mesh size of the escape panel, the number of commercial species caught by trap type was; 41 (type A), 40 (type B), 35 (type C) and 25 for trap type D. Score function The score function summary indicated that whilst trap types A and D were the highest ranked for 2 criteria each, overall, trap type C had the highest total score (Table 7). Trap types A and D had the lowest score for 3 and 2 cri- teria respectively. 0 10 20 30 40 50 60 70 80 90 100 00.511.522.5 Typ eA Typ eB Typ eC Typ eD Fishing mortality rate (F) SBR (%) (a) F cur 0 10 20 30 40 50 60 70 80 90 100 00.1 0.2 0.3 0.4 0.5 0.6 0.7 0.8 0.91 Typ eA Typ eB Typ eC Typ eD Fishing mortality rate (F) SBR (%) (b) F cur Figure 5. Relative spawner biomass per recruit (SBR) curves by escape panel type for (a) E. coioides and (b) D. pictum. Ver- tical lines show the existing fishing mortality rate (F cur ). 0 100 200 300 400 BCD E. c o io ide s D. pict um Difference in SBR (%) Escape panel type Figure 6. The difference in SBR for E. coioides and D. pic- tum for each escape panel type in comparison with the con- trol. 4. Discussion The selection of escape panels for use in the management of demersal multi-species fisheries is problematic be- cause of the difficulty in achieving suitable selectivity characteristics for all important species. The same con- clusion has been reached from studies of the selectivity of different mesh sizes for the demersal trap fishery of New South Wales in Australia [9,14]. Nevertheless, this study has provided an empirical evaluation of the re- source management utility of different juvenile escape panel designs and the basis for gear regulations for the demersal trap fishery of Abu Dhabi. The score function developed is based on an equal weighting among criteria and attention is drawn to the fact that the most suitable escape panel design may vary depending on resource  E. M. GRANDCOURT ET AL. 105 Copyright © 2011 SciRes. OJMS Table 7. Rank scores by criteria and escape panel type (shaded cells highlight the highest ranked escape panel ty pe for each criterion). Escape Panel Type Criteria A B C D 1 1 2 4 3 2 1 2 3 4 3, 4 & 5 1 2 3 4 6 4 3 2 1 7 4 3 2 1 Total Score 11 12 14 13 management priorities and associated criteria weightings. Previous investigations of the selectivity characteris- tics of trap mesh have shown that body shape is a critical factor in determining retention size, with slender fishes being more likely to escape than species that are laterally compressed [15]. Our results support this pattern with much higher juvenile retention rates being observed for the deeper bodied species such as the sparid (Argyrops spinifer) by comparison with species with a more rounded profile such as the serranid Epinephelus coi- oides. The number of species for which selectivity pa- rameters could be determined was limited due to inade- quate sample sizes for all escape panel types. An alterna- tive method using a parlour trap should be considered in future experiments as selectivity can be determined with fewer fish, and consequently less sampling effort [9]. The control type escape panel which had a mesh size which was the same size as that of the body of the trap (3.5 cm), had the most undesirable selectivity character- istics overall with the highest levels of juvenile and by-catch retention. As this type also had the smallest and youngest mean size and age at first capture for the key species (E. coioides and D. pictum), predicted estimates of yields, revenues and spawning stock biomass were the lowest amongst the different types tested. Whilst the control had the highest catch rate and provided the larg- est revenue it was the least suitable option based on the objective assessment criteria. The results demonstrate that the existing juvenile es- cape panel design (type B) currently used in the fishery, only has marginal benefits in terms of its intended objec- tives. Specifically, there was only a limited reduction in the proportion of juvenile fish and by-catch retained. Furthermore, as the selectivity characteristics for the key species were similar to the control type, the predicted increases in yields, revenues and spawning stock bio- mass were negligible. Consequently, the existing escape panel design had the lowest overall score of all types (excluding the control) and was not ranked highest in any of the assessment criteria. Escape panel type C had the lowest juvenile retention of all the panel types tested. Whilst it was not ranked highest in any other category, overall it had the highest score for all the assessment criteria combined. There were large differences in the selectivity characteristics by comparison with the control and type B for the key spe- cies (E. coioides and D. pictum). Consequently relatively large increases in yields, revenues and spawning stock biomass were predicted to be associated with this escape panel type. The escape panel with the largest mesh size (type D) retained the least un-utilized and discarded by-catch. Furthermore, it had the largest and oldest mean size and age at first capture for the key species (E. coioides and D. pictum), consequently, simulations predicted the highest spawner biomass per recruit, long term yields and reve- nues for this design. Of particular note is the large pre- dicted long term increase in revenue (250.6%) for the key species when compared to the control type. However, the use of the type D design would be associated with a dramatic short-term decline in revenues which were 23.3% of the value of the control type. Furthermore, 16 commercial species which were vulnerable to the control type were not caught with traps fitted with this escape panel, indicating that only a limited portion of the re- source base would be accessible to fishers. The results of the yield and spawner biomass per re- cruit simulations indicate that both growth and recruit- ment fishing are occurring for the key target species (E. coioides and D. pictum). This supports the widespread recognition that in places where wire-mesh fish traps have been used extensively, the target specie are cur- rently over-exploited [14,16]. A critical finding of the study is that at existing fishing mortality rates, resource management targets of stock rebuilding cannot be achieved for the key species using gear regulations alone for the escape panel designs tested here. This supports contentions from previous assessments [7,12] that reduc- tions in fishing effort are also required for the demersal trap fishery in the southern Arabian Gulf. As the species and principal fishing method for exploiting demersal fisheries resources are similar throughout the region, the results obtained here should be applicable to fisheries management authorities in a wider geographical context.  E. M. GRANDCOURT ET AL. 106 Copyright © 2011 SciRes. OJMS 5. Acknowledgements This study was conducted as part of the ‘Experimental Fishing Project’ (Project no. 02-23-0009-06/07), imple- mented by the Biodiversity Management Sector of the Environment Agency–Abu Dhabi. The management of the Environment Agency–Abu Dhabi are thanked for their support for this work. The owner and crew of the dhow (#1402) are thanked for their help, particularly in setting and hauling the traps. Hamad Al Shamsi provided assistance during some of the research cruises and John Hoolihan helped in the overall development of the ex- perimental fishing project. 6. References [1] E. M. Grandcourt, “Fish and Fisheries,” In: T. Z. Al Ab- dessalaam, Ed., Marine Environment and Resources of Abu Dhabi, Motivate Publishing, Dubai, 2008, pp. 200- 225. [2] J. Stewart, “By-Catch Reduction in Wire-mesh Fish Traps,” In: S. J. Kennelly, Ed., By-Catch Reduction in the Worlds Fisheries, Springer, Berlin, 2007, pp. 75-93. doi:10.1007/978-1-4020-6078-6_4 [3] M. Beech, T. Z. Al Abdessalaam and J. Hoolihan, “Ma- rine Fish,” In: P. Hellyer and S. Aspinal, Eds., The Emir- ates―A Natural History, Trident Press, London, 2005, pp 261-281. [4] M. Samuel, C. P. Mathews and A. S. Bawazeer, “Age and Validation of Age from Otoliths for Warm Water Fishes from the Arabian Gulf,” In: R. C. Summerfelt and G. E. Hall, Eds., Age and Growth of Fish, IOWA State Univer- sity Press, Oxford, 1987, pp. 253-265. [5] M. S. M. Siddeek, M. M. Fouda and G. V. Hermosa Jr., “Demersal Fisheries of the Arabian Sea, the Gulf of Oman and the Arabian Gulf,” Estuarine and Coastal Shelf Science, Vol. 49, 1999, pp. 87-97. [6] E. M. Grandcourt, T. Z. Al Abdessalaam, F. Francis and A. T. Al Shamsi, “Biology and Stock Assessment of the Sparids, Acanthopagrus Bifasciatus and Argyrops spinifer (Forsskål, 1775), in the Southern Arabian Gulf,” Fisheries Research, Vol. 69, No. 1, 2004, pp. 7-20. doi:10.1016/j.fishres.2004.04.006 [7] E. M. Grandcourt, T. Z. Al Abdessalaam, F. Francis and A. T. Al Shamsi, “Population Biology and Assessment of the Orange-Spotted Grouper, Epinephelus Coioides (Ha- milton, 1822), in the Southern Arabian Gulf,” Fisheries Research, Vol. 74, No. 1, 2005, pp. 55-68. doi:10.1016/j.fishres.2005.04.009 [8] Z. Sary, H. A. Oxenford and J. D. Woodley, “Effects of an Increase in Trap Mesh Size on an Overexploited Coral Reef Ffishery at Discovery Bay, Jamaica,” Marine Ecol- ogy Progress Series, Vol. 154, No. 1, 1997, pp. 107-120. doi:10.3354/meps154107 [9] J. Stewart and D. J. Ferrell, “Escape Panels to Reduce by-Catch in the New South Wales demersal Trap Fish- ery,” Marine and Freshwater Research, Vol. 53, No. 8, 2002, pp. 1179-1188. doi:10.1071/MF02062 [10] H. Al Masroori, H. Al Oufi, J. McIlwain and E. McLean, “Catches of Lost Fish Traps (ghost fishing) from Fishing Grounds near Muscat, Sultanate of Oman,” Fisheries Re- search, Vol. 69, No. 3, 2004, pp. 407-414. doi:10.1016/j.fishres.2004.05.014 [11] F. C. Gayanilo Jr. and D. Pauly, “FAO-ICLARM Stock Assessment Tools. Reference manual. ICLARM Interna- tional Centre for Living Aquatic Resources Manage- ment," Food and Agricultural Organisation of the United Nations, Rome, 1997, p. 262. [12] E. M. Grandcourt, T. Z. Al Abdessalaam, A. T. Al Shamsi and F. Francis, “Biology and Assessment of the Painted Sweetlips (Diagramma pictum (Thunberg, 1792)) and Spangled Emperor (Lethrinus nebulosus (Forsskål, 1775)) in the Southern Arabian Gulf,” Fisheries Bulletin, Vol. 104, No. 1, 2006, pp. 75-88. [13] R. J. H. Beverton and S. J. Holt, “On the Dynamics of Exploited Fish Populations,” Chapman and Hall, London, 1957, p. 533 [14] J. Stewart and D. J. Ferrell, “Mesh Selectivity in the NSW Demersal Trap Fishery,” Fisheries Research, Vol. 59, No. 3, 2003, pp. 379-392. doi:10.1016/S0165-7836(02)00024-3 [15] D. L. Sutherland, J. A. Bohnsack, D. E. Harper, C. M. Holt, M. W. Hulsbeck and D. B. McClellan, “Preliminary report. Reef Fish Size and Species Selectivity by Wire Fish Traps in South Florida Waters,” Proceedings of the Gulf and Caribbean Fisheries Institute, Vol. 40, 1991, pp. 25-108. [16] R. Mahon and W. Hunte, “Trap Mesh Selectivity and the Management of Reef Fishes,” Fish and Fisheries, Vol. 2, No. 4, 2001, pp. 356-375. doi:10.1046/j.1467-2960.2001.00054.x [17] E. M. Grandcourt, T. Z. Al Abdessalaam and F. Francis, “Population Biology and Assessment of Representatives of the Family Carangidae; Carangoides Bajad and Gna- thanodon Speciosus (Forsskål, 1775), in the Southern Arabian Gulf,” Fisheries Research, Vol. 69, No. 3, 2004, pp. 331-341. doi:10.1016/S0165-7836(04)00141-9 [18] M. J. Sanders and G. R. Morgan, “Review of the Fisher- ies Resources of the Red Sea and Gulf of Aden,” FAO Fisheries Technical Report, Vol. 304, 1989, p. 138. [19] E. M. Grandcourt, T. Z. Al Abdessalaam, F. Francis, A. T. Al Shamsi and S. A. Hartmann, “Reproductive Biology and Implications for Management of the Orange-Spotted Grouper, Epinephelus Coioides (Hamilton, 1822), in the southern Arabian Gulf,” Journal of Fish Biology, Vol. 74, 2009, pp. 820-841. doi:10.1111/j.1095-8649.2008.02163.x [20] A. S. Bawazeer, “The Fishery Management of the Stock of Chim, the Giant Sea Catfish Arius Thalassinus in Ku- wait Waters,” Kuwait Bulletin of Marine Science, Vol. 9, 1987, pp. 87-100. [21] E. M. Grandcourt, T. Z. Al Abdessalaam and F. Francis,  E. M. GRANDCOURT ET AL. Copyright © 2011 SciRes. OJMS 107 “Age, Growth, Mortality and Reproduction of the Black- Spot Snapper, Lutjanus Fulviflamma (Forsskal, 1775) in the Southern Arabian Gulf,” Fisheries Research, Vol. 78, No. 2-3, 2006, pp. 203-210. doi:10.1016/j.fishres.2005.11.021 |