

Paper Menu >>
Journal Menu >>
 Open Journal of Marine Science, 2011, 3, 82-97 doi:10.4236/ojms.2011.13009 Published Online October 2011 (http://www.SciRP.org/journal/ojms) Copyright © 2011 SciRes. OJMS An Evaluation of the Management Effectiveness of a Stock Re-Building Strategy for a Multi-Species Demersal Trap Fishery in Abu Dhabi, United Arab Emirates Edwin Mark Grandcourt, Thabit Zahran Al Abdessalaam, Stanley Alexander Hartmann, Franklin Francis, Ahmed Tarish Al Shamsi Biodiversity Management Sector, Environment Agen cy–Abu Dhabi, Abu Dhabi, United Arab Emirates E-mail: [email protected] Received June 27, 2011; revised September 8, 2011; accepted September 22, 2011 Abstract The off-shore demersal trap fishery in the southern Arabian Gulf has been managed by gear regulations and effort constraints which were aimed at rebuilding depleted stocks. In order to evaluate the success of these regulations, a variety of selectivity and other fishery metrics were compared for the key species (Diagramma pictum, Epinephelus coioides and Lethrinus nebulosus) before and after their introduction. With the excep- tion of a minor increase in the mean age at first capture from 1.3 yrs to 1.9 yrs for E. coioides, there were no significant changes in the values or trends in juvenile retention, mean size or the mean sizes and ages at first capture. The comparison of selectivity ogives with data derived independently through an experimental fish- ing program indicated that the failure of juvenile escape panels to modify the selectivity characteristics of the fishery could not be attributed to a lack of compliance. Furthermore, there were no significant changes in fishing mortality rates, harvest rates, catch, effort, yield per recruit and relative spawner biomass per recruit following the introduction of the management regulations. Age structures were highly truncated and the management measures had failed to increase the relative proportion of older age classes. Stock status indica- tors suggested that all species were heavily over-exploited with evidence of both growth and recruitment over-fishing. Given the failure of existing regulations to modify gear selectivity, reduce effort and rebuild stocks, the results of the study suggest that management authorities should consider alternative measures in- cluding a moratorium on the use of traps in the off-shore demersal fishery of Abu Dhabi. Keywords: Demography, Stock Assessment, Per Recruit, Population Dynamics, Tropical Fisheries Management 1. Introduction The fisheries of the southern Arabian Gulf provide a source of income, employment and recreation at the same time as contributing to the cultural heritage and food secu- rity of the inhabitants of the coastal states. Fishing in the waters off the Emirate of Abu Dhabi in the United Arab Emirates (UAE) is primarily conducted from traditional wooden dhows and open fibreglass dories. Dome shaped wire traps are the most commonly used fishing gear al- though a variety of other methods exist including; fixed inter-tidal fence nets, gillnets, hand lines and trolling lines. Landings are typically diverse and characteristic of a multi-species tropical fishery, with over 100 species from 35 families being commonly caught. Target species in the demersal fishery are primarily composed of repre- sentatives of the families; Carangidae, Lethrinidae, Hae- mulidae, Serranidae, Siganidae and Sparidae [1]. An extensive fisheries resource survey conducted in UAE waters during 2002 indicated that the stocks of key commercially exploited species had declined to 19% of levels that were present in 1978. The reduction in abun- dance was even more pronounced (13%) for more vul- nerable species such as the orange spotted grouper (Epi- nephelus coioides) [2]. Subsequent fisheries dependent assessments corroborated these results and suggested that 71% of the resource base was over-exploited [1]. For many of the key species, such as Lethrinus nebulosus  E. M. GRANDCOURT ET AL.83 Copyright © 2011 SciRes. OJMS and Diagramma pictum, the relative stock sizes were well below limit biological reference points suggesting that both growth and recruitment over-fishing had oc- curred [3]. The principal critical management issue faced by the off-shore demersal fishery in Abu Dhabi is that the ma- jority of species are being exploited well above sustain- able levels. The excessive fishing effort has even im- pacted the lower trophic groups, such as the Siganidae, which are typically more resilient [4]. Furthermore, the selectivity characteristics of the main gear type (fish traps) resulted in a large proportion of catches being composed of immature fish that had not achieved their full growth potential. More than half of the landed ca- ches of the sparids (Acanthopagrus bifasciatus and Ar- gyrops spinifer) for example were composed of imma- ture fish [5]. Prior to the year 2000, the demersal fishery of Abu Dhabi was largely open access and there were no con- straints on fishing effort. Information on the depleted status of the resource base derived from stock assess- ments prompted authorities to implement a variety of management regulations. Effort reductions were imple- mented at the start of 2004 by limiting the number of fish traps to 125 for each dhow and banning the use of traps by open dories. Traditional dhows previously used an average of 220 fish traps. The simultaneous introduction of gear regulations included the requirement for a stainless steel juvenile escape panel to be fitted to all traps. Given the potential for traps to ‘ghost fish’ after being lost [6], a magnesium/zinc alloy sacrificial anode pin, which allows the panel to open after 2 weeks was also mandatory. In 2001, an on-going catch and effort data recording system and stock monitoring programme for 3 key spe- cies in the demersal trap fishery (D. pictum, E. coioides and L. nebulosus) was implemented [1]. This provided the opportunity to establish demographic and fishery me- trics that relate to the resource status and selectivity characteristics of the demersal trap fishery. In this con- text, the objective of this study was to use a selection of time series metrics to provide an objective evaluation of the effectiveness of effort and gear regulations that were implemented in 2004 as part of a stock re-building man- agement strategy for the off-shore demersal fishery of Abu Dhabi. 2. Materials and Methods 2.1. Study Site and Sampling Protocol Size frequency data was collected from commercial catches of D. Pictum, E. coioides and L. nebulosus made off the coast of the Emirate of Abu Dhabi in the United Arab Emirates (Figure 1) between January 2001 and December 2008. Fish were selected at random from Figure 1. Study site showing the location of the Emirate of Abu Dhabi in the southern Arabian Gulf. 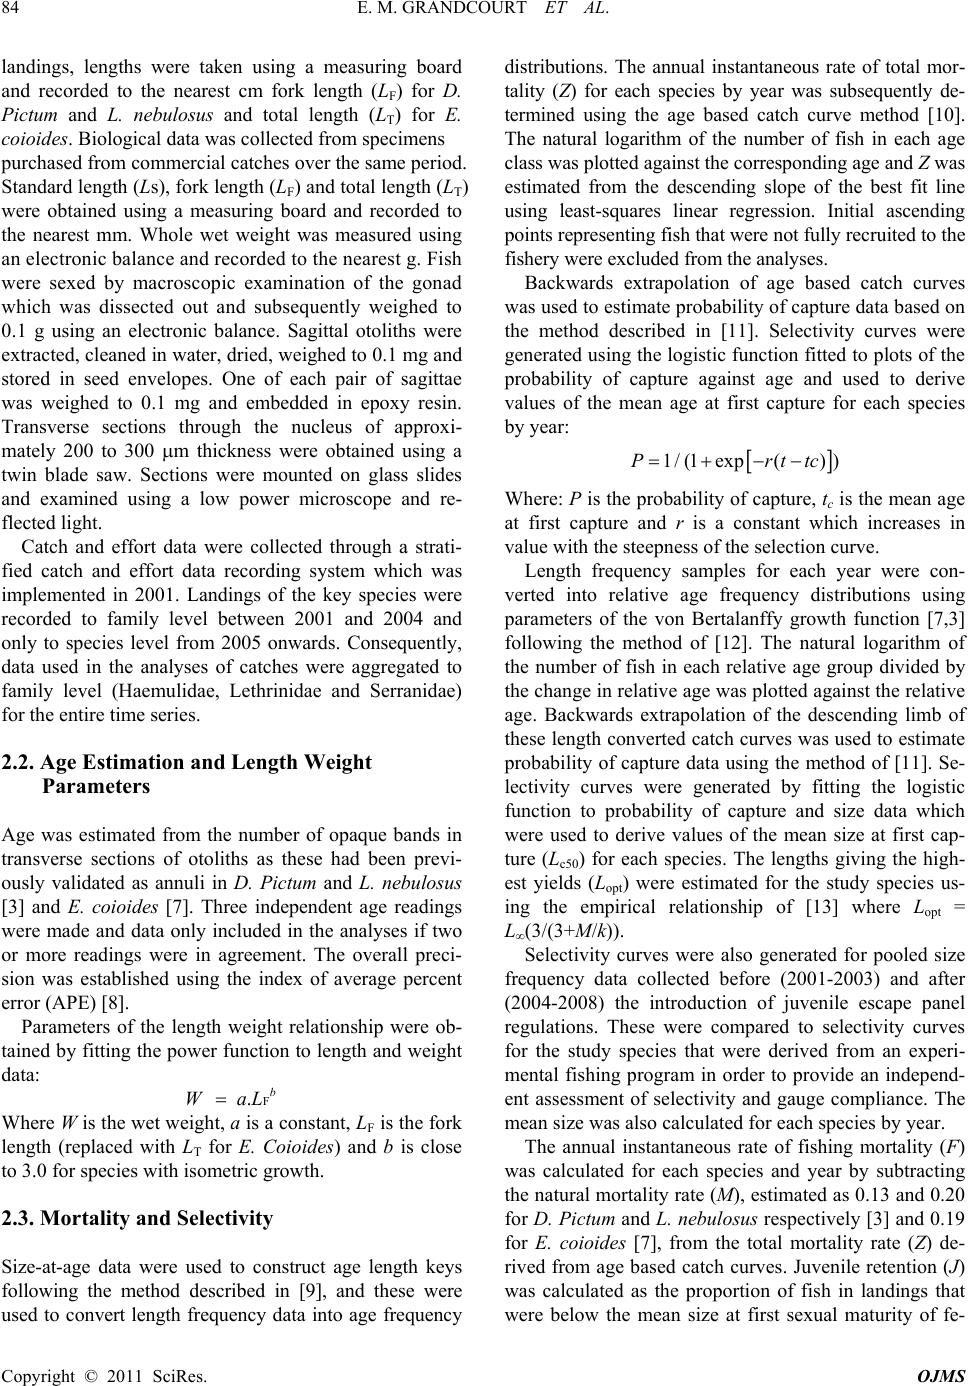 E. M. GRANDCOURT ET AL. 84 landings, lengths were taken using a measuring board and recorded to the nearest cm fork length (LF) for D. Pictum and L. nebulosus and total length (LT) for E. coioides. Biological data was collected from specimens purchased from commercial catches over the same period. Standard length (Ls), fork length (LF) and total length (LT) were obtained using a measuring board and recorded to the nearest mm. Whole wet weight was measured using an electronic balance and recorded to the nearest g. Fish were sexed by macroscopic examination of the gonad which was dissected out and subsequently weighed to 0.1 g using an electronic balance. Sagittal otoliths were extracted, cleaned in water, dried, weighed to 0.1 mg and stored in seed envelopes. One of each pair of sagittae was weighed to 0.1 mg and embedded in epoxy resin. Transverse sections through the nucleus of approxi- mately 200 to 300 m thickness were obtained using a twin blade saw. Sections were mounted on glass slides and examined using a low power microscope and re- flected light. Copyright © 2011 SciRes. OJMS Catch and effort data were collected through a strati- fied catch and effort data recording system which was implemented in 2001. Landings of the key species were recorded to family level between 2001 and 2004 and only to species level from 2005 onwards. Consequently, data used in the analyses of catches were aggregated to family level (Haemulidae, Lethrinidae and Serranidae) for the entire time series. 2.2. Age Estimation and Length Weight Parameters Age was estimated from the number of opaque bands in transverse sections of otoliths as these had been previ- ously validated as annuli in D. Pictum and L. nebulosus [3] and E. coioides [7]. Three independent age readings were made and data only included in the analyses if two or more readings were in agreement. The overall preci- sion was established using the index of average percent error (APE) [8]. Parameters of the length weight relationship were ob- tained by fitting the power function to length and weight data: F . b WaL Where W is the wet weight, a is a constant, L F is the fork length (replaced with L T for E. Coioides) and b is close to 3.0 for species with isometric growth. 2.3. Mortality and Selectivity Size-at-age data were used to construct age length keys following the method described in [9], and these were used to convert length frequency data into age frequency distributions. The annual instantaneous rate of total mor- tality (Z) for each species by year was subsequently de- termined using the age based catch curve method [10]. The natural logarithm of the number of fish in each age class was plotted against the corresponding age and Z was estimated from the descending slope of the best fit line using least-squares linear regression. Initial ascending points representing fish that were not fully recruited to the fishery were excluded from the analyses. Backwards extrapolation of age based catch curves was used to estimate probability of capture data based on the method described in [11]. Selectivity curves were generated using the logistic function fitted to plots of the probability of capture against age and used to derive values of the mean age at first capture for each species by year: 1/(1exp() )Prttc Where: P is the probability of capture, tc is the mean age at first capture and r is a constant which increases in value with the steepness of the selection curve. Length frequency samples for each year were con- verted into relative age frequency distributions using parameters of the von Bertalanffy growth function [7,3] following the method of [12]. The natural logarithm of the number of fish in each relative age group divided by the change in relative age was plotted against the relative age. Backwards extrapolation of the descending limb of these length converted catch curves was used to estimate probability of capture data using the method of [11]. Se- lectivity curves were generated by fitting the logistic function to probability of capture and size data which were used to derive values of the mean size at first cap- ture (Lc50) for each species. The lengths giving the high- est yields (Lopt) were estimated for the study species us- ing the empirical relationship of [13] where Lopt = L(3/(3+M/k)). Selectivity curves were also generated for pooled size frequency data collected before (2001-2003) and after (2004-2008) the introduction of juvenile escape panel regulations. These were compared to selectivity curves for the study species that were derived from an experi- mental fishing program in order to provide an independ- ent assessment of selectivity and gauge compliance. The mean size was also calculated for each species by year. The annual instantaneous rate of fishing mortality (F) was calculated for each species and year by subtracting the natural mortality rate (M), estimated as 0.13 and 0.20 for D. Pictum and L. nebulosus respectively [3] and 0.19 for E. coioides [7], from the total mortality rate (Z) de- rived from age based catch curves. Juvenile retention (J) was calculated as the proportion of fish in landings that were below the mean size at first sexual maturity of fe- 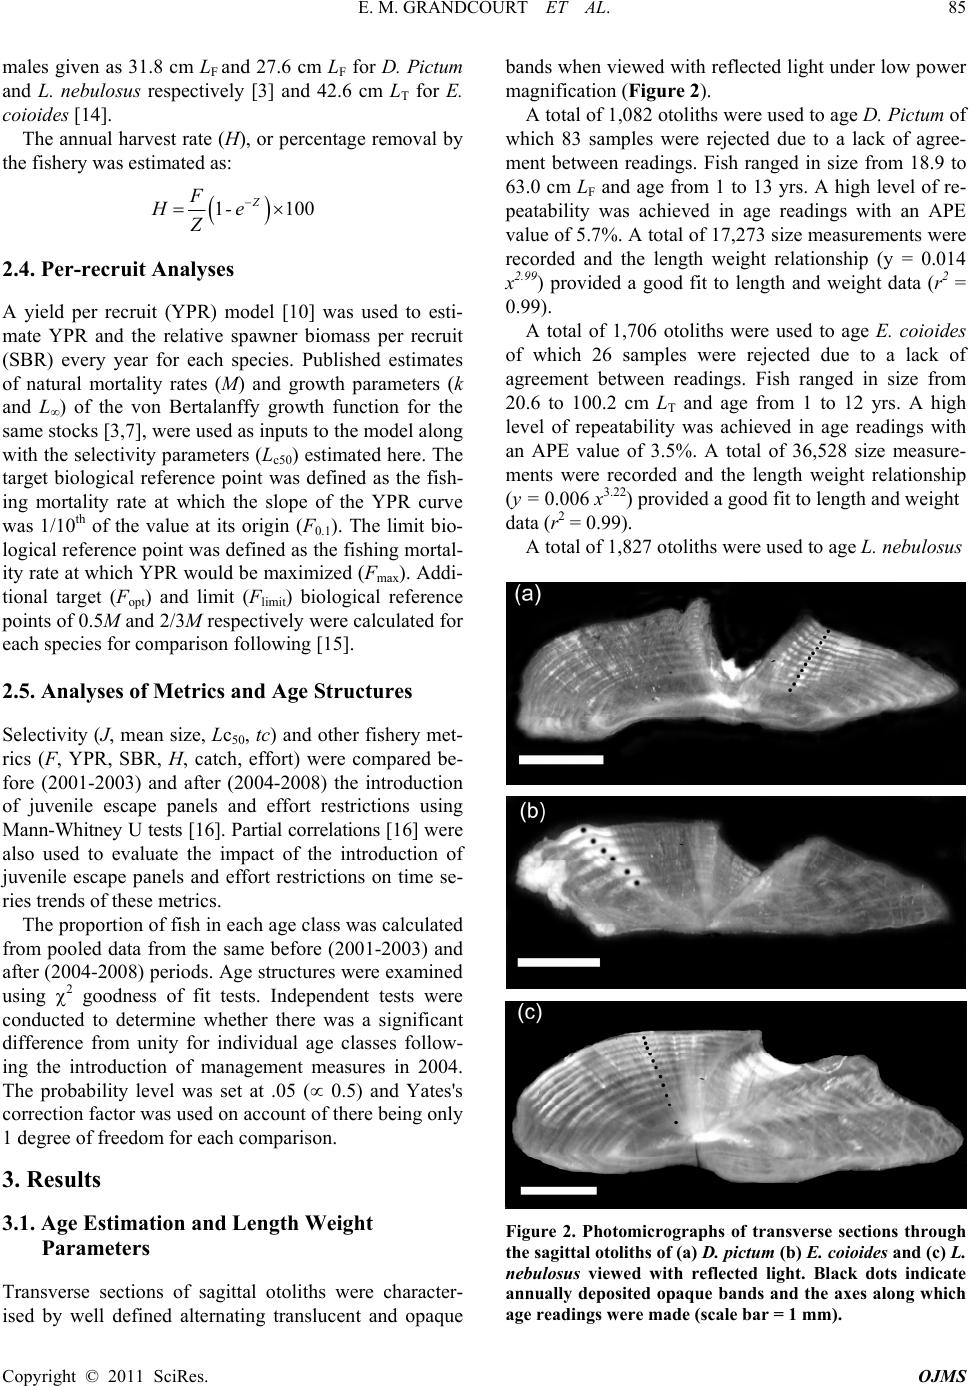 E. M. GRANDCOURT ET AL.85 Copyright © 2011 SciRes. OJMS males given as 31.8 cm LF and 27.6 cm LF for D. Pictum and L. nebulosus respectively [3] and 42.6 cm LT for E. coioides [14]. The annual harvest rate (H), or percentage removal by the fishery was estimated as: 11 Z F H -e00 Z 2.4. Per-recruit Analyses A yield per recruit (YPR) model [10] was used to esti- mate YPR and the relative spawner biomass per recruit (SBR) every year for each species. Published estimates of natural mortality rates (M) and growth parameters (k and L) of the von Bertalanffy growth function for the same stocks [3,7], were used as inputs to the model along with the selectivity parameters (Lc50) estimated here. The target biological reference point was defined as the fish- ing mortality rate at which the slope of the YPR curve was 1/10th of the value at its origin (F0.1). The limit bio- logical reference point was defined as the fishing mortal- ity rate at which YPR would be maximized (Fmax). Addi- tional target (Fopt) and limit (Flimit) biological reference points of 0.5M and 2/3M respectively were calculated for each species for comparison following [15]. 2.5. Analyses of Metrics and Age Structures Selectivity (J, mean size, Lc50, tc) and other fishery met- rics (F, YPR, SBR, H, catch, effort) were compared be- fore (2001-2003) and after (2004-2008) the introduction of juvenile escape panels and effort restrictions using Mann-Whitney U tests [16]. Partial correlations [16] were also used to evaluate the impact of the introduction of juvenile escape panels and effort restrictions on time se- ries trends of these metrics. The proportion of fish in each age class was calculated from pooled data from the same before (2001-2003) and after (2004-2008) periods. Age structures were examined using 2 goodness of fit tests. Independent tests were conducted to determine whether there was a significant difference from unity for individual age classes follow- ing the introduction of management measures in 2004. The probability level was set at .05 ( 0.5) and Yates's correction factor was used on account of there being only 1 degree of freedom for each comparison. 3. Results 3.1. Age Estimation and Length Weight Parameters Transverse sections of sagittal otoliths were character- ised by well defined alternating translucent and opaque bands when viewed with reflected light under low power magnification (Figure 2). A total of 1,082 otoliths were used to age D. Pictum of which 83 samples were rejected due to a lack of agree- ment between readings. Fish ranged in size from 18.9 to 63.0 cm LF and age from 1 to 13 yrs. A high level of re- peatability was achieved in age readings with an APE value of 5.7%. A total of 17,273 size measurements were recorded and the length weight relationship (y = 0.014 x2.99) provided a good fit to length and weight data (r2 = 0.99). A total of 1,706 otoliths were used to age E. coioides of which 26 samples were rejected due to a lack of agreement between readings. Fish ranged in size from 20.6 to 100.2 cm LT and age from 1 to 12 yrs. A high level of repeatability was achieved in age readings with an APE value of 3.5%. A total of 36,528 size measure- ments were recorded and the length weight relationship (y = 0.006 x3.22) provided a good fit to length and weight data (r2 = 0.99). A total of 1,827 otoliths were used to age L. nebulosus Figure 2. Photomicrographs of transverse sections through the sagittal otoliths of (a) D. pictum (b) E. coioides and (c) L. nebulosus viewed with reflected light. Black dots indicate annually deposited opaque bands and the axes along which age readings were made (scale bar = 1 mm). 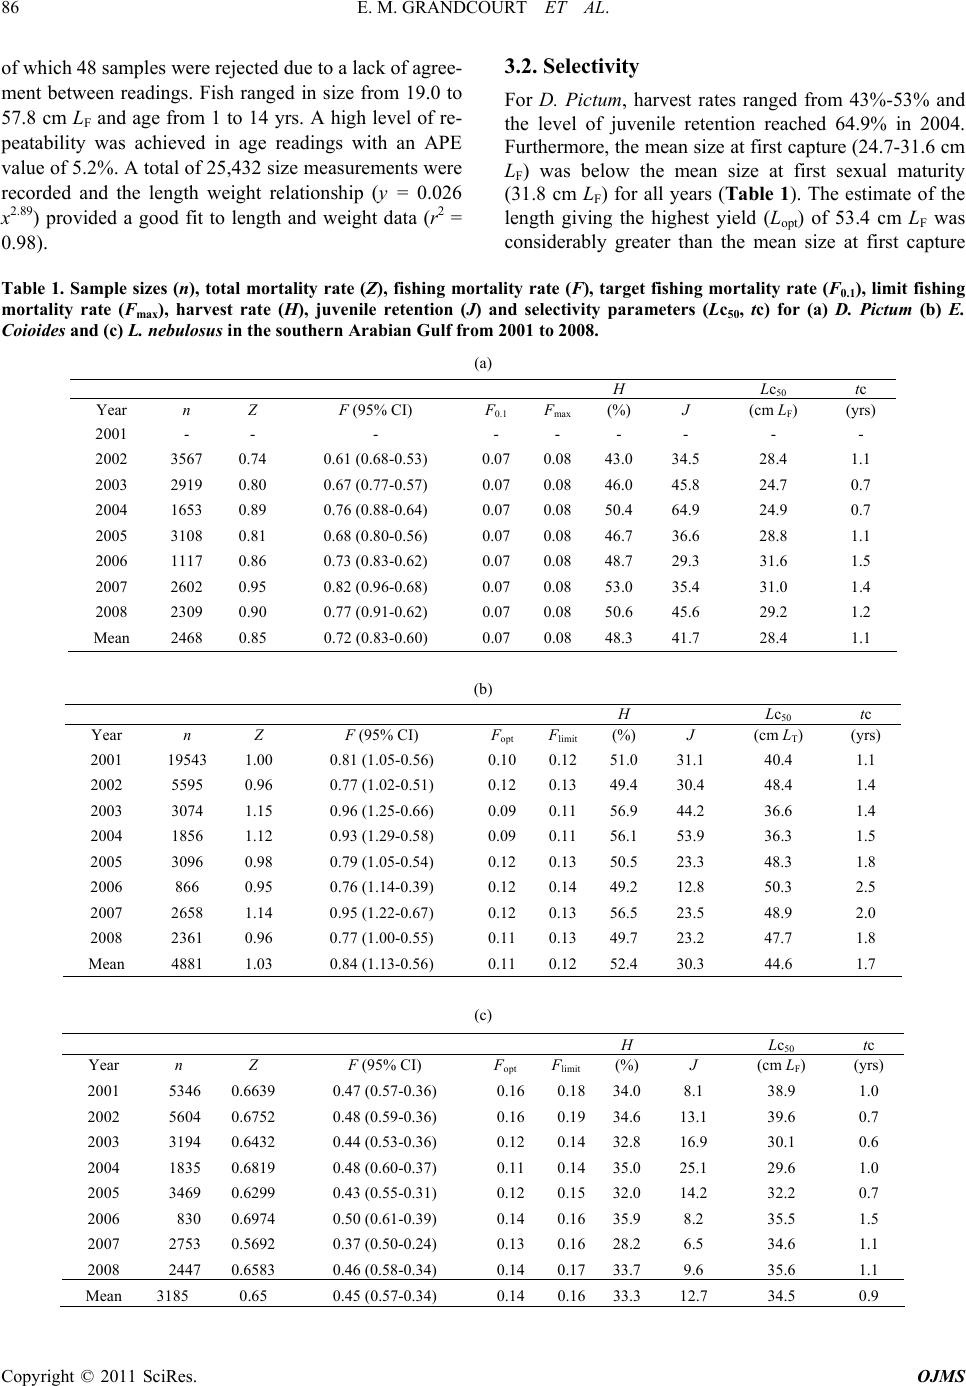 E. M. GRANDCOURT ET AL. Copyright © 2011 SciRes. OJMS 86 of which 48 samples were rejected due to a lack of agree- ment between readings. Fish ranged in size from 19.0 to 57.8 cm LF and age from 1 to 14 yrs. A high level of re- peatability was achieved in age readings with an APE value of 5.2%. A total of 25,432 size measurements were recorded and the length weight relationship (y = 0.026 x2.89) provided a good fit to length and weight data (r2 = 0.98). 3.2. Selectivity For D. Pictum, harvest rates ranged from 43%-53% and the level of juvenile retention reached 64.9% in 2004. Furthermore, the mean size at first capture (24.7-31.6 cm LF) was below the mean size at first sexual maturity (31.8 cm LF) for all years (Table 1). The estimate of the length giving the highest yield (Lopt) of 53.4 cm LF was considerably greater than the mean size at first capture Table 1. Sample sizes (n), total mortality rate (Z), fishing mortality rate (F), target fishing mortality rate (F 0.1 ), limit fishing mortality rate (F max ), harvest rate (H), juvenile retention (J) and selectivity parameters (Lc 50 , tc) for (a) D. Pictum (b) E. Coioides and (c) L. nebulosus in the southern Arabian Gulf from 2001 to 2008. (a) H Lc 50 tc Year n Z F (95% CI) F 0.1 F max (%) J (cm L F ) (yrs) 2001 - - - - - - - - - 2002 3567 0.74 0.61 (0.68-0.53) 0.07 0.08 43.0 34.5 28.4 1.1 2003 2919 0.80 0.67 (0.77-0.57) 0.07 0.08 46.0 45.8 24.7 0.7 2004 1653 0.89 0.76 (0.88-0.64) 0.07 0.08 50.4 64.9 24.9 0.7 2005 3108 0.81 0.68 (0.80-0.56) 0.07 0.08 46.7 36.6 28.8 1.1 2006 1117 0.86 0.73 (0.83-0.62) 0.07 0.08 48.7 29.3 31.6 1.5 2007 2602 0.95 0.82 (0.96-0.68) 0.07 0.08 53.0 35.4 31.0 1.4 2008 2309 0.90 0.77 (0.91-0.62) 0.07 0.08 50.6 45.6 29.2 1.2 Mean 2468 0.85 0.72 (0.83-0.60) 0.07 0.08 48.3 41.7 28.4 1.1 (b) H Lc 50 tc Year n Z F (95% CI) F opt F limit (%) J (cm L T ) (yrs) 2001 19543 1.00 0.81 (1.05-0.56) 0.10 0.12 51.0 31.1 40.4 1.1 2002 5595 0.96 0.77 (1.02-0.51) 0.12 0.13 49.4 30.4 48.4 1.4 2003 3074 1.15 0.96 (1.25-0.66) 0.09 0.11 56.9 44.2 36.6 1.4 2004 1856 1.12 0.93 (1.29-0.58) 0.09 0.11 56.1 53.9 36.3 1.5 2005 3096 0.98 0.79 (1.05-0.54) 0.12 0.13 50.5 23.3 48.3 1.8 2006 866 0.95 0.76 (1.14-0.39) 0.12 0.14 49.2 12.8 50.3 2.5 2007 2658 1.14 0.95 (1.22-0.67) 0.12 0.13 56.5 23.5 48.9 2.0 2008 2361 0.96 0.77 (1.00-0.55) 0.11 0.13 49.7 23.2 47.7 1.8 Mean 4881 1.03 0.84 (1.13-0.56) 0.11 0.12 52.4 30.3 44.6 1.7 (c) H Lc 50 tc Year n Z F (95% CI) F opt F limit (%) J (cm L F ) (yrs) 2001 5346 0.6639 0.47 (0.57-0.36) 0.160.1834.0 8.1 38.9 1.0 2002 5604 0.6752 0.48 (0.59-0.36) 0.160.1934.6 13.1 39.6 0.7 2003 3194 0.6432 0.44 (0.53-0.36) 0.120.1432.8 16.9 30.1 0.6 2004 1835 0.6819 0.48 (0.60-0.37) 0.110.1435.0 25.1 29.6 1.0 2005 3469 0.6299 0.43 (0.55-0.31) 0.120.1532.0 14.2 32.2 0.7 2006 830 0.6974 0.50 (0.61-0.39) 0.140.1635.9 8.2 35.5 1.5 2007 2753 0.5692 0.37 (0.50-0.24) 0.130.1628.2 6.5 34.6 1.1 2008 2447 0.6583 0.46 (0.58-0.34) 0.140.1733.7 9.6 35.6 1.1 Mean 3185 0.65 0.45 (0.57-0.34) 0.140.1633.3 12.7 34.5 0.9 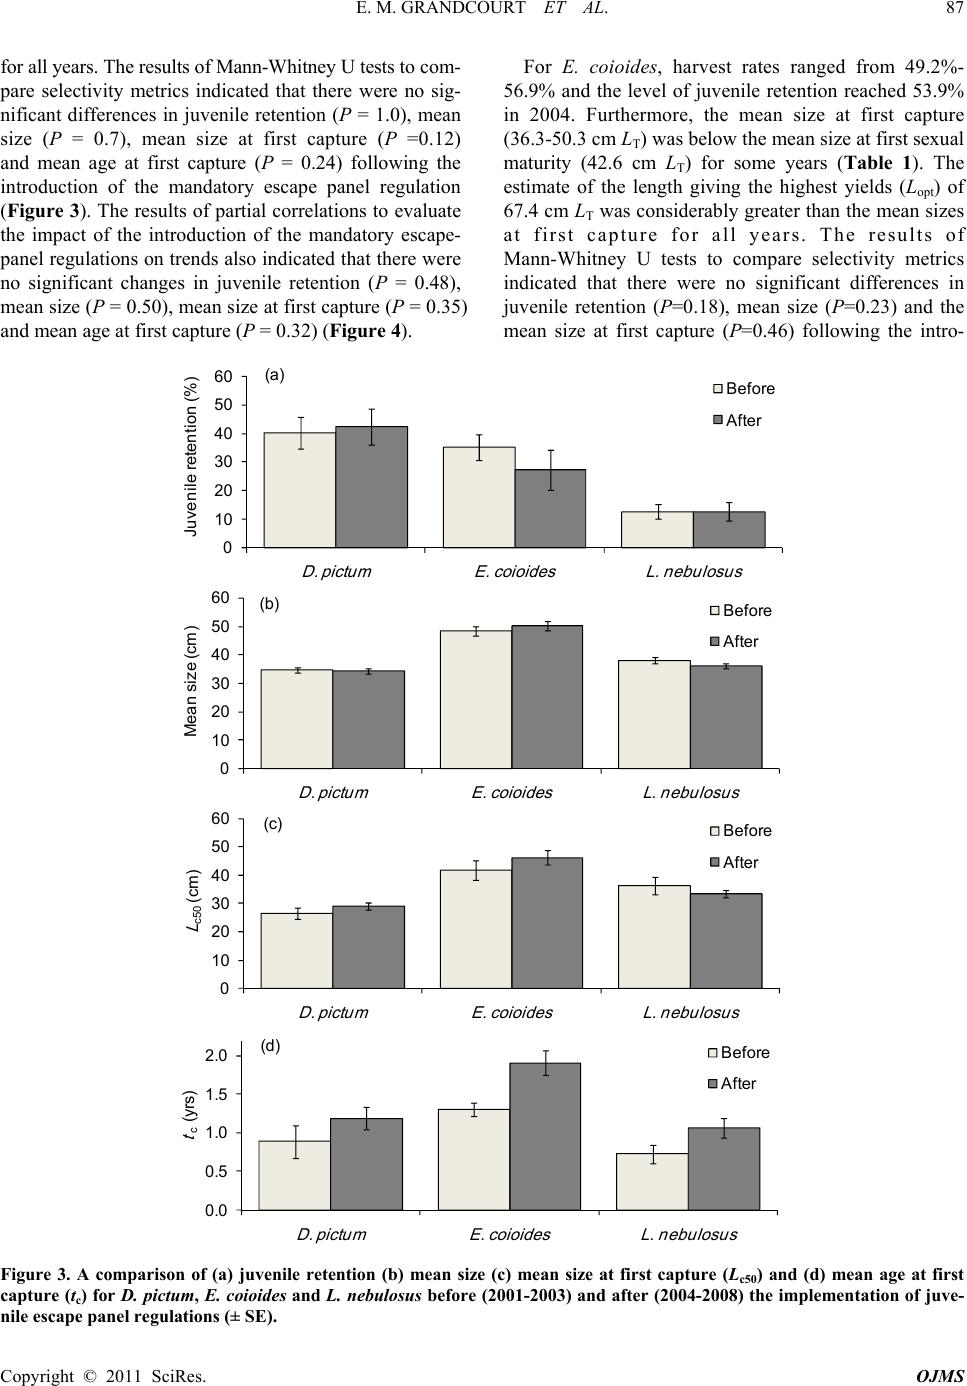 E. M. GRANDCOURT ET AL. 87 for all years. The results of Mann-Whitney U tests to com- pare selectivity metrics indicated that there were no sig- nificant differences in juvenile retention (P = 1.0), mean size (P = 0.7), mean size at first capture (P =0.12) and mean age at first capture (P = 0.24) following the introduction of the mandatory escape panel regulation (Figure 3). The results of partial correlations to evaluate the impact of the introduction of the mandatory escape- panel regulations on trends also indicated that there were no significant changes in juvenile retention (P = 0.48), mean size (P = 0.50), mean size at first capture (P = 0.35) and mean age at first capture (P = 0.32) (Figure 4). For E. coioides, harvest rates ranged from 49.2%- 56.9% and the level of juvenile retention reached 53.9% in 2004. Furthermore, the mean size at first capture (36.3-50.3 cm LT) was below the mean size at first sexual maturity (42.6 cm LT) for some years (Table 1). The estimate of the length giving the highest yields (Lopt) of 67.4 cm LT was considerably greater than the mean sizes at first capture for all years. The results of Mann-Whitney U tests to compare selectivity metrics indicated that there were no significant differences in juvenile retention (P=0.18), mean size (P=0.23) and the mean size at first capture (P=0.46) following the intro- 0 10 20 30 40 50 60 D. pict umE. coioidesL. nebulosus Before After Juvenile retention (%) 0 10 20 30 40 50 60 D. pict umE. coioidesL. nebulosus Before After Meansize (cm) (b) 0 10 20 30 40 50 60 D. pict u m E. co io id e s L. nebulosu s Before After L c50 (cm) (c) 0.0 0.5 1.0 1.5 2.0 D. pict u m E. co io id e s L. nebulosu s Before After t c (yrs) (d) (a ) Figure 3. A comparison of (a) juvenile retention (b) mean size (c) mean size at first capture (L c50 ) and (d) mean age at first capture (t c ) for D. pictum, E. coioides and L. nebulosus before (2001-2003) and after (2004-2008) the implementation of juve- nile escape panel regulations (± SE). Copyright © 2011 SciRes. OJMS 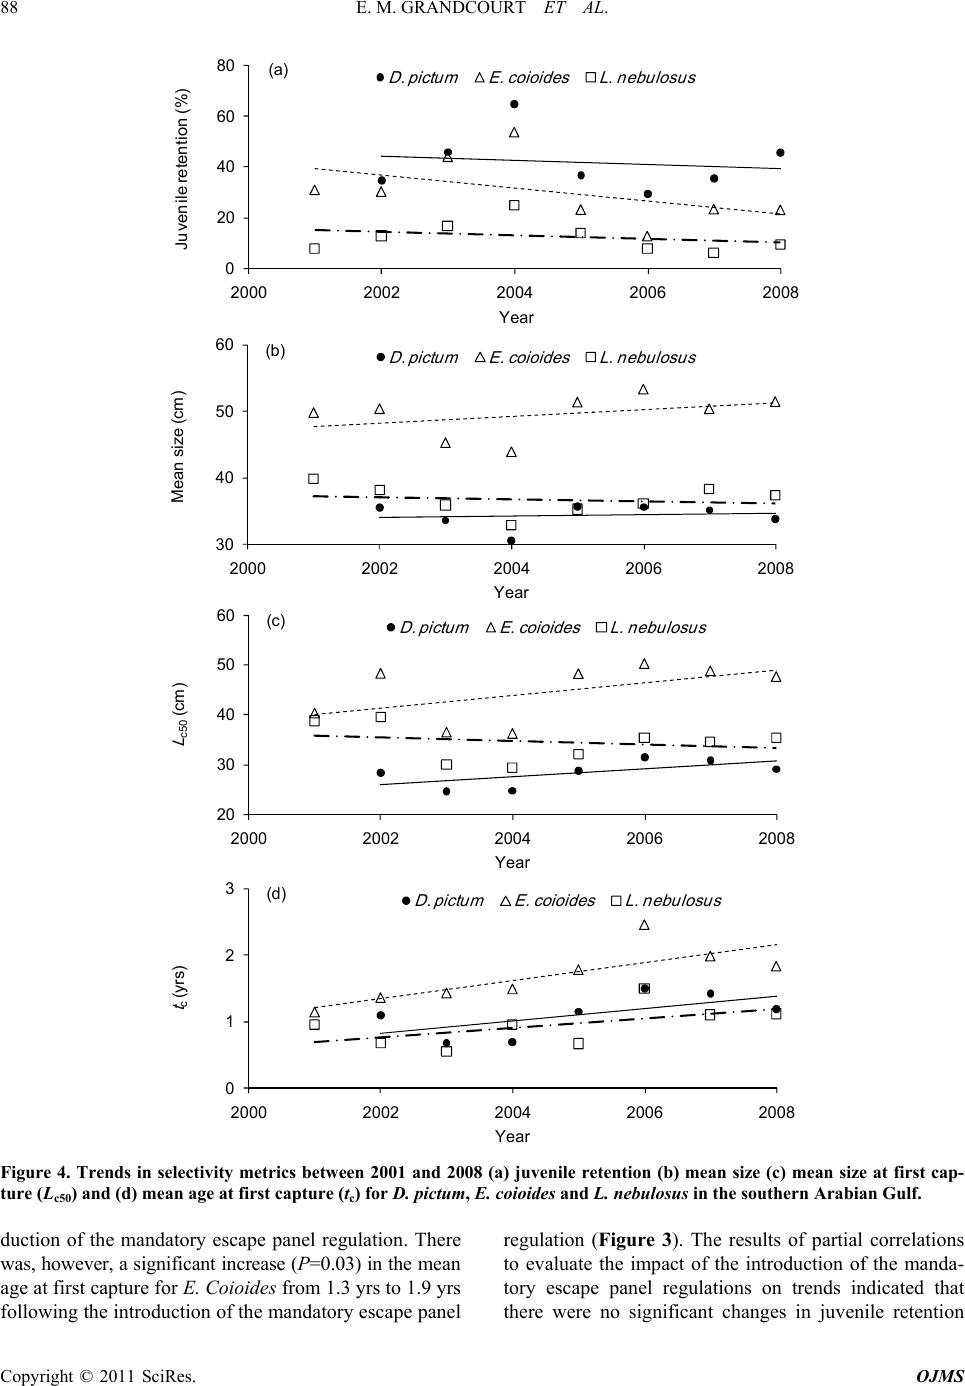 E. M. GRANDCOURT ET AL. 88 Copyright © 2011 SciRes. OJMS 0 20 40 60 80 2000 2002 2004 2006 2008 D. pict umE. coio id e sL. nebulosus Year Juvenile retention (%) 30 40 50 60 2000 2002 2004 2006 2008 D. pict umE. coio id e sL. nebulosus Year Mean size (cm) (b ) 20 30 40 50 60 2000 2002 2004 2006 2008 D. pict umE. coio id e sL. nebulosus Year L c50 (cm) (c) 0 1 2 3 2000 2002 2004 2006 2008 D. pict umE. c o io id e sL. nebulosus Year t c (yrs) (d) (a) Figure 4. Trends in selectivity metrics between 2001 and 2008 (a) juvenile retention (b) mean size (c) mean size at first cap- ture (L c50 ) and (d) mean age at first capture (t c ) for D. pictum, E. coioides and L. nebulosus in the southern Arabian Gulf. duction of the mandatory escape panel regulation. There was, however, a significant increase (P=0.03) in the mean age at first capture for E. Coioides from 1.3 yrs to 1.9 yrs following the introduction of the mandatory escape panel regulation (Figure 3). The results of partial correlations to evaluate the impact of the introduction of the manda- tory escape panel regulations on trends indicated that there were no significant changes in juvenile retention 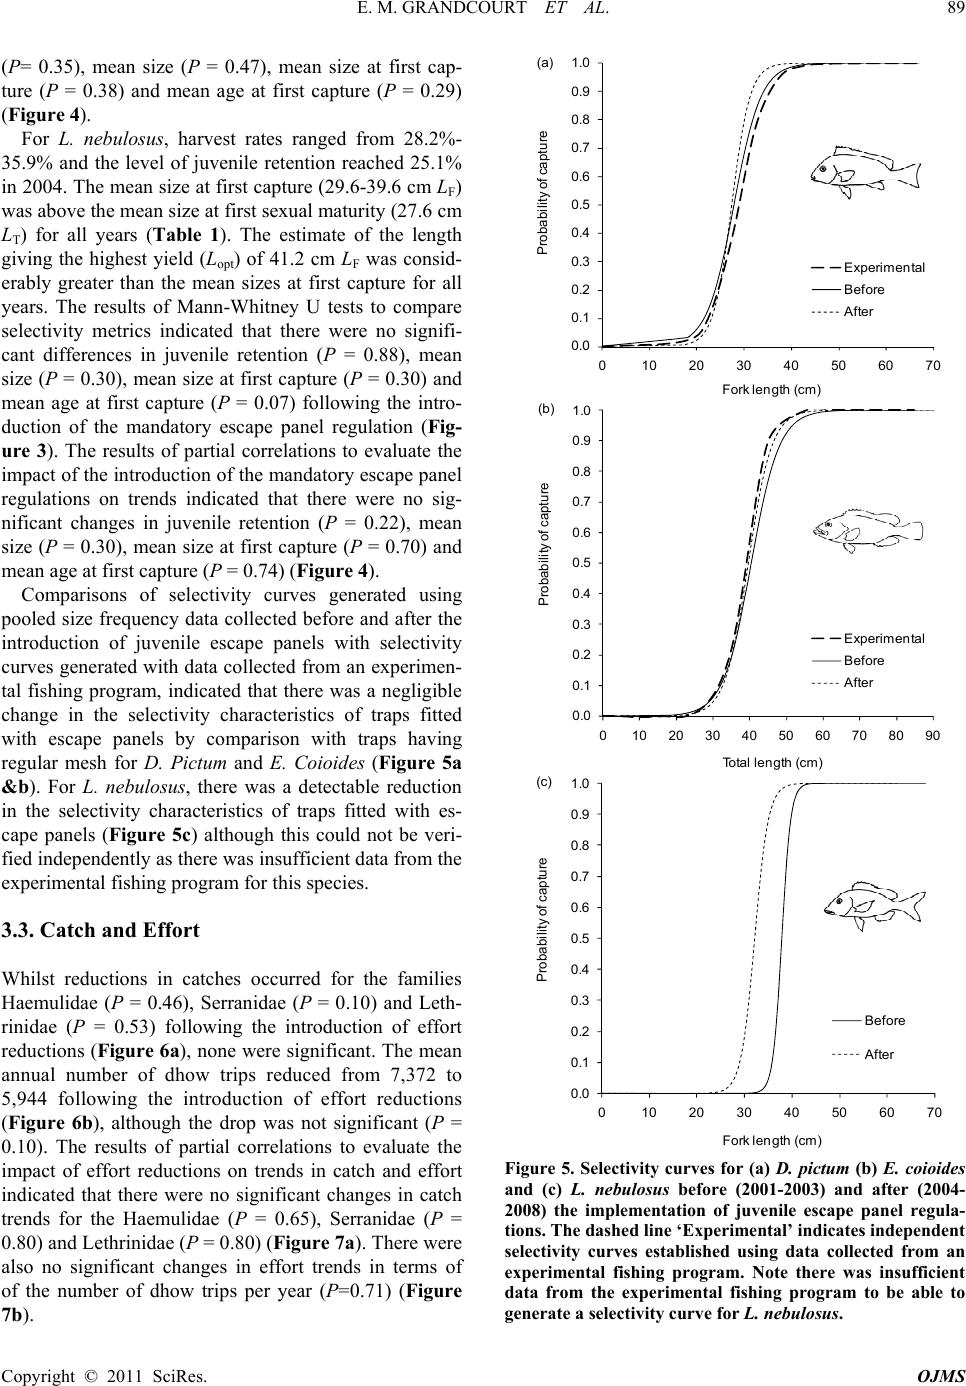 E. M. GRANDCOURT ET AL.89 Copyright © 2011 SciRes. OJMS (P= 0.35), mean size (P = 0.47), mean size at first cap- ture (P = 0.38) and mean age at first capture (P = 0.29) (Figure 4). For L. nebulosus, harvest rates ranged from 28.2%- 35.9% and the level of juvenile retention reached 25.1% in 2004. The mean size at first capture (29.6-39.6 cm LF) was above the mean size at first sexual maturity (27.6 cm LT) for all years (Table 1). The estimate of the length giving the highest yield (Lopt) of 41.2 cm LF was consid- erably greater than the mean sizes at first capture for all years. The results of Mann-Whitney U tests to compare selectivity metrics indicated that there were no signifi- cant differences in juvenile retention (P = 0.88), mean size (P = 0.30), mean size at first capture (P = 0.30) and mean age at first capture (P = 0.07) following the intro- duction of the mandatory escape panel regulation (Fig- ure 3). The results of partial correlations to evaluate the impact of the introduction of the mandatory escape panel regulations on trends indicated that there were no sig- nificant changes in juvenile retention (P = 0.22), mean size (P = 0.30), mean size at first capture (P = 0.70) and mean age at first capture (P = 0.74) (Figure 4). Comparisons of selectivity curves generated using pooled size frequency data collected before and after the introduction of juvenile escape panels with selectivity curves generated with data collected from an experimen- tal fishing program, indicated that there was a negligible change in the selectivity characteristics of traps fitted with escape panels by comparison with traps having regular mesh for D. Pictum and E. Coioides (Figure 5a &b). For L. nebulosus, there was a detectable reduction in the selectivity characteristics of traps fitted with es- cape panels (Figure 5c) although this could not be veri- fied independently as there was insufficient data from the experimental fishing program for this species. 3.3. Catch and Effort Whilst reductions in catches occurred for the families Haemulidae (P = 0.46), Serranidae (P = 0.10) and Leth- rinidae (P = 0.53) following the introduction of effort reductions (Figure 6a), none were significant. The mean annual number of dhow trips reduced from 7,372 to 5,944 following the introduction of effort reductions (Figure 6b), although the drop was not significant (P = 0.10). The results of partial correlations to evaluate the impact of effort reductions on trends in catch and effort indicated that there were no significant changes in catch trends for the Haemulidae (P = 0.65), Serranidae (P = 0.80) and Lethrinidae (P = 0.80) (Figure 7a). There were also no significant changes in effort trends in terms of of the number of dhow trips per year (P=0.71) (Figure 7b). 0.0 0.1 0.2 0.3 0.4 0.5 0.6 0.7 0.8 0.9 1.0 0 1020304050607 Probability of capture Fork length (cm) 0 Experimental Before After (a) 0.0 0.1 0.2 0.3 0.4 0.5 0.6 0.7 0.8 0.9 1.0 0 102030405060708090 Probability of capture Total length (cm) Experimental Before After (b) 0.0 0.1 0.2 0.3 0.4 0.5 0.6 0.7 0.8 0.9 1.0 0 1020304050607 Pr obabilit y of c apt ure Fork length (cm) 0 Before After (c) Figure 5. Selectivity curves for (a) D. pictum (b) E. coioides and (c) L. nebulosus before (2001-2003) and after (2004- 2008) the implementation of juvenile escape panel regula- tions. The dashed line ‘Experimental’ indicates independent selectivity curves established using data collected from an experimental fishing program. Note there was insufficient data from the experimental fishing program to be able to generate a selectivity curve for L. nebulosus. 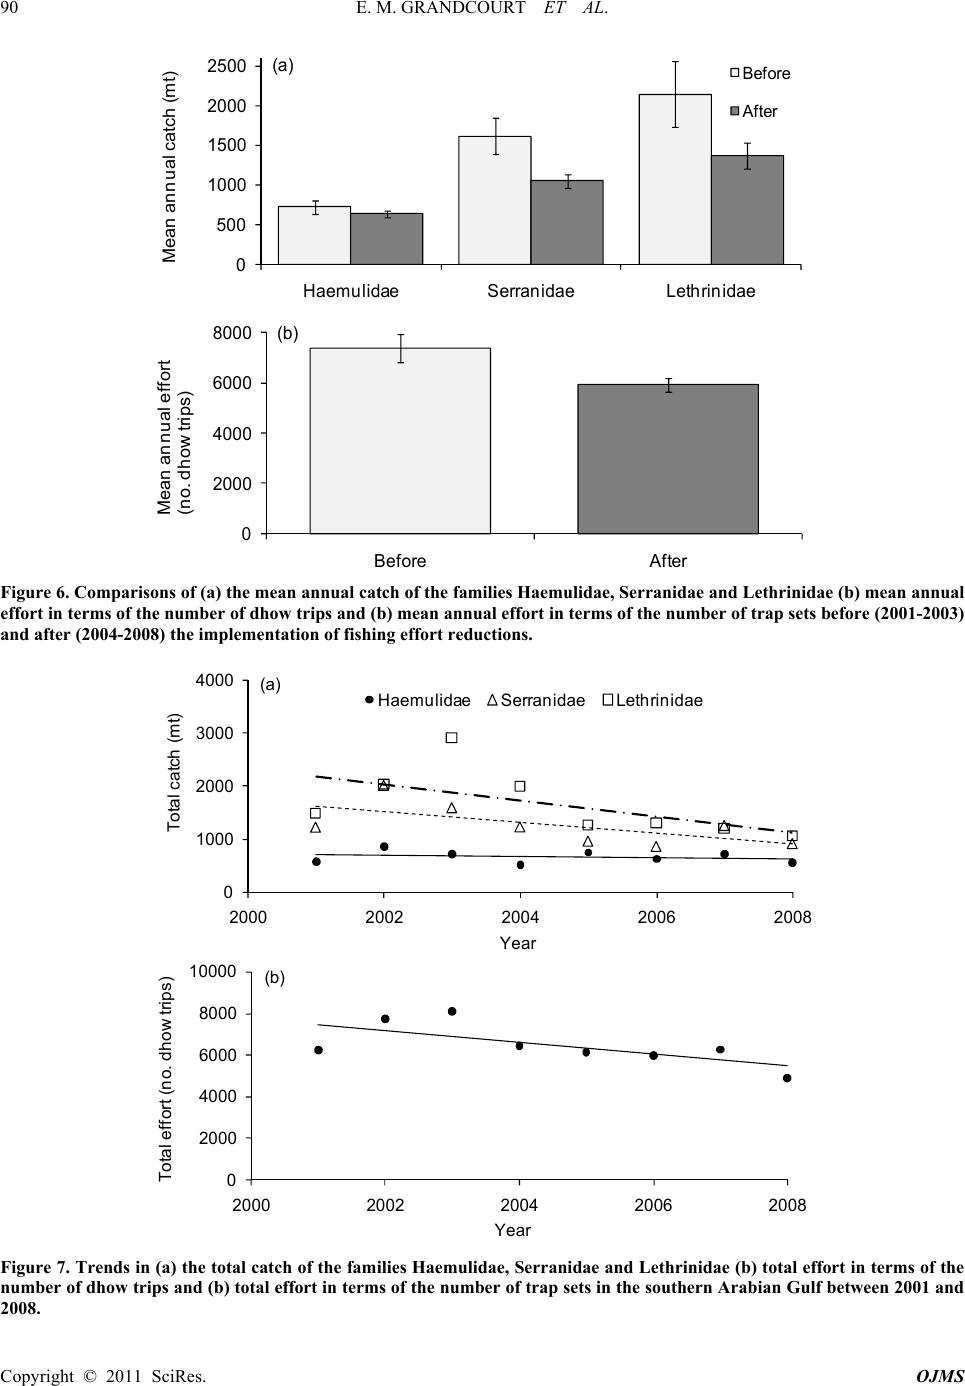 E. M. GRANDCOURT ET AL. 90 0 500 1000 1500 2000 2500 HaemulidaeSerranidaeLethrinidae Before After Mean annual catch (mt) 0 2000 4000 6000 8000 Before After Mean annual effort (no.dhow trips) (b) (a) Figure 6. Comparisons of (a) the mean annual catch of the families Haemulidae, Serranidae and Lethrinidae (b) mean annual effort in terms of the number of dhow trips and (b) mean annual effort in terms of the number of trap sets before (2001-2003) and after (2004-2008) the implementation of fishing effort reductions. 0 1000 2000 3000 4000 2000 2002 2004 2006 2008 Haemulidae Serranidae Lethrinidae Year Totalcatch (mt ) 0 2000 4000 6000 8000 10000 2000 2002 2004 2006 2008 Year Total effor t ( no. dhow trips) (b) (a) Figure 7. Trends in (a) the total catch of the families Haemulidae, Serranidae and Lethrinidae (b) total effort in terms of the number of dhow trips and (b) total effort in terms of the number of trap sets in the southern Arabian Gulf between 2001 and 2008. Copyright © 2011 SciRes. OJMS 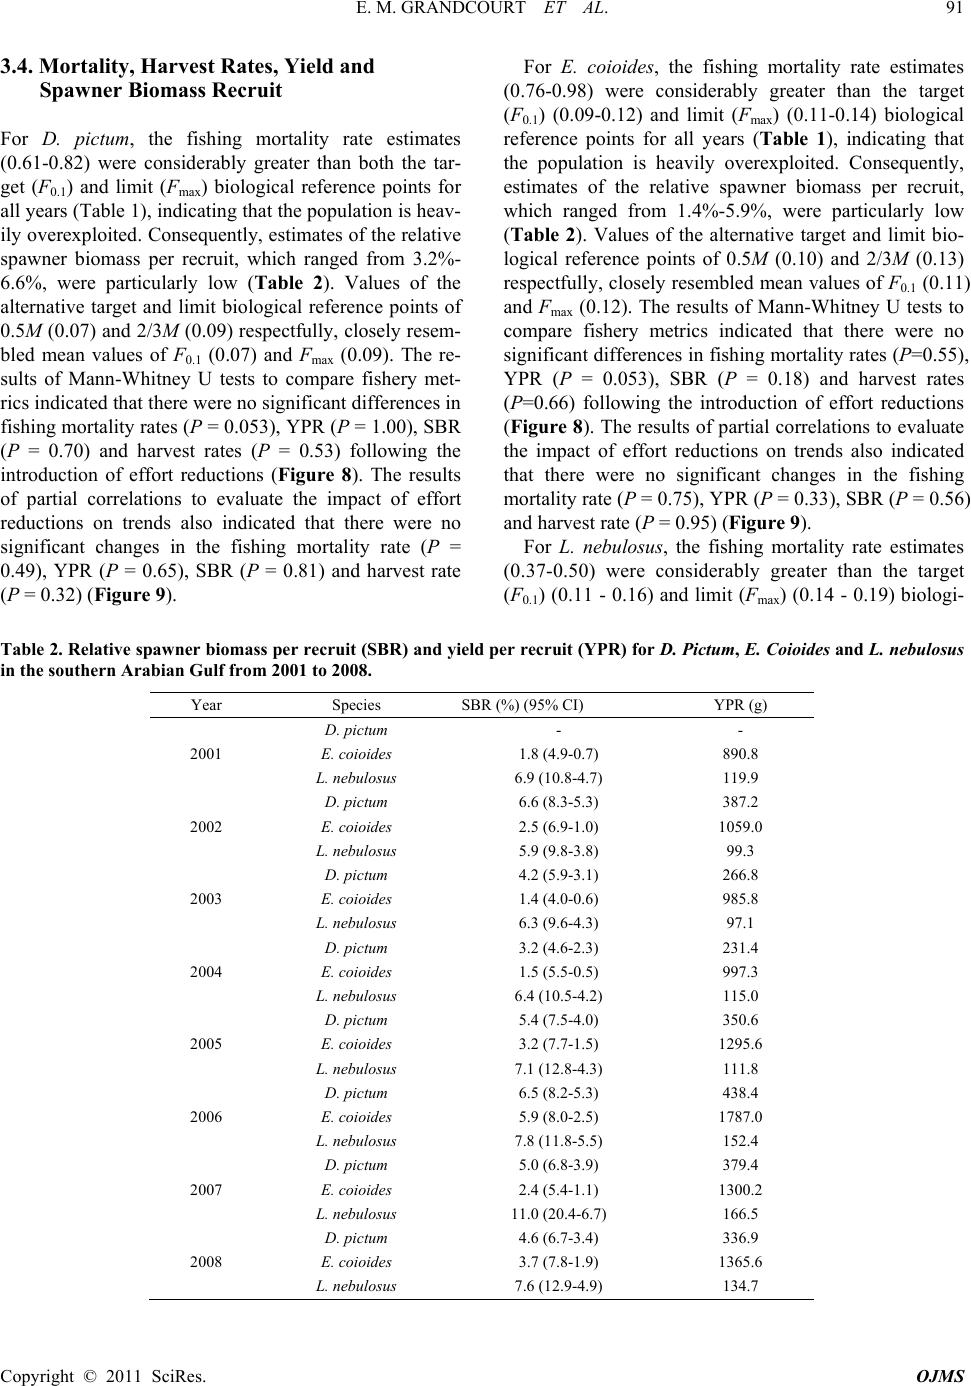 E. M. GRANDCOURT ET AL. 91 Copyright © 2011 SciRes. OJMS 3.4. Mortality, Harvest Rates, Yield and Spawner Biomass Recruit For D. pictum, the fishing mortality rate estimates (0.61-0.82) were considerably greater than both the tar- get (F0.1) and limit (Fmax) biological reference points for all years (Table 1), indicating that the population is heav- ily overexploited. Consequently, estimates of the relative spawner biomass per recruit, which ranged from 3.2%- 6.6%, were particularly low (Table 2). Values of the alternative target and limit biological reference points of 0.5M (0.07) and 2/3M (0.09) respectfully, closely resem- bled mean values of F0.1 (0.07) and Fmax (0.09). The re- sults of Mann-Whitney U tests to compare fishery met- rics indicated that there were no significant differences in fishing mortality rates (P = 0.053), YPR (P = 1.00), SBR (P = 0.70) and harvest rates (P = 0.53) following the introduction of effort reductions (Figure 8). The results of partial correlations to evaluate the impact of effort reductions on trends also indicated that there were no significant changes in the fishing mortality rate (P = 0.49), YPR (P = 0.65), SBR (P = 0.81) and harvest rate (P = 0.32) (Figure 9). For E. coioides, the fishing mortality rate estimates (0.76-0.98) were considerably greater than the target (F0.1) (0.09-0.12) and limit (Fmax) (0.11-0.14) biological reference points for all years (Table 1), indicating that the population is heavily overexploited. Consequently, estimates of the relative spawner biomass per recruit, which ranged from 1.4%-5.9%, were particularly low (Table 2). Values of the alternative target and limit bio- logical reference points of 0.5M (0.10) and 2/3M (0.13) respectfully, closely resembled mean values of F0.1 (0.11) and Fmax (0.12). The results of Mann-Whitney U tests to compare fishery metrics indicated that there were no significant differences in fishing mortality rates (P=0.55), YPR (P = 0.053), SBR (P = 0.18) and harvest rates (P=0.66) following the introduction of effort reductions (Figure 8). The results of partial correlations to evaluate the impact of effort reductions on trends also indicated that there were no significant changes in the fishing mortality rate (P = 0.75), YPR (P = 0.33), SBR (P = 0.56) and harvest rate (P = 0.95) (Fi gur e 9). For L. nebulosus, the fishing mortality rate estimates (0.37-0.50) were considerably greater than the target (F0.1) (0.11 - 0.16) and limit (Fmax) (0.14 - 0.19) biologi- Table 2. Relative spawner biomass per recruit (SBR) and yield per recruit (YPR) for D. Pictum, E. Coioides and L. nebulosus in the southern Arabian Gulf from 2001 to 2008. Year Species SBR (%) (95% CI) YPR (g) D. pictum - - 2001 E. coioides 1.8 (4.9-0.7) 890.8 L. nebulosus 6.9 (10.8-4.7) 119.9 D. pictum 6.6 (8.3-5.3) 387.2 2002 E. coioides 2.5 (6.9-1.0) 1059.0 L. nebulosus 5.9 (9.8-3.8) 99.3 D. pictum 4.2 (5.9-3.1) 266.8 2003 E. coioides 1.4 (4.0-0.6) 985.8 L. nebulosus 6.3 (9.6-4.3) 97.1 D. pictum 3.2 (4.6-2.3) 231.4 2004 E. coioides 1.5 (5.5-0.5) 997.3 L. nebulosus 6.4 (10.5-4.2) 115.0 D. pictum 5.4 (7.5-4.0) 350.6 2005 E. coioides 3.2 (7.7-1.5) 1295.6 L. nebulosus 7.1 (12.8-4.3) 111.8 D. pictum 6.5 (8.2-5.3) 438.4 2006 E. coioides 5.9 (8.0-2.5) 1787.0 L. nebulosus 7.8 (11.8-5.5) 152.4 D. pictum 5.0 (6.8-3.9) 379.4 2007 E. coioides 2.4 (5.4-1.1) 1300.2 L. nebulosus 11.0 (20.4-6.7) 166.5 D. pictum 4.6 (6.7-3.4) 336.9 2008 E. coioides 3.7 (7.8-1.9) 1365.6 L. nebulosus 7.6 (12.9-4.9) 134.7 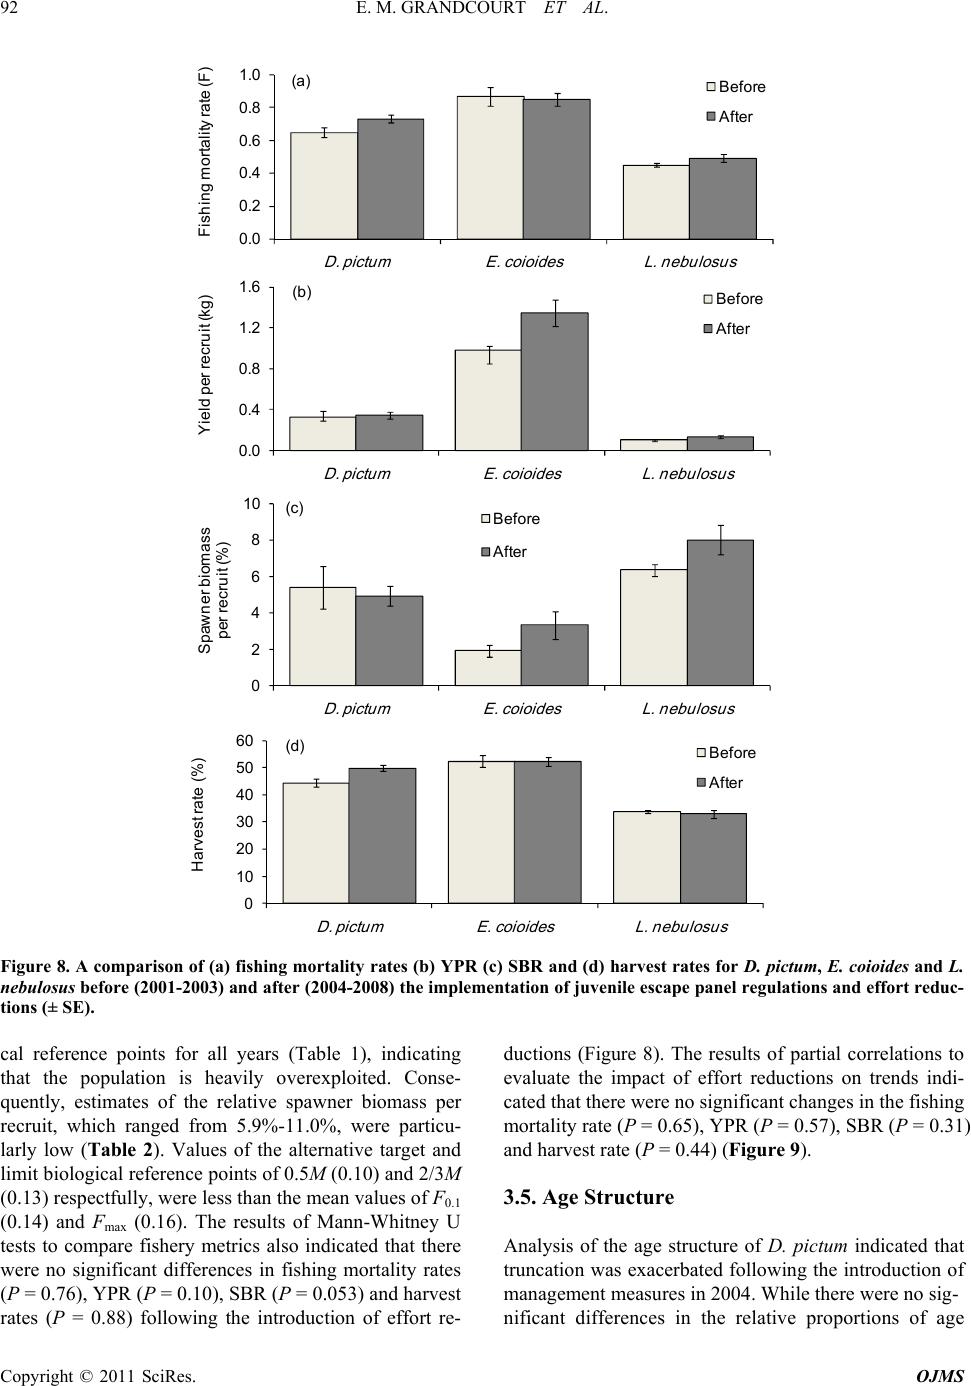 E. M. GRANDCOURT ET AL. 92 Copyright © 2011 SciRes. OJMS 0.0 0.2 0.4 0.6 0.8 1.0 D. pictumE. coioidesL. nebulosus Before After Fishingmortality rate (F) 0.0 0.4 0.8 1.2 1.6 D. pic t umE. coioidesL. nebulosus Before After Yield per recruit (kg) (b) 0 2 4 6 8 10 D. pic t umE. coioidesL. nebulosus Before After Spawner biomass per recruit (%) (c) (a) 0 10 20 30 40 50 60 D. pictu m E. c o ioide s L. nebulosu s Before After Harvest rate (%) (d) Figure 8. A comparison of (a) fishing mortality rates (b) YPR (c) SBR and (d) harvest rates for D. pictum, E. coioides and L. nebulosus before (2001-2003) and after (2004-2008) the implementation of juvenile escape panel regulations and effort reduc- tions (± SE). cal reference points for all years (Table 1), indicating that the population is heavily overexploited. Conse- quently, estimates of the relative spawner biomass per recruit, which ranged from 5.9%-11.0%, were particu- larly low (Table 2). Values of the alternative target and limit biological reference points of 0.5M (0.10) and 2/3M (0.13) respectfully, were less than the mean values of F0.1 (0.14) and Fmax (0.16). The results of Mann-Whitney U tests to compare fishery metrics also indicated that there were no significant differences in fishing mortality rates (P = 0.76), YPR (P = 0.10), SBR (P = 0.053) and harvest rates (P = 0.88) following the introduction of effort re- ductions (Figure 8). The results of partial correlations to evaluate the impact of effort reductions on trends indi- cated that there were no significant changes in the fishing mortality rate (P = 0.65), YPR (P = 0.57), SBR (P = 0.31) and harvest rate (P = 0.44) (Fig ure 9). 3.5. Age Structure Analysis of the age structure of D. pictum indicated that truncation was exacerbated following the introduction of management measures in 2004. While there were no sig- nificant differences in the relative proportions of age 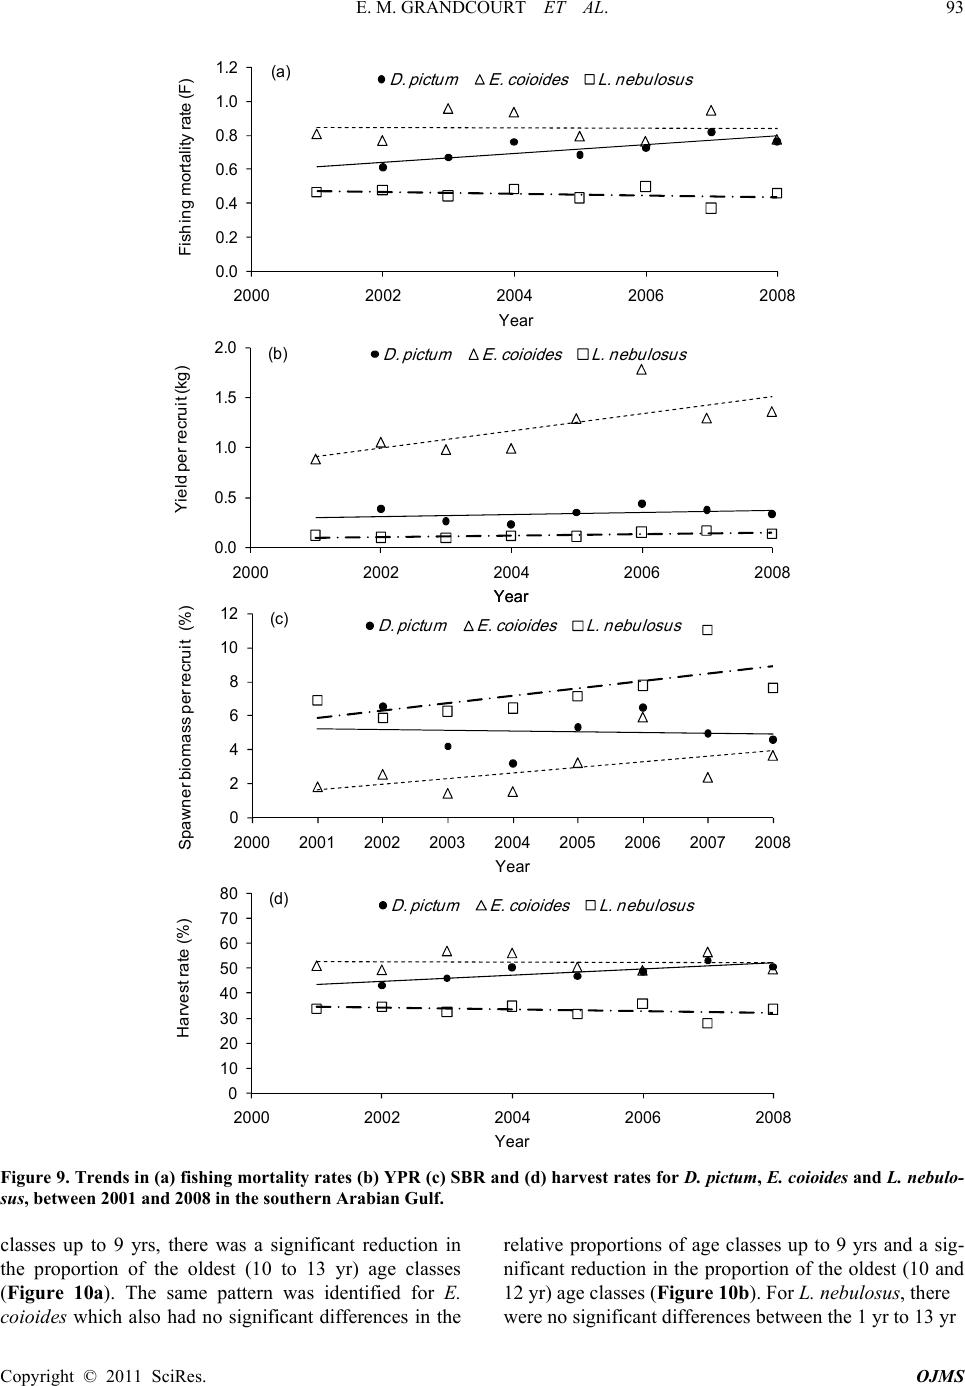 E. M. GRANDCOURT ET AL. 93 0.0 0.2 0.4 0.6 0.8 1.0 1.2 2000 2002 2004 2006 2008 D. pict umE. c o io id e sL. nebulosus Year Fishing mortality rate (F) 0.0 0.5 1.0 1.5 2.0 2000 2002 2004 2006 2008 D. pict umE. co io id e sL. nebulosus Year Yield per recruit (kg) (b) Year (b) 0 2 4 6 8 10 12 2000 2001 2002 2003 2004 2005 2006 2007 2008 D. pict umE. c o ioid e sL. nebulosus Year Spawner biomass per recruit (%) (c) 0 10 20 30 40 50 60 70 80 2000 2002 2004 2006 2008 D. pict umE. c o ioidesL. nebulosus Year Harvest rate (%) (d) (a) Figure 9. Trends in (a) fishing mortality rates (b) YPR (c) SBR and (d) harvest rates for D. pic tum , E. coioides and L. nebulo- sus, between 2001 and 2008 in the southern Arabian Gulf. classes up to 9 yrs, there was a significant reduction in the proportion of the oldest (10 to 13 yr) age classes (Figure 10a). The same pattern was identified for E. coioides which also had no significant differences in the relative proportions of age classes up to 9 yrs and a sig- nificant reduction in the proportion of the oldest (10 and 12 yr) age classes (Fi gure 10b). For L. nebulosus, there were no significant differences between the 1 yr to 13 yr Copyright © 2011 SciRes. OJMS 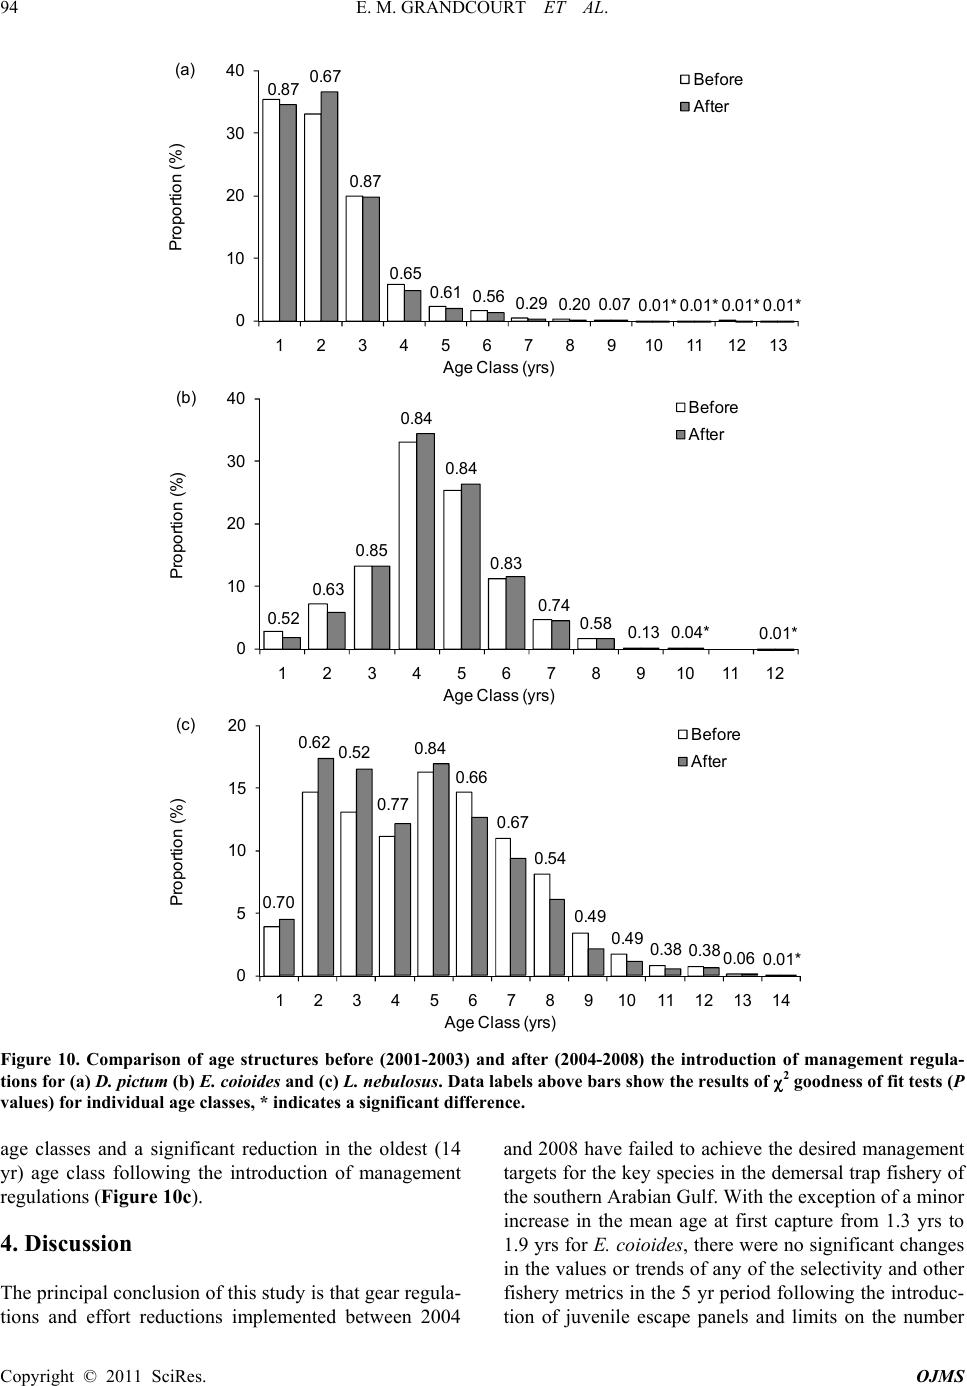 E. M. GRANDCOURT ET AL. 94 0.52 0.63 0.85 0.84 0.84 0.83 0.74 0.58 0.13 0.04* 0.01* 0 10 20 30 40 123456789101112 Before After Age Class (yrs) Proportion (%) (b) 0.87 0.67 0.87 0.65 0.610.560.29 0.200.07 0.01*0.01*0.01*0.01* 0 10 20 30 40 12345678910111213 Before After Age Class (yrs) Proportion (%) (a) 0.70 0.62 0.52 0.77 0.84 0.66 0.67 0.54 0.490.490.38 0.380.060.01* 0 5 10 15 20 1234567891011121314 Before After Age Class (yrs) Proportion (%) (c) Figure 10. Comparison of age structures before (2001-2003) and after (2004-2008) the introduction of management regula- tions for (a) D. pictum (b) E. coioides and (c) L. nebulosus. Data labels above bars show the results of 2 goodness of fit tests (P values) for individual age classes, * indicates a significant difference. age classes and a significant reduction in the oldest (14 yr) age class following the introduction of management regulations (Figure 10c). 4. Discussion The principal conclusion of this study is that gear regula- tions and effort reductions implemented between 2004 and 2008 have failed to achieve the desired management targets for the key species in the demersal trap fishery of the southern Arabian Gulf. With the exception of a minor increase in the mean age at first capture from 1.3 yrs to 1.9 yrs for E. coioides, there were no significant changes in the values or trends of any of the selectivity and other fishery metrics in the 5 yr period following the introduc- tion of juvenile escape panels and limits on the number Copyright © 2011 SciRes. OJMS 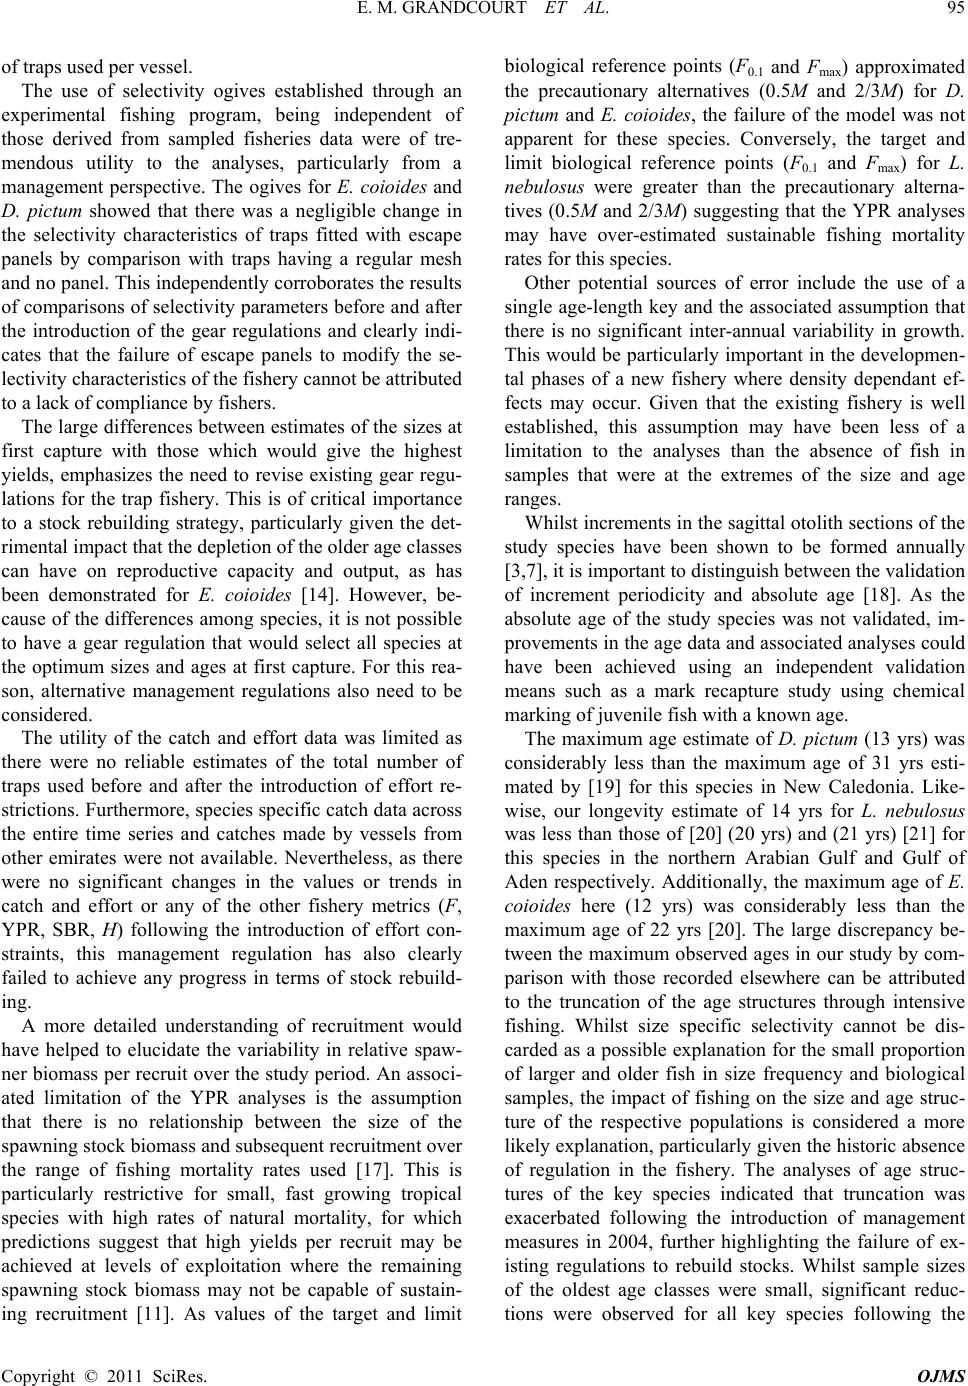 E. M. GRANDCOURT ET AL.95 Copyright © 2011 SciRes. OJMS of traps used per vessel. The use of selectivity ogives established through an experimental fishing program, being independent of those derived from sampled fisheries data were of tre- mendous utility to the analyses, particularly from a management perspective. The ogives for E. coioides and D. pictum showed that there was a negligible change in the selectivity characteristics of traps fitted with escape panels by comparison with traps having a regular mesh and no panel. This independently corroborates the results of comparisons of selectivity parameters before and after the introduction of the gear regulations and clearly indi- cates that the failure of escape panels to modify the se- lectivity characteristics of the fishery cannot be attributed to a lack of compliance by fishers. The large differences between estimates of the sizes at first capture with those which would give the highest yields, emphasizes the need to revise existing gear regu- lations for the trap fishery. This is of critical importance to a stock rebuilding strategy, particularly given the det- rimental impact that the depletion of the older age classes can have on reproductive capacity and output, as has been demonstrated for E. coioides [14]. However, be- cause of the differences among species, it is not possible to have a gear regulation that would select all species at the optimum sizes and ages at first capture. For this rea- son, alternative management regulations also need to be considered. The utility of the catch and effort data was limited as there were no reliable estimates of the total number of traps used before and after the introduction of effort re- strictions. Furthermore, species specific catch data across the entire time series and catches made by vessels from other emirates were not available. Nevertheless, as there were no significant changes in the values or trends in catch and effort or any of the other fishery metrics (F, YPR, SBR, H) following the introduction of effort con- straints, this management regulation has also clearly failed to achieve any progress in terms of stock rebuild- ing. A more detailed understanding of recruitment would have helped to elucidate the variability in relative spaw- ner biomass per recruit over the study period. An associ- ated limitation of the YPR analyses is the assumption that there is no relationship between the size of the spawning stock biomass and subsequent recruitment over the range of fishing mortality rates used [17]. This is particularly restrictive for small, fast growing tropical species with high rates of natural mortality, for which predictions suggest that high yields per recruit may be achieved at levels of exploitation where the remaining spawning stock biomass may not be capable of sustain- ing recruitment [11]. As values of the target and limit biological reference points (F0.1 and Fmax) approximated the precautionary alternatives (0.5M and 2/3M) for D. pictum and E. coioides, the failure of the model was not apparent for these species. Conversely, the target and limit biological reference points (F0.1 and Fmax) for L. nebulosus were greater than the precautionary alterna- tives (0.5M and 2/3M) suggesting that the YPR analyses may have over-estimated sustainable fishing mortality rates for this species. Other potential sources of error include the use of a single age-length key and the associated assumption that there is no significant inter-annual variability in growth. This would be particularly important in the developmen- tal phases of a new fishery where density dependant ef- fects may occur. Given that the existing fishery is well established, this assumption may have been less of a limitation to the analyses than the absence of fish in samples that were at the extremes of the size and age ranges. Whilst increments in the sagittal otolith sections of the study species have been shown to be formed annually [3,7], it is important to distinguish between the validation of increment periodicity and absolute age [18]. As the absolute age of the study species was not validated, im- provements in the age data and associated analyses could have been achieved using an independent validation means such as a mark recapture study using chemical marking of juvenile fish with a known age. The maximum age estimate of D. pictum (13 yrs) was considerably less than the maximum age of 31 yrs esti- mated by [19] for this species in New Caledonia. Like- wise, our longevity estimate of 14 yrs for L. nebulosus was less than those of [20] (20 yrs) and (21 yrs) [21] for this species in the northern Arabian Gulf and Gulf of Aden respectively. Additionally, the maximum age of E. coioides here (12 yrs) was considerably less than the maximum age of 22 yrs [20]. The large discrepancy be- tween the maximum observed ages in our study by com- parison with those recorded elsewhere can be attributed to the truncation of the age structures through intensive fishing. Whilst size specific selectivity cannot be dis- carded as a possible explanation for the small proportion of larger and older fish in size frequency and biological samples, the impact of fishing on the size and age struc- ture of the respective populations is considered a more likely explanation, particularly given the historic absence of regulation in the fishery. The analyses of age struc- tures of the key species indicated that truncation was exacerbated following the introduction of management measures in 2004, further highlighting the failure of ex- isting regulations to rebuild stocks. Whilst sample sizes of the oldest age classes were small, significant reduc- tions were observed for all key species following the 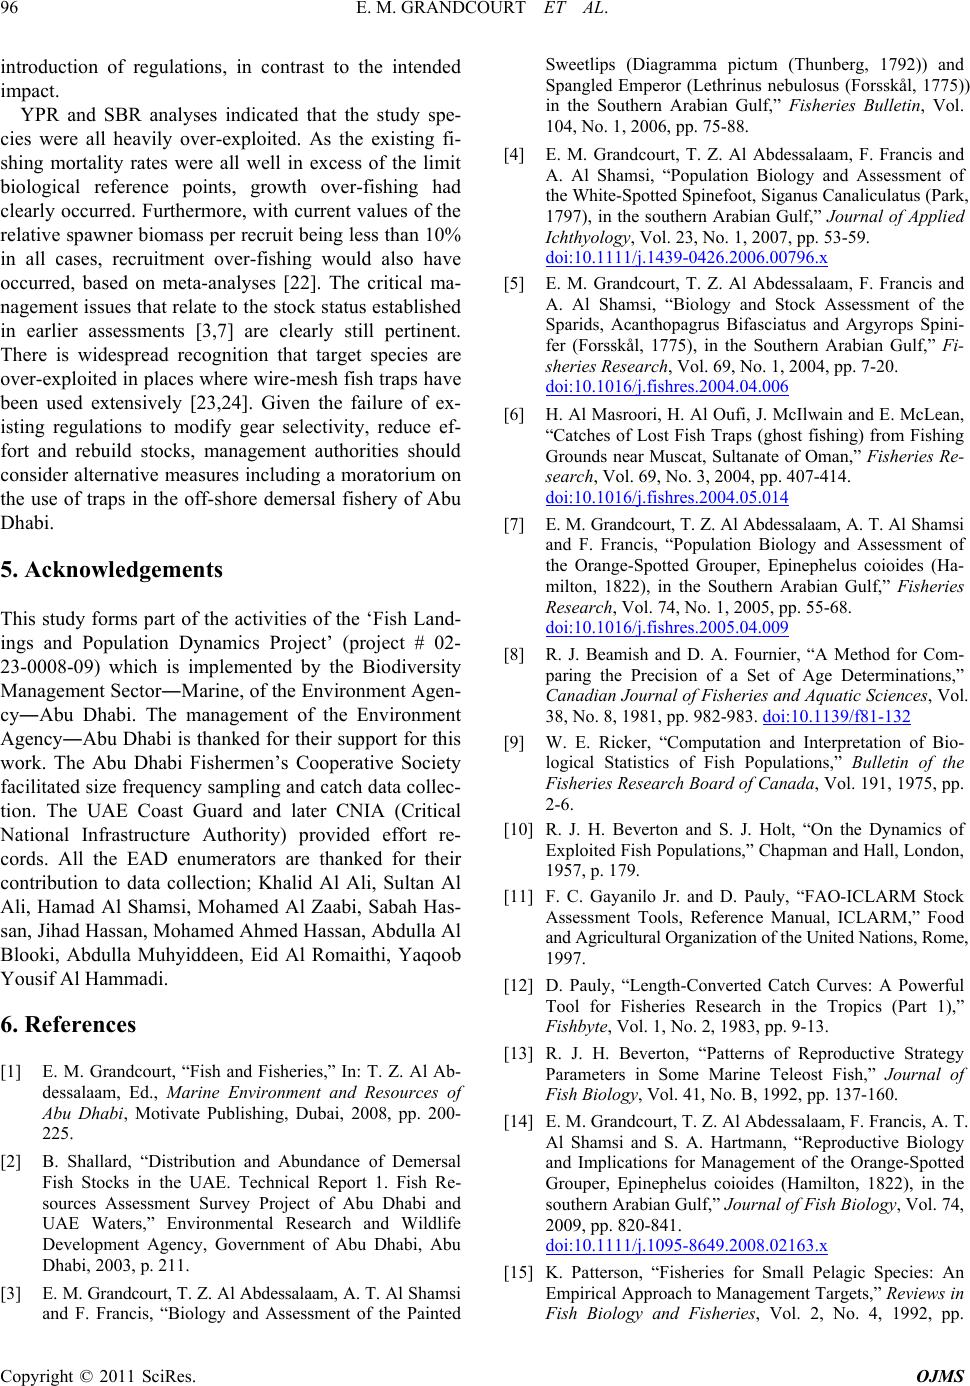 E. M. GRANDCOURT ET AL. 96 Copyright © 2011 SciRes. OJMS introduction of regulations, in contrast to the intended impact. YPR and SBR analyses indicated that the study spe- cies were all heavily over-exploited. As the existing fi- shing mortality rates were all well in excess of the limit biological reference points, growth over-fishing had clearly occurred. Furthermore, with current values of the relative spawner biomass per recruit being less than 10% in all cases, recruitment over-fishing would also have occurred, based on meta-analyses [22]. The critical ma- nagement issues that relate to the stock status established in earlier assessments [3,7] are clearly still pertinent. There is widespread recognition that target species are over-exploited in places where wire-mesh fish traps have been used extensively [23,24]. Given the failure of ex- isting regulations to modify gear selectivity, reduce ef- fort and rebuild stocks, management authorities should consider alternative measures including a moratorium on the use of traps in the off-shore demersal fishery of Abu Dhabi. 5. Acknowledgements This study forms part of the activities of the ‘Fish Land- ings and Population Dynamics Project’ (project # 02- 23-0008-09) which is implemented by the Biodiversity Management Sector―Marine, of the Environment Agen- cy―Abu Dhabi. The management of the Environment Agency―Abu Dhabi is thanked for their support for this work. The Abu Dhabi Fishermen’s Cooperative Society facilitated size frequency sampling and catch data collec- tion. The UAE Coast Guard and later CNIA (Critical National Infrastructure Authority) provided effort re- cords. All the EAD enumerators are thanked for their contribution to data collection; Khalid Al Ali, Sultan Al Ali, Hamad Al Shamsi, Mohamed Al Zaabi, Sabah Has- san, Jihad Hassan, Mohamed Ahmed Hassan, Abdulla Al Blooki, Abdulla Muhyiddeen, Eid Al Romaithi, Yaqoob Yousif Al Hammadi. 6. References [1] E. M. Grandcourt, “Fish and Fisheries,” In: T. Z. Al Ab- dessalaam, Ed., Marine Environment and Resources of Abu Dhabi, Motivate Publishing, Dubai, 2008, pp. 200- 225. [2] B. Shallard, “Distribution and Abundance of Demersal Fish Stocks in the UAE. Technical Report 1. Fish Re- sources Assessment Survey Project of Abu Dhabi and UAE Waters,” Environmental Research and Wildlife Development Agency, Government of Abu Dhabi, Abu Dhabi, 2003, p. 211. [3] E. M. Grandcourt, T. Z. Al Abdessalaam, A. T. Al Shamsi and F. Francis, “Biology and Assessment of the Painted Sweetlips (Diagramma pictum (Thunberg, 1792)) and Spangled Emperor (Lethrinus nebulosus (Forsskål, 1775)) in the Southern Arabian Gulf,” Fisheries Bulletin, Vol. 104, No. 1, 2006, pp. 75-88. [4] E. M. Grandcourt, T. Z. Al Abdessalaam, F. Francis and A. Al Shamsi, “Population Biology and Assessment of the White-Spotted Spinefoot, Siganus Canaliculatus (Park, 1797), in the southern Arabian Gulf,” Journal of Applied Ichthyology, Vol. 23, No. 1, 2007, pp. 53-59. doi:10.1111/j.1439-0426.2006.00796.x [5] E. M. Grandcourt, T. Z. Al Abdessalaam, F. Francis and A. Al Shamsi, “Biology and Stock Assessment of the Sparids, Acanthopagrus Bifasciatus and Argyrops Spini- fer (Forsskål, 1775), in the Southern Arabian Gulf,” Fi- sheries Research, Vol. 69, No. 1, 2004, pp. 7-20. doi:10.1016/j.fishres.2004.04.006 [6] H. Al Masroori, H. Al Oufi, J. McIlwain and E. McLean, “Catches of Lost Fish Traps (ghost fishing) from Fishing Grounds near Muscat, Sultanate of Oman,” Fisheries Re- search, Vol. 69, No. 3, 2004, pp. 407-414. doi:10.1016/j.fishres.2004.05.014 [7] E. M. Grandcourt, T. Z. Al Abdessalaam, A. T. Al Shamsi and F. Francis, “Population Biology and Assessment of the Orange-Spotted Grouper, Epinephelus coioides (Ha- milton, 1822), in the Southern Arabian Gulf,” Fisheries Research, Vol. 74, No. 1, 2005, pp. 55-68. doi:10.1016/j.fishres.2005.04.009 [8] R. J. Beamish and D. A. Fournier, “A Method for Com- paring the Precision of a Set of Age Determinations,” Canadian Journal of Fisheries and Aquatic Sciences, Vol. 38, No. 8, 1981, pp. 982-983. doi:10.1139/f81-132 [9] W. E. Ricker, “Computation and Interpretation of Bio- logical Statistics of Fish Populations,” Bulletin of the Fisheries Research Board of Canada, Vol. 191, 1975, pp. 2-6. [10] R. J. H. Beverton and S. J. Holt, “On the Dynamics of Exploited Fish Populations,” Chapman and Hall, London, 1957, p. 179. [11] F. C. Gayanilo Jr. and D. Pauly, “FAO-ICLARM Stock Assessment Tools, Reference Manual, ICLARM,” Food and Agricultural Organization of the United Nations, Rome, 1997. [12] D. Pauly, “Length-Converted Catch Curves: A Powerful Tool for Fisheries Research in the Tropics (Part 1),” Fishbyte, Vol. 1, No. 2, 1983, pp. 9-13. [13] R. J. H. Beverton, “Patterns of Reproductive Strategy Parameters in Some Marine Teleost Fish,” Journal of Fish Biology, Vol. 41, No. B, 1992, pp. 137-160. [14] E. M. Grandcourt, T. Z. Al Abdessalaam, F. Francis, A. T. Al Shamsi and S. A. Hartmann, “Reproductive Biology and Implications for Management of the Orange-Spotted Grouper, Epinephelus coioides (Hamilton, 1822), in the southern Arabian Gulf,” Journal of Fish Biology, Vol. 74, 2009, pp. 820-841. doi:10.1111/j.1095-8649.2008.02163.x [15] K. Patterson, “Fisheries for Small Pelagic Species: An Empirical Approach to Management Targets,” Reviews in Fish Biology and Fisheries, Vol. 2, No. 4, 1992, pp.  E. M. GRANDCOURT ET AL. Copyright © 2011 SciRes. OJMS 97 321-338. doi:10.1007/BF00043521 [16] R. R. Sokal and F. J. Rohlf, “Biometry,” The Principles and Practice of Statistics in Biological Research, 3rd Edi- tion, W. H. Freeman and Co, New York, 1995. [17] C. D. Buxton, “The Application of Yield-per-Recruit Mod- els to Two South African Sparid Reef Species, with Special Consideration to Sex Change,” Fisheries Research, Vol. 15, No. 1-2, 1992, pp. 1-16. doi:10.1016/0165-7836(92)90002-B [18] S. E. Campana, “Accuracy, Precision and Quality Control in Age Determination, Including a Review of the Use and Abuse of Age Validation Methods,” Journal of Fish Bi- ology, Vol. 59, No. 2, 2001, pp. 197-242. doi:10.1111/j.1095-8649.2001.tb00127.x [19] G. Loubens, “Biologie de Quelques Espèces de Poissons du Lagon Néo-Calédonien. III. Croissance,” Cahiers Indo- Pacific, Vol. 2, No. 2, 1980, pp. 101-153. [20] C. P. Mathews and M. Samuel, “Growth, Mortality and Length-Weight Parameters for Some Kuwaiti Fish and Shrimp,” Fishbyte, Vol. 9, No. 2, 1991, pp. 30-33. [21] R. R. C. Edwards and S. Shaher, “The Biometrics of Ma- rine Fishes from the Gulf of Aden,” Fishbyte, Vol. 9, No. 2, 1991, pp. 27-29. [22] P. M. Mace, “Relationships between Common Biological Reference Points Used as Thresholds and Targets of Fish- eries Management Strategies,” Canadian Journal of Fish- eries and Aquatic Sciences, Vol. 51, No. 1, 1994, pp. 110-122. doi:10.1139/f94-013 [23] R. Mahon and W. Hunte, “Trap Mesh Selectivity and the Management of Reef Fishes,” Fish and Fisheries, Vol. 2, No. 4, 2001, pp. 356-375. doi:10.1046/j.1467-2960.2001.00054.x [24] J. Stewart and D. J. Ferrell, “Mesh Selectivity in the NSW Demersal Trap Fishery,” Fisheries Research, Vol. 59, No. 3, 2003, pp. 379-392. doi:10.1016/S0165-7836(02)00024-3 |