

Paper Menu >>
Journal Menu >>
 Open Journal of Marine Science, 2011, 3, 69-72 doi:10.4236/ojms.2011.13007 Published Online October 2011 (http://www.SciRP.org/journal/ojms) Copyright © 2011 SciRes. OJMS A Field Experiment on the Recurrence of Large Waves in Wind Seas Paolo Boccotti NOEL Laboratory, Mediterranea University, Reggio Calabria, Italy E-mail: [email protected] Received May 10, 2011; revised July 18, 2011; accepted July 25, 2011 Abstract Wind generated sea waves are generally regarded as an example of pure randomness in nature. Here we give a proof that the matter is not exactly so: some identical sequences of relatively large waves were found many hours apart from one another. This finding supports the theory of quasi determinism of sea waves. Keywords: Experiment, Wave, Groups 1. Introduction Waves generated on the sea surface by winds and associ- ated stresses have a random nature. Strictly speaking, this means it is nearly impossible that an observer taking a sequence of snapshots of such waves will ever obtain two identical scenes. However, the quasi-determinism (QD) theory [1-14] suggests that an exceptionally large wave belongs to a well-defined sequence of waves whose configuration depends on the energy spectrum of the sea state, and on the configuration of the solid boundary (with the shape of the energy spectrum, and the configuration of the solid boundary that may be arbi- trary―see [9]). This in turn implies that two exception- ally large waves in two sea states with the same spectrum, and with the same configuration of the solid boundary (and in particular with the same bottom topography), should belong to two identical sequences of waves. This is what our field experiment aimed to verify. The ex- periment was performed on the sheet of sea of the NOEL laboratory at Reggio Calabria (Italy). 2. The Field Experiment A horizontal beam was placed 1.2 m beneath the mean water level (see the scheme of Figure 1). The beam was 15 m long and placed orthogonally to the shoreline, ap- proximately. It was mounted with 26 pressure transduc- ers for measuring pressure head waves induced by wind-generated waves on the sea surface, as schemati- cally illustrated in figure 1. Each pressure transducer was connected to a small vertical tube (0.40 m long) with a bending section at the top (like a small periscope). The opening at the top of this small tube was in a vertical plane orthogonal to the shoreline. This tube was not strictly necessary for our experiment, and it served only to measure pressure head waves in the undisturbed wave field. Thanks to the small tubes, the pressure head waves were measured 0.40 m above the horizontal beam which consisted of a truss of high stiffness and small section. As to angle of the dominant wave direction it was estimated from the relative phase of point 26 and point 27. Pressure transducer 27 (not seen in fig.1) was 0.75 m from transducer 26, and these two transducers were aligned with the shoreline. Obviously, the experiment could have been carried out by measuring surface waves. The preference here for pressure head waves is because they are not much af- fected by a high-frequency noise and also because meas- urements made by pressure transducers are in general more precise and reliable than surface measurements gathered with resistance gauges, buoys, radars and other means. In summarizing the experimental results, we will let EW denote the largest pressure wave observed in a five-minute recording of pressure fluctuations gathered at the 26 transducers. The objective was to search if we could find two EWs: i) being of the same type: zero up-crossing (U) or zero down-crossing (D); ii) occurring at the same location i (with I = 1, 2,..., 26 being the loca- tions of the transducers); iii) having some very large (with being the ratio of a crest-to-trough height of a pressure-head wave to p the root-mean-square pres- sure-head of the sea state); iv) belonging to two sea 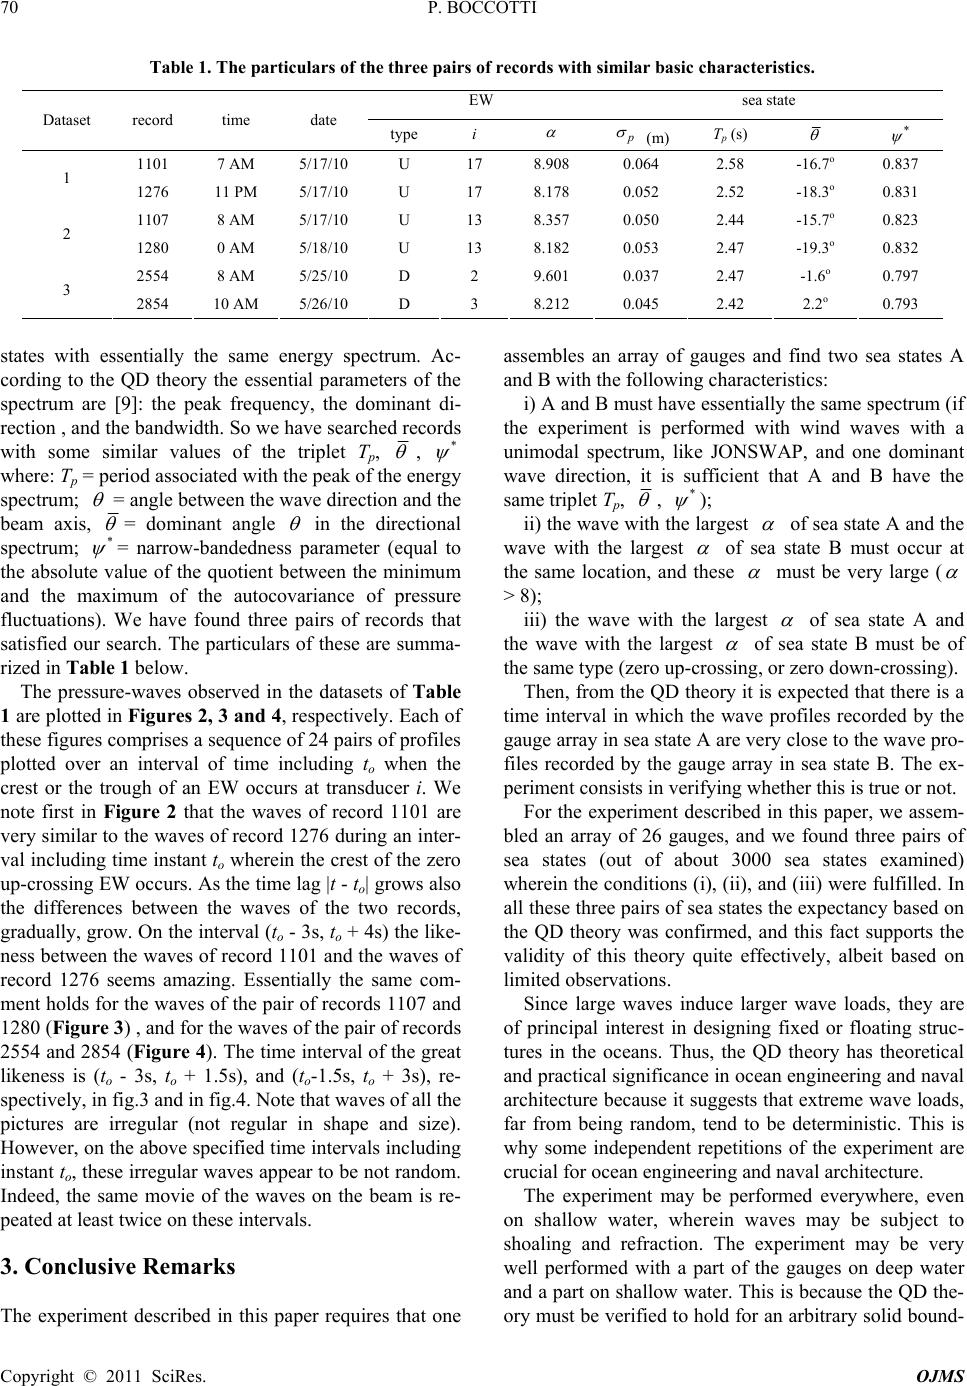 P. BOCCOTTI 70 Table 1. The particulars of the three pairs of records with similar basic characteristics. EW sea state Dataset record time date type i p (m) T p (s) * 1101 7 AM 5/17/10 U 17 8.908 0.064 2.58 -16.7 o 0.837 1 1276 11 PM 5/17/10 U 17 8.178 0.052 2.52 -18.3 o 0.831 1107 8 AM 5/17/10 U 13 8.357 0.050 2.44 -15.7 o 0.823 2 1280 0 AM 5/18/10 U 13 8.182 0.053 2.47 -19.3 o 0.832 2554 8 AM 5/25/10 D 2 9.601 0.037 2.47 -1.6 o 0.797 3 2854 10 AM 5/26/10 D 3 8.212 0.045 2.42 2.2 o 0.793 states with essentially the same energy spectrum. Ac- cording to the QD theory the essential parameters of the spectrum are [9]: the peak frequency, the dominant di- rection , and the bandwidth. So we have searched records with some similar values of the triplet Tp, , * where: Tp = period associated with the peak of the energy spectrum; = angle between the wave direction and the beam axis, = dominant angle in the directional spectrum; * = narrow-bandedness parameter (equal to the absolute value of the quotient between the minimum and the maximum of the autocovariance of pressure fluctuations). We have found three pairs of records that satisfied our search. The particulars of these are summa- rized in Table 1 below. The pressure-waves observed in the datasets of Table 1 are plotted in Figures 2, 3 and 4, respectively. Each of these figures comprises a sequence of 24 pairs of profiles plotted over an interval of time including to when the crest or the trough of an EW occurs at transducer i. We note first in Figure 2 that the waves of record 1101 are very similar to the waves of record 1276 during an inter- val including time instant to wherein the crest of the zero up-crossing EW occurs. As the time lag |t - to| grows also the differences between the waves of the two records, gradually, grow. On the interval (to - 3s, to + 4s) the like- ness between the waves of record 1101 and the waves of record 1276 seems amazing. Essentially the same com- ment holds for the waves of the pair of records 1107 and 1280 (Figure 3) , and for the waves of the pair of records 2554 and 2854 (Figure 4). The time interval of the great likeness is (to - 3s, to + 1.5s), and (to-1.5s, to + 3s), re- spectively, in fig.3 and in fig.4. Note that waves of all the pictures are irregular (not regular in shape and size). However, on the above specified time intervals including instant to, these irregular waves appear to be not random. Indeed, the same movie of the waves on the beam is re- peated at least twice on these intervals. 3. Conclusive Remarks The experiment described in this paper requires that one assembles an array of gauges and find two sea states A and B with the following characteristics: i) A and B must have essentially the same spectrum (if the experiment is performed with wind waves with a unimodal spectrum, like JONSWAP, and one dominant wave direction, it is sufficient that A and B have the same triplet Tp, , * ); ii) the wave with the largest of sea state A and the wave with the largest of sea state B must occur at the same location, and these must be very large ( > 8); iii) the wave with the largest of sea state A and the wave with the largest of sea state B must be of the same type (zero up-crossing, or zero down-crossing). Then, from the QD theory it is expected that there is a time interval in which the wave profiles recorded by the gauge array in sea state A are very close to the wave pro- files recorded by the gauge array in sea state B. The ex- periment consists in verifying whether this is true or not. For the experiment described in this paper, we assem- bled an array of 26 gauges, and we found three pairs of sea states (out of about 3000 sea states examined) wherein the conditions (i), (ii), and (iii) were fulfilled. In all these three pairs of sea states the expectancy based on the QD theory was confirmed, and this fact supports the validity of this theory quite effectively, albeit based on limited observations. Since large waves induce larger wave loads, they are of principal interest in designing fixed or floating struc- tures in the oceans. Thus, the QD theory has theoretical and practical significance in ocean engineering and naval architecture because it suggests that extreme wave loads, far from being random, tend to be deterministic. This is why some independent repetitions of the experiment are crucial for ocean engineering and naval architecture. The experiment may be performed everywhere, even on shallow water, wherein waves may be subject to shoaling and refraction. The experiment may be very well performed with a part of the gauges on deep water and a part on shallow water. This is because the QD the- ory must be verified to hold for an arbitrary solid bound- Copyright © 2011 SciRes. OJMS 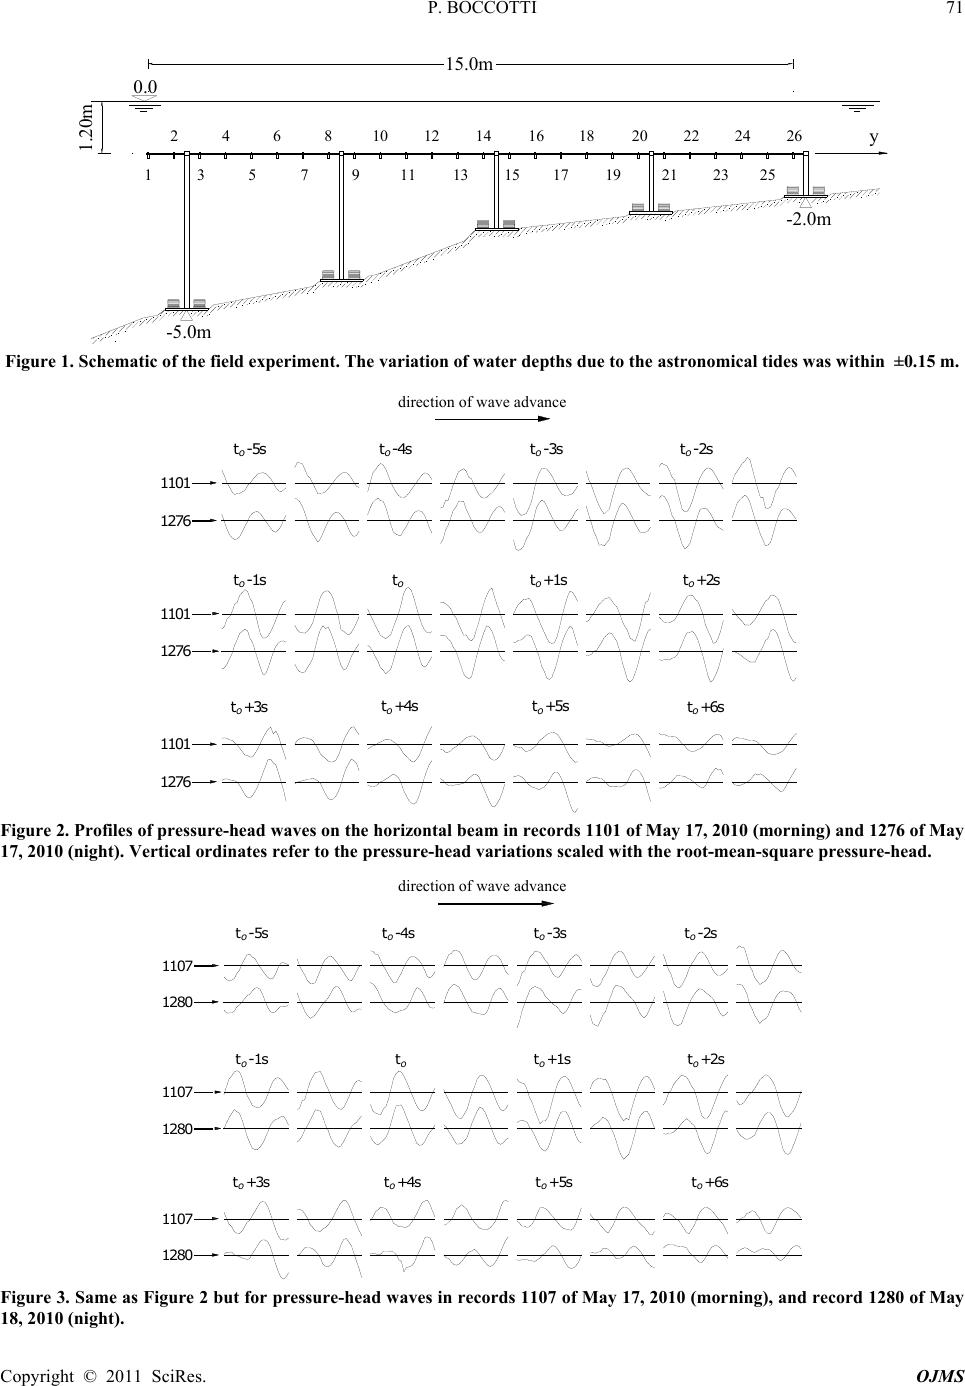 P. BOCCOTTI 71 15.0 m -2.0m -5.0m 0.0 1.20m 135791113151719212325 246810 12 1416 1820 22 24 26 y Figure 1. Schematic of the field experiment. The variation of water depths due to the astronomical tides was within ±0.15 m. direction of wave advance 1101 1276 t o t + 1 s o t + 2 s o t + 3 s o t + 4 s o t + 5 s o t + 6 s o t -1 s o t -5 s o t -4 s o t -3 s o t -2 s o 1101 1276 1101 1276 Figure 2. Profiles of pressure-head waves on the horizontal beam in records 1101 of May 17, 2010 (morning) and 1276 of May 17, 2010 (night). Vertical ordinates refer to the pressure-head variations scaled with the root-mean-square pressure-head. direction of wave advance 1107 1280 t o t + 1 s o t + 2 s o t + 3 s o t + 4 s o t + 5 s o t + 6 s o t -1 s o t -5 s o t -4 s o t -3 s o t -2 s o 1107 1280 1107 1280 Figure 3. Same as Figure 2 but for pressure-head waves in records 1107 of May 17, 2010 (morning), and record 1280 of May 18, 2010 (night). Copyright © 2011 SciRes. OJMS 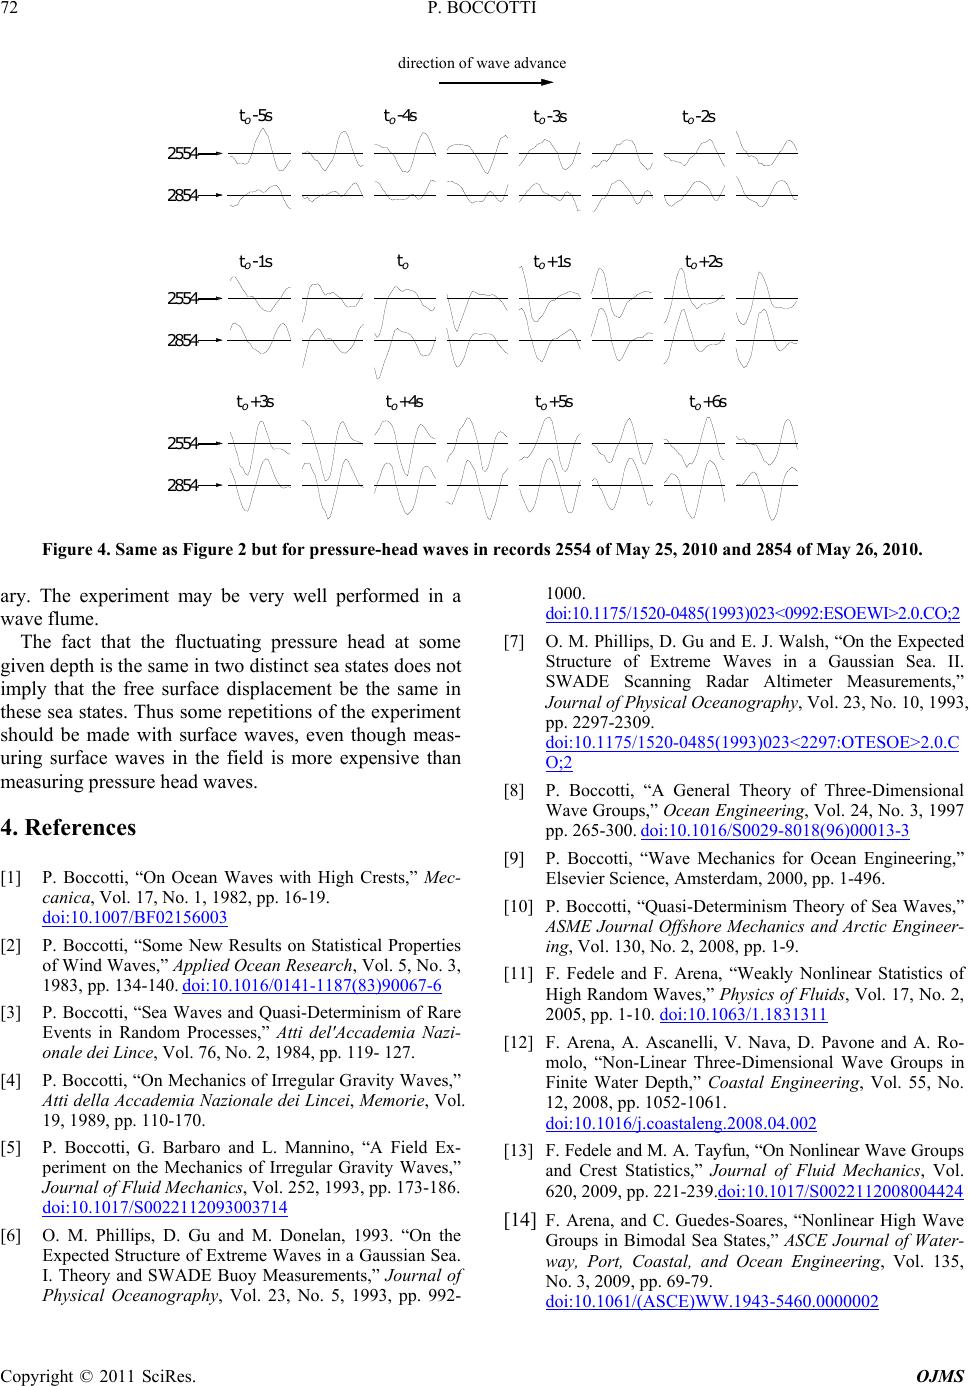 P. BOCCOTTI Copyright © 2011 SciRes. OJMS 72 direction of wave advance 2554 2854 t o 2554 2854 2554 2854 t + 1 s o t + 2 s o t + 3 s o t + 4 s o t + 5 s o t + 6 s o t -1 s o t -5 s o t -4 s o t -3 s o t -2 s o Figure 4. Same as Figure 2 but for pressure-head waves in records 2554 of May 25, 2010 and 2854 of May 26, 2010. ary. The experiment may be very well performed in a wave flume. The fact that the fluctuating pressure head at some given depth is the same in two distinct sea states does not imply that the free surface displacement be the same in these sea states. Thus some repetitions of the experiment should be made with surface waves, even though meas- uring surface waves in the field is more expensive than measuring pressure head waves. 4. References [1] P. Boccotti, “On Ocean Waves with High Crests,” Mec- canica, Vol. 17, No. 1, 1982, pp. 16-19. doi:10.1007/BF02156003 [2] P. Boccotti, “Some New Results on Statistical Properties of Wind Waves,” Applied Ocean Research, Vol. 5, No. 3, 1983, pp. 134-140. doi:10.1016/0141-1187(83)90067-6 [3] P. Boccotti, “Sea Waves and Quasi-Determinism of Rare Events in Random Processes,” Atti del'Accademia Nazi- onale dei Lince, Vol. 76, No. 2, 1984, pp. 119- 127. [4] P. Boccotti, “On Mechanics of Irregular Gravity Waves,” Atti della Accademia Nazionale dei Lincei, Memo rie, Vol. 19, 1989, pp. 110-170. [5] P. Boccotti, G. Barbaro and L. Mannino, “A Field Ex- periment on the Mechanics of Irregular Gravity Waves,” Journal of Fluid Mechanics, Vol. 252, 1993, pp. 173-186. doi:10.1017/S0022112093003714 [6] O. M. Phillips, D. Gu and M. Donelan, 1993. “On the Expected Structure of Extreme Waves in a Gaussian Sea. I. Theory and SWADE Buoy Measurements,” Journal of Physical Oceanography, Vol. 23, No. 5, 1993, pp. 992- 1000. doi:10.1175/1520-0485(1993)023<0992:ESOEWI>2.0.CO;2 [7] O. M. Phillips, D. Gu and E. J. Walsh, “On the Expected Structure of Extreme Waves in a Gaussian Sea. II. SWADE Scanning Radar Altimeter Measurements,” Journal of Physical Oceanography, Vol. 23, No. 10, 1993, pp. 2297-2309. doi:10.1175/1520-0485(1993)023<2297:OTESOE>2.0.C O;2 [8] P. Boccotti, “A General Theory of Three-Dimensional Wave Groups,” Ocean Engineering, Vol. 24, No. 3, 1997 pp. 265-300. doi:10.1016/S0029-8018(96)00013-3 [9] P. Boccotti, “Wave Mechanics for Ocean Engineering,” Elsevier Science, Amsterdam, 2000, pp. 1-496. [10] P. Boccotti, “Quasi-Determinism Theory of Sea Waves,” ASME Journal Offshore Mechanics and Arctic Engineer- ing, Vol. 130, No. 2, 2008, pp. 1-9. [11] F. Fedele and F. Arena, “Weakly Nonlinear Statistics of High Random Waves,” Physics of Fluids, Vol. 17, No. 2, 2005, pp. 1-10. doi:10.1063/1.1831311 [12] F. Arena, A. Ascanelli, V. Nava, D. Pavone and A. Ro- molo, “Non-Linear Three-Dimensional Wave Groups in Finite Water Depth,” Coastal Engineering, Vol. 55, No. 12, 2008, pp. 1052-1061. doi:10.1016/j.coastaleng.2008.04.002 [13] F. Fedele and M. A. Tayfun, “On Nonlinear Wave Groups and Crest Statistics,” Journal of Fluid Mechanics, Vol. 620, 2009, pp. 221-239.doi:10.1017/S0022112008004424 [14] F. Arena, and C. Guedes-Soares, “Nonlinear High Wave Groups in Bimodal Sea States,” ASCE Journal of Water- way, Port, Coastal, and Ocean Engineering, Vol. 135, No. 3, 2009, pp. 69-79. doi:10.1061/(ASCE)WW.1943-5460.0000002 |