

Paper Menu >>
Journal Menu >>
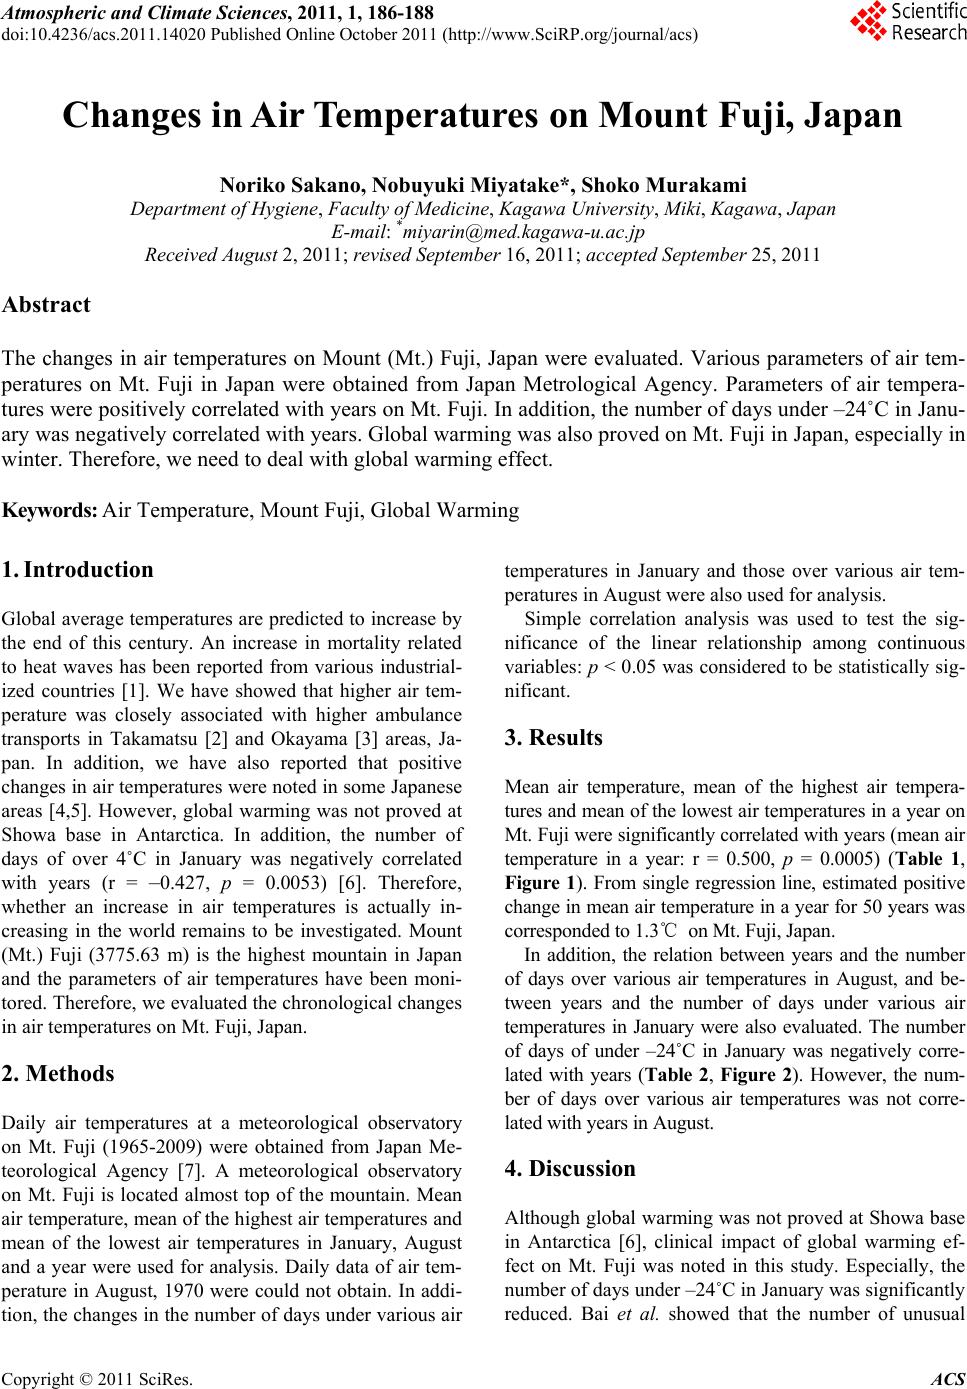 Atmospheric and Climate Sciences, 2011, 1, 186-188 doi:10.4236/acs.2011.14020 Published Online October 2011 (http://www.SciRP.org/journal/acs) Copyright © 2011 SciRes. ACS Changes in Air Temperatures on Mount Fuji, Japan Noriko Sakano, Nobuyuki Miyatake*, Shoko Murakami Department of Hygi ene, Faculty of Medicine, Kagawa University, Miki, Kagawa, Japan E-mail: *[email protected] Received August 2, 2011; revised September 16, 20 1 1; acce p t ed Septembe r 25, 2011 Abstract The changes in air temperatures on Mount (Mt.) Fuji, Japan were evaluated. Various parameters of air tem- peratures on Mt. Fuji in Japan were obtained from Japan Metrological Agency. Parameters of air tempera- tures were positively correlated with years on Mt. Fuji. In addition, the number of days under –24˚C in Janu- ary was negatively correlated with years. Global warming was also proved on Mt. Fuji in Japan, especially in winter. Therefore, we need to deal with global warming effect. Keywords: Air Temperature, Mount Fuji, Global Warming 1. Introduction Global average temperatures are predicted to increase by the end of this century. An increase in mortality related to heat waves has been reported from various industrial- ized countries [1]. We have showed that higher air tem- perature was closely associated with higher ambulance transports in Takamatsu [2] and Okayama [3] areas, Ja- pan. In addition, we have also reported that positive changes in air temperatures were noted in some Japanese areas [4,5]. However, global warming was not proved at Showa base in Antarctica. In addition, the number of days of over 4˚C in January was negatively correlated with years (r = –0.427, p = 0.0053) [6]. Therefore, whether an increase in air temperatures is actually in- creasing in the world remains to be investigated. Mount (Mt.) Fuji (3775.63 m) is the highest mountain in Japan and the parameters of air temperatures have been moni- tored. Therefore, we evaluated the chronological changes in air temperatures on Mt. Fuji, Japan. 2. Methods Daily air temperatures at a meteorological observatory on Mt. Fuji (1965-2009) were obtained from Japan Me- teorological Agency [7]. A meteorological observatory on Mt. Fuji is located almost top of the mountain. Mean air temperature, mean of the highest air temperatures and mean of the lowest air temperatures in January, August and a year were used for analysis. Daily data of air tem- perature in August, 1970 were could not obtain. In addi- tion, the chan ges in the number of days under variou s air temperatures in January and those over various air tem- peratures in August were also used for analysis. Simple correlation analysis was used to test the sig- nificance of the linear relationship among continuous variables: p < 0.05 was considered to be statistically sig- nificant. 3. Results Mean air temperature, mean of the highest air tempera- tures and mean of the lowest a ir temperatures in a year on Mt. Fuji were significantly correlated with years (mean air temperature in a year: r = 0.500, p = 0.0005) (Table 1, Figure 1). From single regression line, estimated positive change in mean air te mperature in a year for 50 years was corresponded to 1.3℃ on Mt. Fuji , Japan. In addition, the relation between years and the number of days over various air temperatures in August, and be- tween years and the number of days under various air temperatures in January were also evaluated. The number of days of under –24˚C in January was negatively corre- lated with years (Table 2, Figure 2). However, the num- ber of days over various air temperatures was not corre- lated with years in August. 4. Discussion Although global war ming was not proved at Showa ba se in Antarctica [6], clinical impact of global warming ef- fect on Mt. Fuji was noted in this study. Especially, the number of days under –24˚C in January was significantly reduced. Bai et al. showed that the number of unusual 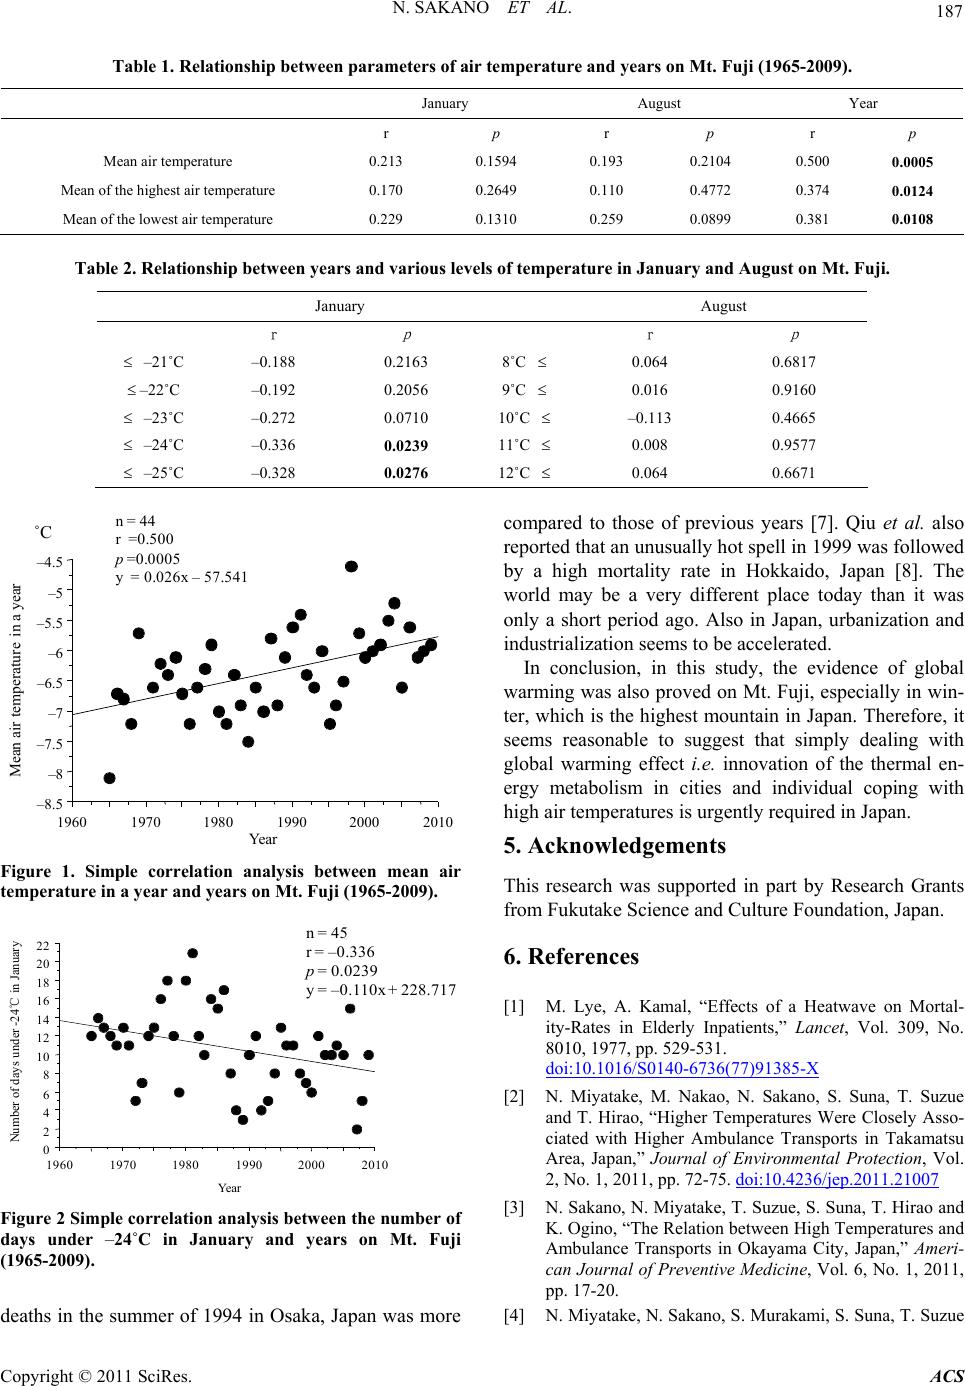 187 N. SAKANO ET AL. Table 1. Relationship between parameters of air temperature and years on Mt. Fuji (1965-2009). January August Year r p r p r p Mean air temperature 0.213 0.1594 0.193 0.2104 0.500 0.0005 Mean of the highest air temperature 0.170 0.2649 0.110 0.4772 0.374 0.0124 Mean of the lowest air temperature 0.229 0.1310 0.259 0.0899 0.381 0.0108 Table 2. Relationship betwee n ye ars and various levels of temperature in January and August on Mt. Fuji. January August r p r p –21˚C –0.188 0.2163 8˚C 0.064 0.6817 –22˚C –0.192 0.2056 9˚C 0.016 0.9160 –23˚C –0.272 0.0710 10˚C –0.113 0.4665 –24˚C –0.336 0.0239 11˚C 0.008 0.9577 –25˚C –0.328 0.0276 12˚C 0.064 0.6671 Mean air temperature in a year ˚C n = 44 r =0.500 p =0.0005 y = 0.026x –57. 541 –8.5 –8 –7.5 –7 –6.5 –6 –5.5 –5 –4.5 1960 1970 19801990 20002010 Yea r Figure 1. Simple correlation analysis between mean air temperature in a year and y ears on Mt. Fuji (1965-2009). Number of days under -24℃in Januar y n = 45 r = –0.336 p = 0.0239 y = –0.110x + 228.717 0 2 4 6 8 10 12 14 16 18 20 22 19601970 19801990 20002010 Year Figure 2 Simple correlation analysis between the number of days under –24˚C in January and years on Mt. Fuji (1965-2009). deaths in the summer of 1994 in Osaka, Japan was more compared to those of previous years [7]. Qiu et al. also reported that an unu sually h ot spell in 199 9 was followed by a high mortality rate in Hokkaido, Japan [8]. The world may be a very different place today than it was only a short period ago. Also in Japan, urbanization and industrialization seems to be accelerated. In conclusion, in this study, the evidence of global warming was also proved on Mt. Fuji, especially in win- ter, which is the highest mountain in Japan. Therefo re, it seems reasonable to suggest that simply dealing with global warming effect i.e. innovation of the thermal en- ergy metabolism in cities and individual coping with high air temperatures is urgently required in Japan. 5. Acknowledgements This research was supported in part by Research Grants from Fukutake Science and Culture Foundation, Japan. 6. References [1] M. Lye, A. Kamal, “Effects of a Heatwave on Mortal- ity-Rates in Elderly Inpatients,” Lancet, Vol. 309, No. 8010, 1977, pp. 529-531. doi:10.1016/S0140-6736(77)91385-X [2] N. Miyatake, M. Nakao, N. Sakano, S. Suna, T. Suzue and T. Hirao, “Higher Temperatures Were Closely Asso- ciated with Higher Ambulance Transports in Takamatsu Area, Japan,” Journal of Environmental Protection, Vol. 2, No. 1, 2011, pp. 72-75. doi:10.4236/jep.2011.21007 [3] N. Sakano, N. Miyatake, T. Suzue, S. Suna, T. Hirao and K. Ogino, “The Relation between High Temperatures and Ambulance Transports in Okayama City, Japan,” Ameri- can Journal of Preventive Medicine, Vol. 6, No. 1, 2011, pp. 17-20. [4] N. Miyatake, N. Sakano, S. Murakami, S. Suna, T. Suzue Copyright © 2011 SciRes. ACS  N. SAKANO ET AL. 188 and T. Hirao, “Comparison of the Changes in Tempera- tures among Rural, Urban and Metropolitan Areas around the Inrand Sea, Japan,” Environ Monit Assess, Vol. 181, No.1-4, 2011, pp. 525-530. [5] N. Sakano, N. Miyatake, S. Murakami, T. Suzue, T. Hirao and K. Ogino, “Changes in Temperatures in Oka- yama Area Compared with Different Urbanization Areas, Japan,” Journal of Environmental Protection, Vol. 2, No. 2, 2011, pp. 162-167. doi:10.4236/jep.2011.22018 [6] N. Miyatake, N. Sakano, S. Murakami, T. Suzue and T. Hirao, “Global Warming Was Not Proved at Showa Base in Antarctica,” Journal of Environmental Protection, Vol. 2, No. 3, 2011, pp. 323-325. doi:10.4236/jep.2011.23036 [7] Japan Meteorological Agency, 2010. http://www.data.jma.go.jp/obd/stats/etrn/index [8] D. Qiu, T. Tanihata, H. Aoyama, T. Fujita, Y. Inaba and M. Minowa, “Relationship between a High Mortality Rate and Extreme Heat during the Summer of 1999 in Hokkaido Prefecture, Japan,” Journal of Epidemiology, Vol. 12, No. 3, 2002, pp. 254-257. Copyright © 2011 SciRes. ACS |