

Paper Menu >>
Journal Menu >>
 Journal of Geographic Information System, 2011, 3, 373-381 doi:10.4236/jgis.2011.34036 Published Online October 2011 (http://www.SciRP.org/journal/jgis) Copyright © 2011 SciRes. JGIS GIS and Intra-Site Spatial Analyses: An Integrated Approach for Recording and Analyzing the Fossil Deposits at Casablanca Prehistoric Sites (Morocco) Rosalia Gallotti1, Abderrahim Mohib2, Mosshine El Graoui2, Fatima Zohra Sbihi-Alaoui2, Jean-Paul Raynal1,3 1Université Bordeaux 1, Bordeaux, France 2Direction d u Patrimoine, Institut National des Sciences de l’Archéo logie et du Patrimoine, Rabat, Morocco 3Department of Human Evolution, Max Planck Institute for Evolutionary Anthropology, Leipzig, Germany E-mail: [email protected] Received June 3, 2011; revised July 23, 2011; accepted August 1, 2011 Abstract The Mio-Plio-Pleistocene sequence at Casablanca, covering the last six million years, is well known in sci- entific literature. The variability and the chronology of the Acheulian sequence is documented by systematic, modern and controlled investigations in various sites (Unit L and Hominid Cave at Thomas I Quarry, Rhi- noceros Cave at Oulad Hamida 1 Quarry, Sidi Abderrahman Extension Quarry, Bear’s Cave and Cap Chatelier at Sidi Abderrahman Quarry) which have taken place within the framework of the Franco-Moroccan co-operative project “Casablanca”. In order to manage the excavation data and to explore the taphonomic nature of Unit L, Hominid Cave and Rhinoceros Cave, where research is still in progress, an approach combining a Geographic Information System (GIS) and spatial analysis techniques was developed, incorporating all existing information produced from previous excavations and recent surveys of the sites. The amalgamation of this data into a GIS has resulted in a digital database that allows the production of si- multaneous or separate visualizations and analyses of the fossils, artifacts and geological materials within their original spatial contexts and also permits intra-site spatial analyses that allow a co mprehensive investi- gation of the site formation processes. Keywords: Morocco, Casablanca, Prehistoric Archaeology, GIS, Intra-Site Spatial Analyses, Site Formation Processes 1. Introduction During the last few decades archaeological research has been characterized by a remarkable increase in the use of computerised techniques; in particular, GIS (Geographi- cal Information System) softwares have gained special favour firstly in providing systems for the management of archaeological data, and secondly as a fundamental tool for the interpretation of archaeological contexts. GIS has long been employed in archaeological landscape studies for inter-site analyses. In recent times, many ap- plications aimed at the interpretation of prehistoric de- posits have also been developed [1-8]. The close connec- tion between the spatial location of widespread exca- vated evidences and the analytical study of each individ- ual find makes the use of computer spatial analysis technologies especially useful in conjunction with GIS. In this intra-site application field, GIS plays a decisive role in the identification of the spatial trends of archaeo- logical data through the contextual or selective treatment of spatial variables. The sp atial distribution of finds in an Early Pleistocene site is largely determined by post- depositional disturbance phenomena affecting the ta- phonomic environment, whether or not they are anthro- pogenic, which always need to be taken into account in any spatial interpretation [9]. One of the most complex problems to solve is overcoming the difficulty of recog- nizing the sequence of these alteration phenomena, which often occur simultaneously, and are hence hard to differentiate in an overall analysis. Intra-site spatial analyses are important methodologies for unraveling the formation and sequencing of prehis- 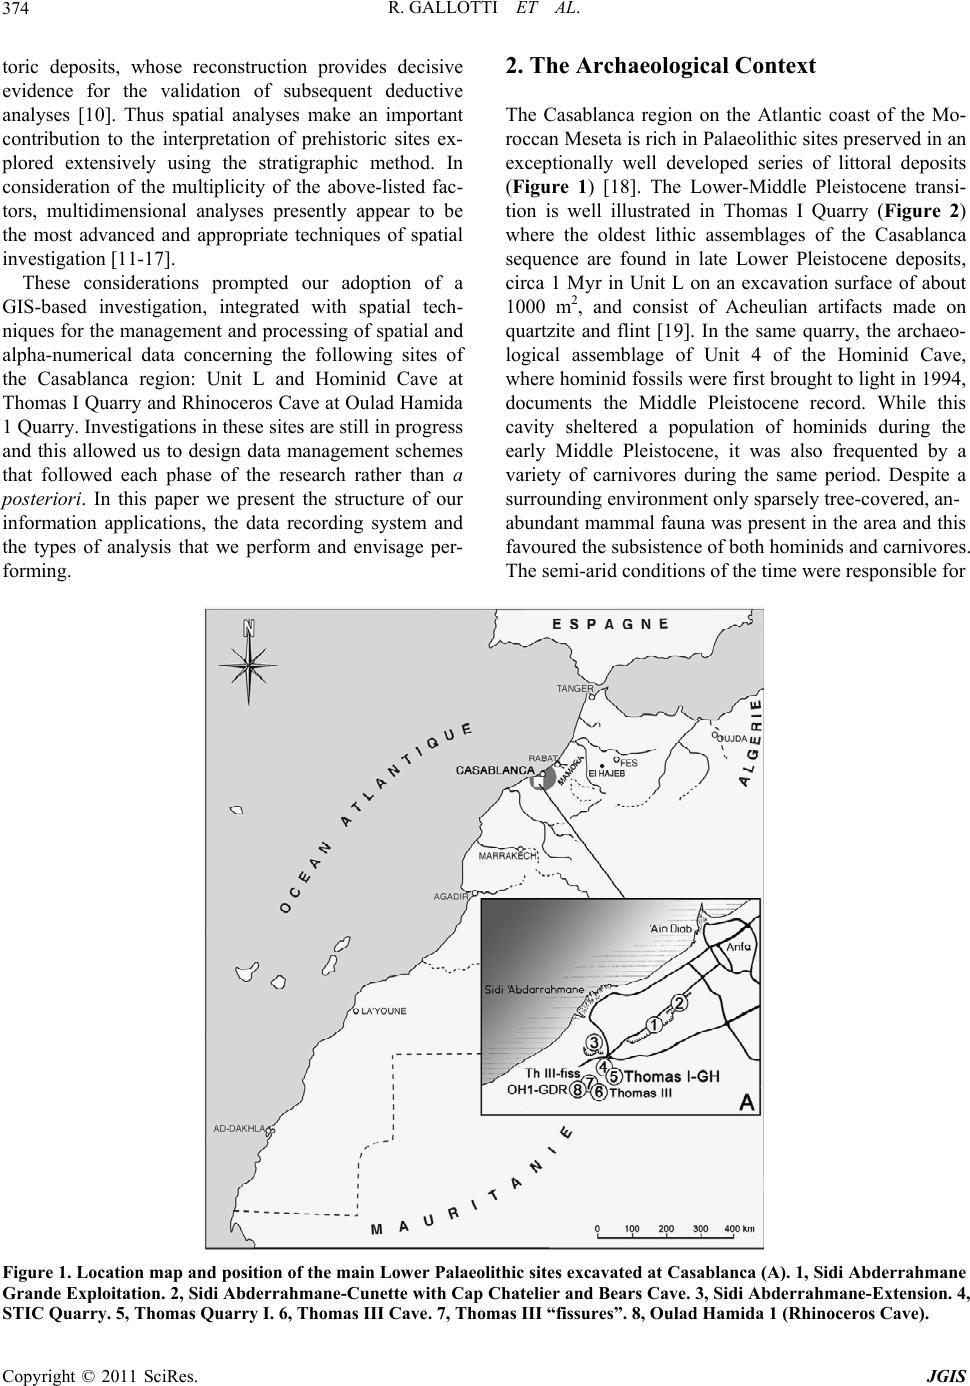 R. GALLOTTI ET AL. 374 toric deposits, whose reconstruction provides decisive evidence for the validation of subsequent deductive analyses [10]. Thus spatial analyses make an important contribution to the interpretation of prehistoric sites ex- plored extensively using the stratigraphic method. In consideration of the multiplicity of the above-listed fac- tors, multidimensional analyses presently appear to be the most advanced and appropriate techniques of spatial investigation [11-17]. These considerations prompted our adoption of a GIS-based investigation, integrated with spatial tech- niques for the management and processing of spatial and alpha-numerical data concerning the following sites of the Casablanca region: Unit L and Hominid Cave at Thomas I Quarry and Rhinoceros Cave at Oulad Hamida 1 Quarry. Investigations in these sites are still in progress and this allowed us to design data management schemes that followed each phase of the research rather than a posteriori. In this paper we present the structure of our information applications, the data recording system and the types of analysis that we perform and envisage per- forming. 2. The Archaeological Context The Casablanca region on the Atlantic coast of the Mo- roccan Meseta is rich in Palaeolithic sites p reserved in an exceptionally well developed series of littoral deposits (Figure 1) [18]. The Lower-Middle Pleistocene transi- tion is well illustrated in Thomas I Quarry (Figure 2) where the oldest lithic assemblages of the Casablanca sequence are found in late Lower Pleistocene deposits, circa 1 Myr in Unit L on an excavation surface of about 1000 m2, and consist of Acheulian artifacts made on quartzite and flint [19]. In the same quarry, the archaeo- logical assemblage of Unit 4 of the Hominid Cave, where hominid fossils were first brought to light in 1994, documents the Middle Pleistocene record. While this cavity sheltered a population of hominids during the early Middle Pleistocene, it was also frequented by a variety of carnivores during the same period. Despite a surrounding environment only sparsely tree-covered, an- abundant mammal fauna was present in the area and this favoured th e subsistence of both hominids and carnivor es. The semi-arid conditions of the time were responsible for Figure 1. Location map and position of the main Lower Palaeolithic sites excavated at Casablanca (A). 1, Sidi Abderrahmane Grande Exploitation. 2, Sidi Abderrahmane-Cunette with Cap Chatelier and Bears Cave. 3, Sidi Abderrahmane-Extension. 4, STIC Quarry. 5, Thomas Quarry I. 6, Thomas III Cave . 7, Thomas III “fissures”. 8, Oulad Hamida 1 (Rhinocer os Cave ). Copyright © 2011 SciRes. JGIS 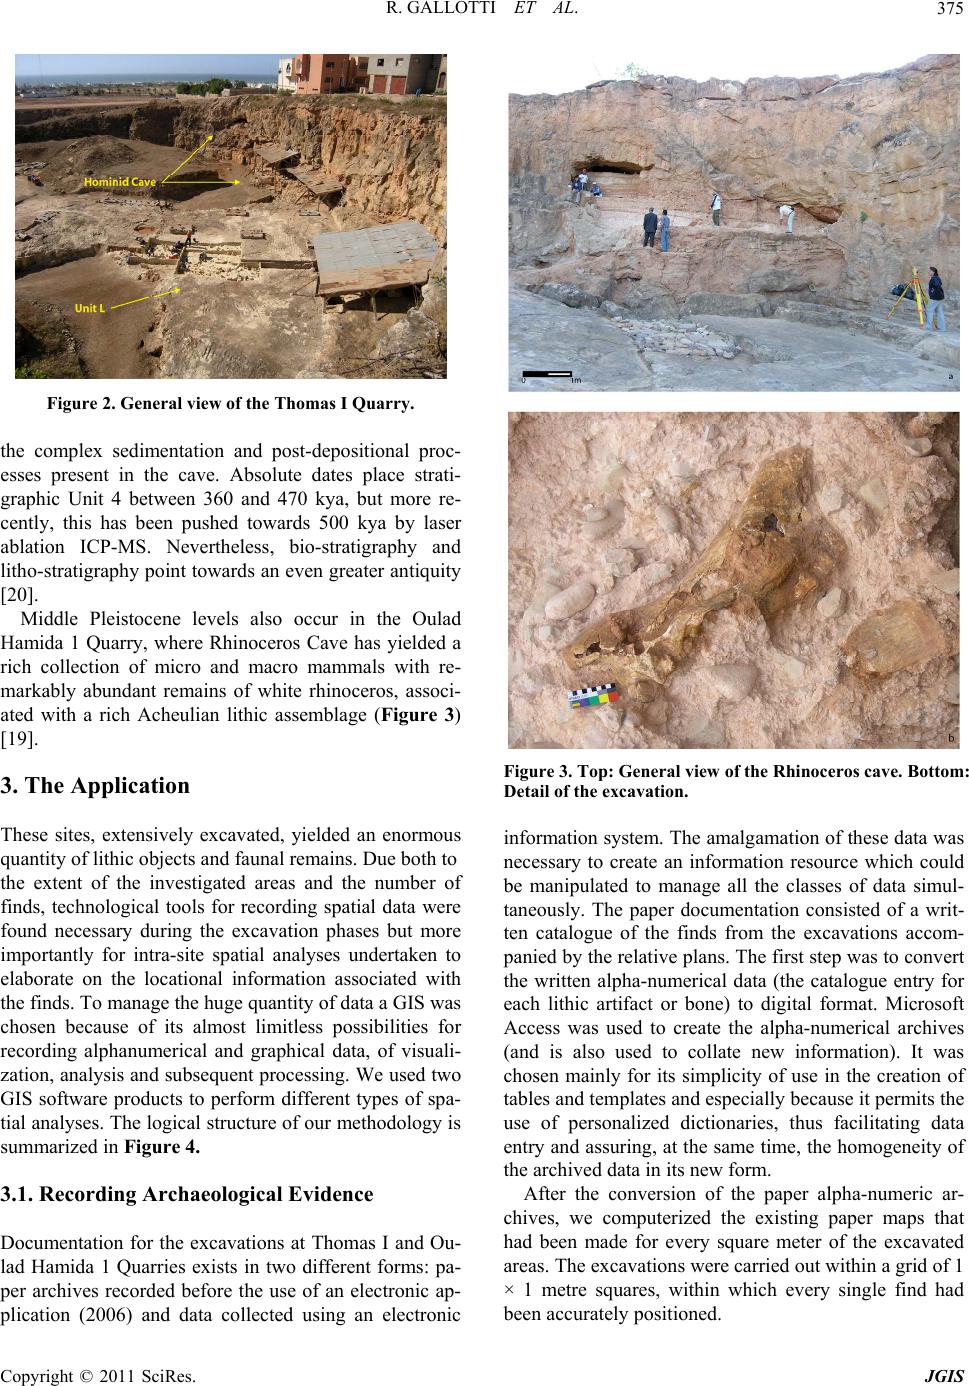 R. GALLOTTI ET AL. 375 Figure 2. General view of the Thomas I Quarry. the complex sedimentation and post-depositional proc- esses present in the cave. Absolute dates place strati- graphic Unit 4 between 360 and 470 kya, but more re- cently, this has been pushed towards 500 kya by laser ablation ICP-MS. Nevertheless, bio-stratigraphy and litho-stratigraphy point toward s an even greater antiquity [20]. Middle Pleistocene levels also occur in the Oulad Hamida 1 Quarry, where Rhinoceros Cave has yielded a rich collection of micro and macro mammals with re- markably abundant remains of white rhinoceros, associ- ated with a rich Acheulian lithic assemblage (Figure 3) [19]. 3. The Application These sites, extensively excavated, yielded an enormous quantity of lithic objects and faunal remains. Due both to the extent of the investigated areas and the number of finds, technological tools for recording spatial data were found necessary during the excavation phases but more importantly for intra-site spatial analyses undertaken to elaborate on the locational information associated with the finds. To manage the huge quantity o f data a GIS was chosen because of its almost limitless possibilities for recording alphanumerical and graphical data, of visuali- zation, analysis and subsequent processing. We used two GIS software products to perform different types of spa- tial analyses. The logical structure of our methodology is summarized in Figure 4. 3.1. Recording Archaeological Evidence Documentation for the excavations at Thomas I and Ou- lad Hamida 1 Quarries exists in two different forms: pa- per archives recorded before the use of an electronic ap- plication (2006) and data collected using an electronic Figure 3. Top: General view of the Rhinoceros cave. Bottom: Detail of the excavation. information system. The amalgamation of these data was necessary to create an information resource which could be manipulated to manage all the classes of data simul- taneously. The paper documentation consisted of a writ- ten catalogue of the finds from the excavations accom- panied by the relative plans. Th e first step was to co nvert the written alpha-numerical data (the catalogue entry for each lithic artifact or bone) to digital format. Microsoft Access was used to create the alpha-numerical archives (and is also used to collate new information). It was chosen mainly for its simplicity of use in the creation of tables and templates and especially because it permits the use of personalized dictionaries, thus facilitating data entry and assuring, at the same time, the homogeneity of the archived data in its new form. After the conversion of the paper alpha-numeric ar- chives, we computerized the existing paper maps that had been made for every square meter of the excavated areas. The excavations were carried out within a grid of 1 × 1 metre squares, within which every single find had been accurately positioned. C opyright © 2011 SciRes. JGIS 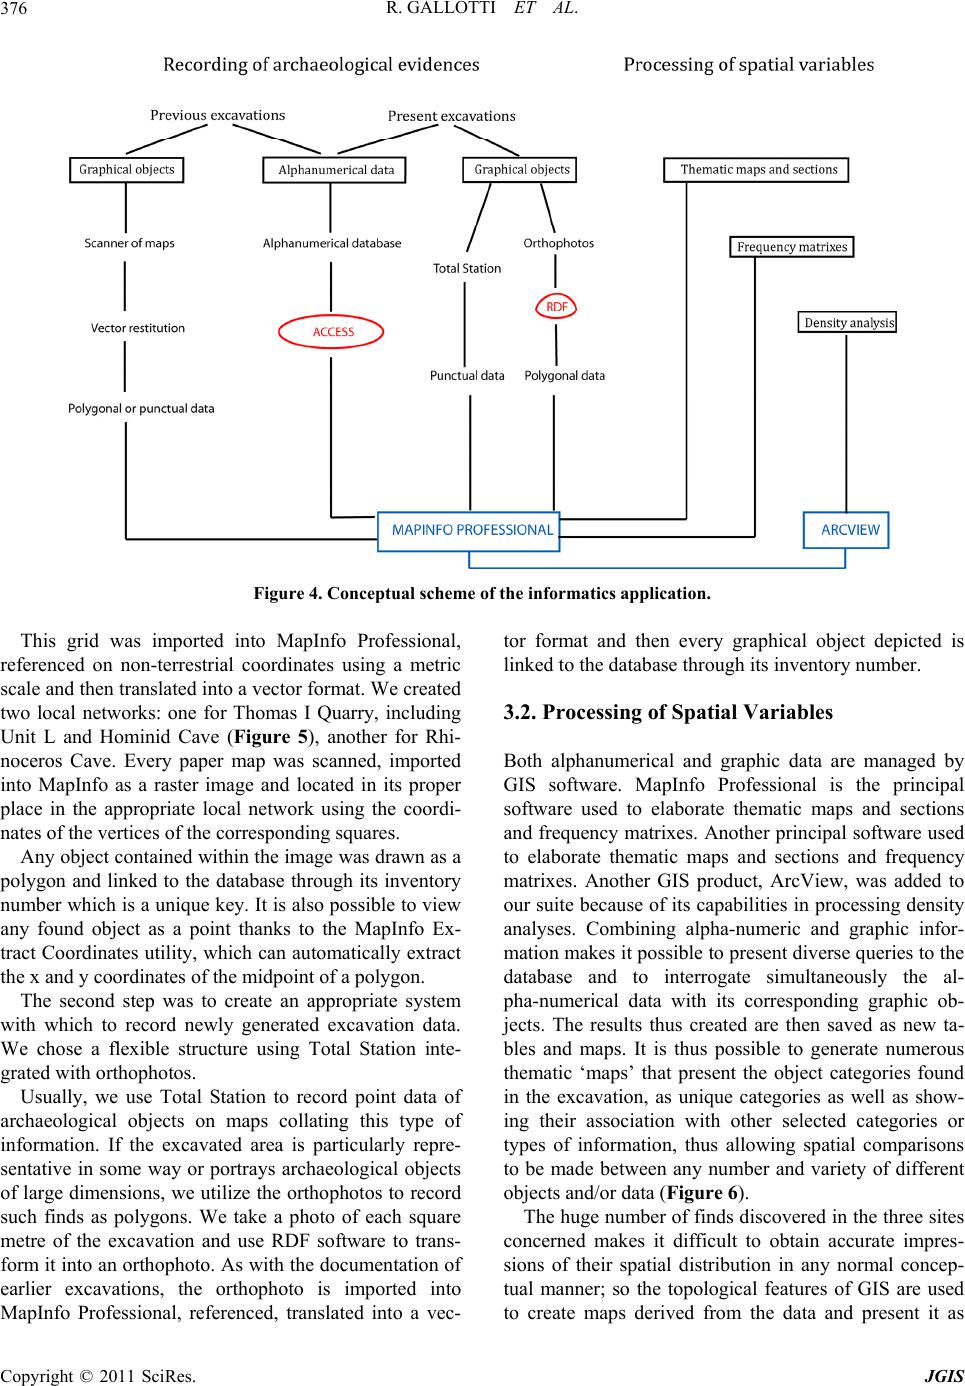 R. GALLOTTI ET AL. 376 Figure 4. Conceptual scheme of the informatics application. This grid was imported into MapInfo Professional, referenced on non-terrestrial coordinates using a metric scale and then translated into a vector format. We created two local networks: one for Thomas I Quarry, including Unit L and Hominid Cave (Figure 5), another for Rhi- noceros Cave. Every paper map was scanned, imported into MapInfo as a raster image and located in its proper place in the appropriate local network using the coordi- nates of the vertices of the corresponding squares. Any object contained within the image was drawn as a polygon and linked to the database through its inventory number which is a unique key. It is also possible to view any found object as a point thanks to the MapInfo Ex- tract Coordinates utility, which can au tomatically extract the x and y coordinates of the midpoint of a polygon. The second step was to create an appropriate system with which to record newly generated excavation data. We chose a flexible structure using Total Station inte- grated wi t h orthophotos. Usually, we use Total Station to record point data of archaeological objects on maps collating this type of information. If the excavated area is particularly repre- sentative in some way or portrays archaeological objects of large dimension s, we utilize the orthophotos to record such finds as polygons. We take a photo of each square metre of the excavation and use RDF software to trans- form it into an orthophoto. As with the documen tation of earlier excavations, the orthophoto is imported into MapInfo Professional, referenced, translated into a vec- tor format and then every graphical object depicted is linked to the database through its inventory number. 3.2. Processing of Spatial Variables Both alphanumerical and graphic data are managed by GIS software. MapInfo Professional is the principal software used to elaborate thematic maps and sections and frequency matrixes. Another principal software used to elaborate thematic maps and sections and frequency matrixes. Another GIS product, ArcView, was added to our suite because of its capabilities in processing density analyses. Combining alpha-numeric and graphic infor- mation makes it possible to present diverse queries to the database and to interrogate simultaneously the al- pha-numerical data with its corresponding graphic ob- jects. The results thus created are then saved as new ta- bles and maps. It is thus possible to generate numerous thematic ‘maps’ that present the object categories found in the excavation, as unique categories as well as show- ing their association with other selected categories or types of information, thus allowing spatial comparisons to be made between any number and variety of different objects and/or data (Figure 6). The huge number of finds discovered in the three sites concerned makes it difficult to obtain accurate impres- sions of their spatial distribution in any normal concep- tual manner; so the topological features of GIS are used to create maps derived from the data and present it as C opyright © 2011 SciRes. JGIS 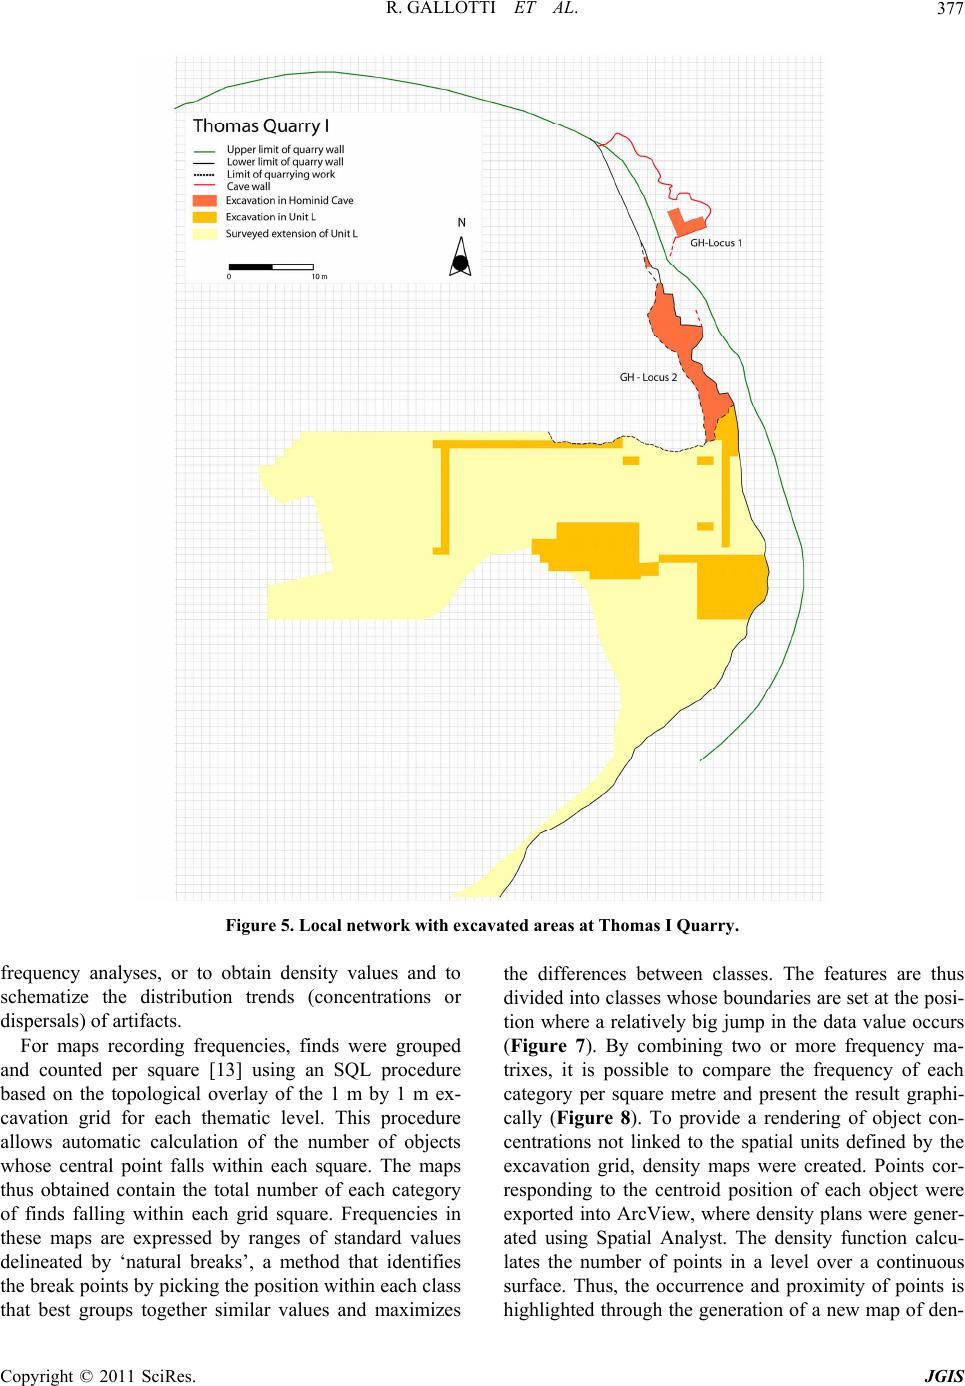 R. GALLOTTI ET AL. 377 Figure 5. Local network with excavated areas at Thomas I Quarry. frequency analyses, or to obtain density values and to schematize the distribution trends (concentrations or dispersals) of artifacts. For maps recording frequencies, finds were grouped and counted per square [13] using an SQL procedure based on the topological overlay of the 1 m by 1 m ex- cavation grid for each thematic level. This procedure allows automatic calculation of the number of objects whose central point falls within each square. The maps thus obtained contain the total number of each category of finds falling within each grid square. Frequencies in these maps are expressed by ranges of standard values delineated by ‘natural breaks’, a method that identifies the break points by picking the position within each class that best groups together similar values and maximizes the differences between classes. The features are thus divided into classes whose boundaries are set at the posi- tion where a relatively big jump in the data value occurs (Figure 7). By combining two or more frequency ma- trixes, it is possible to compare the frequency of each category per square metre and present the result graphi- cally (Figure 8). To provide a rendering of object con- centrations not linked to the spatial units defined by the excavation grid, density maps were created. Points cor- responding to the centroid position of each object were exported into ArcView, where density plans were gener- ated using Spatial Analyst. The density function calcu- lates the number of points in a level over a continuous surface. Thus, the occurrence and proximity of points is highlighted through the generation of a new map of den- C opyright © 2011 SciRes. JGIS 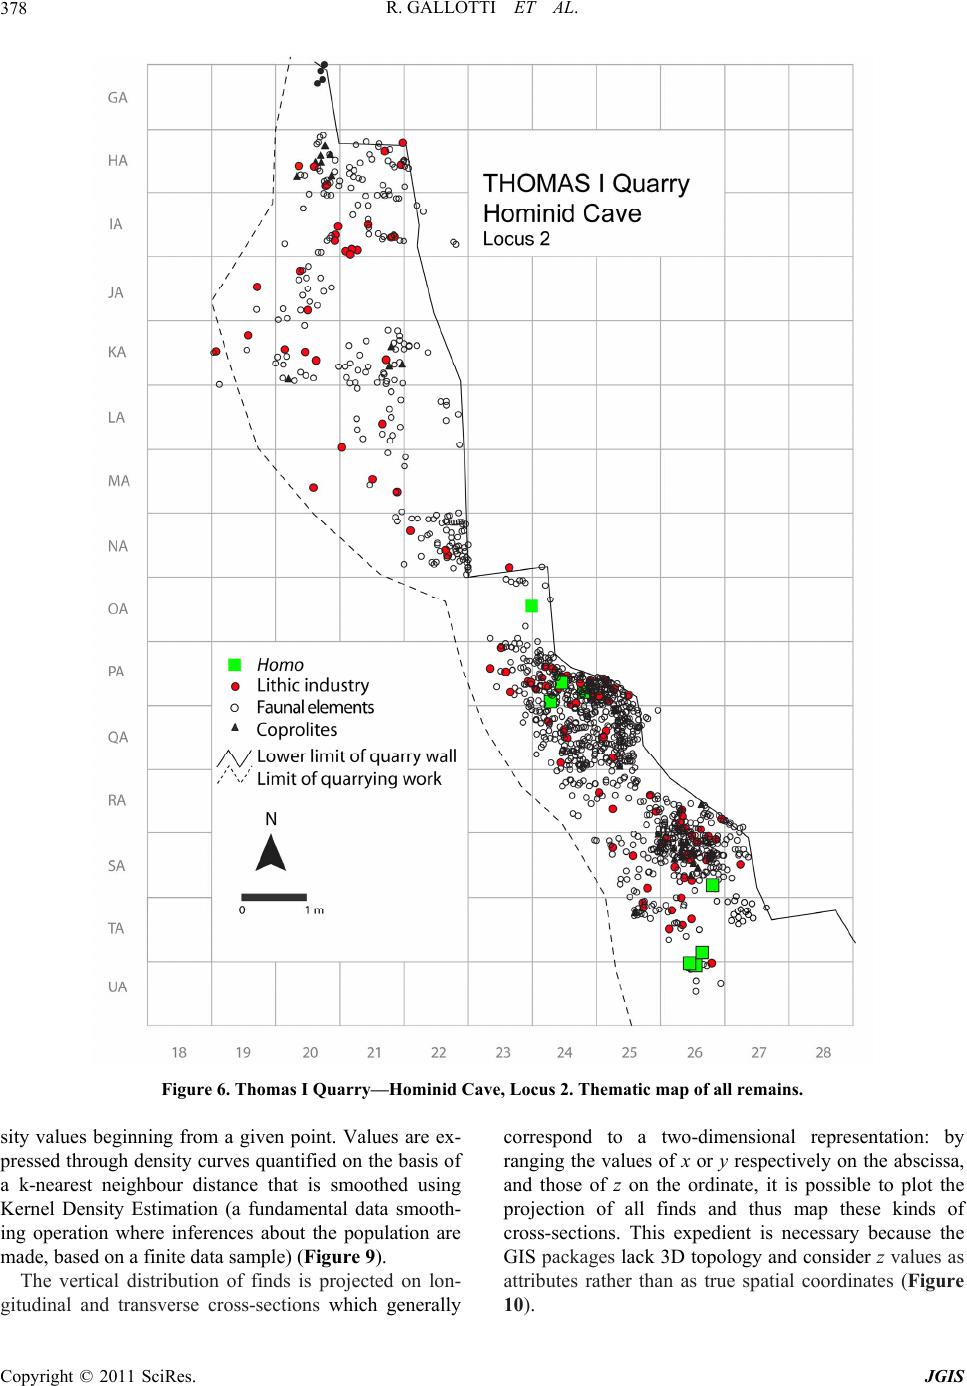 R. GALLOTTI ET AL. 378 Figure 6. Thomas I Quarry—Hominid Cave, Locus 2. Thematic map of all remains. sity values beginning from a given point. Values are ex- pressed through density curves quantified on the basis of a k-nearest neighbour distance that is smoothed using Kernel Density Estimation (a fundamental data smooth- ing operation where inferences about the population are made, based on a finite data sample) (Figure 9). The vertical distribution of finds is projected on lon- gitudinal and transverse cross-sections which generally correspond to a two-dimensional representation: by ranging the values of x or y respectively on the abscissa, and those of z on the ordinate, it is possible to plot the projection of all finds and thus map these kinds of cross-sections. This expedient is necessary because the GIS packages lack 3D topology and consider z values as attributes rather than as true spatial coordinates (Figure 10). C opyright © 2011 SciRes. JGIS 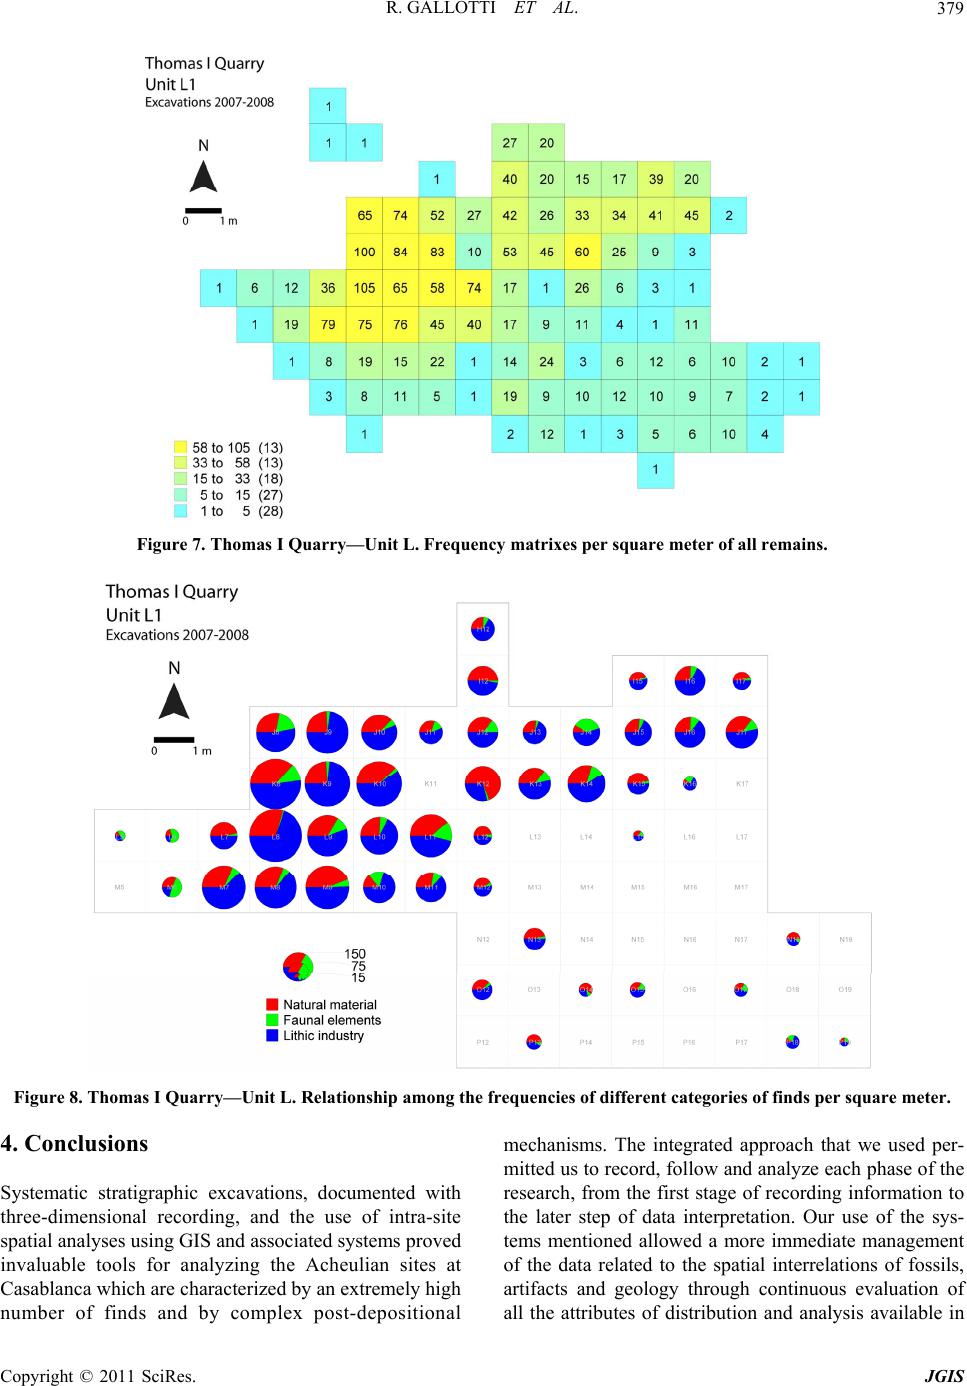 R. GALLOTTI ET AL. 379 Figure 7. Thomas I Quarry—Unit L. Frequency matrixes per square meter of all remains. Figure 8. Thomas I Quarry—Unit L. Relationship among the frequencies of different categories of finds per square meter. 4. Conclusions Systematic stratigraphic excavations, documented with three-dimensional recording, and the use of intra-site spatial analyses using GIS and associated systems proved invaluable tools for analyzing the Acheulian sites at Casablanca which are characterized by an extremely high number of finds and by complex post-depositional mechanisms. The integrated approach that we used per- mitted us to record, follow and analyze each phase of the research, from the first stage of recording information to the later step of data interpretation. Our use of the sys- tems mentioned allowed a more immediate management of the data related to the spatial interrelations of fossils, artifacts and geology through continuous evaluation of all the attributes of distribution and analysis available in C opyright © 2011 SciRes. JGIS 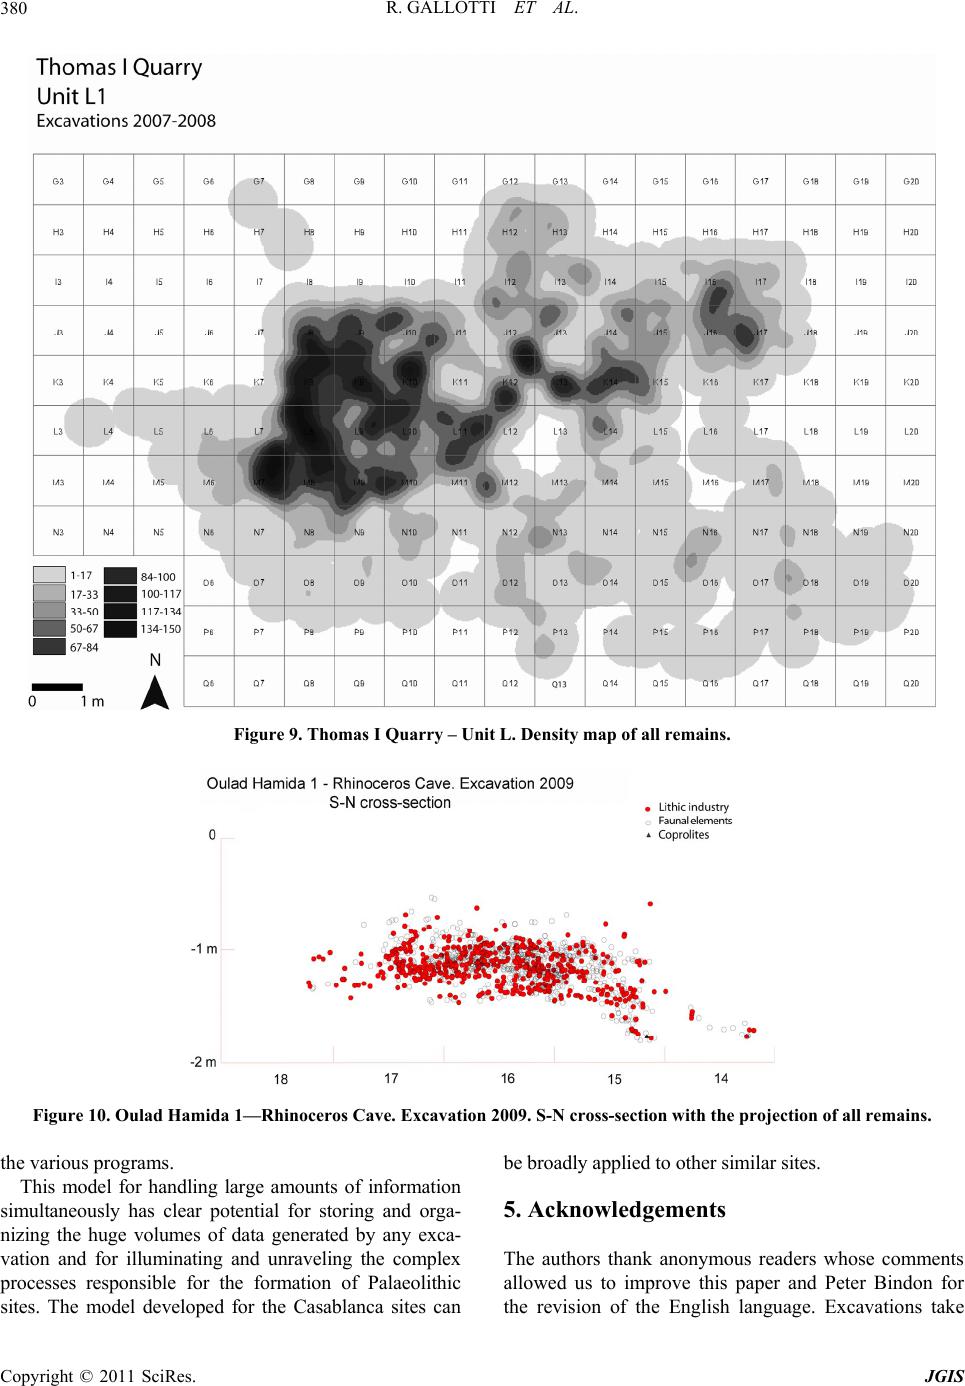 R. GALLOTTI ET AL. 380 Figure 9. Thomas I Quarry – Unit L. Density map of all remains. Figure 10. Oulad Hamida 1—Rhinoceros Cave. Excavation 2009. S-N cross-section with the projection of all remains. the various programs. This model for handling large amounts of information simultaneously has clear potential for storing and orga- nizing the huge volumes of data generated by any exca- vation and for illuminating and unraveling the complex processes responsible for the formation of Palaeolithic sites. The model developed for the Casablanca sites can be broadly appli e d t o other si milar sites. 5. Acknowledgements The authors thank anonymous readers whose comments allowed us to improve this paper and Peter Bindon for the revision of the English language. Excavations take C opyright © 2011 SciRes. JGIS  R. GALLOTTI ET AL.381 place within the frame of the Programme Casablanca of the Institut National des Sciences de l’Archéologie et du Patrimoine and are funded by Ministère de la Culture of Morocco, Ministère des Affaires étrangères et eu- ropéennes of France, Région Aquitaine and the Depart- ment of Human Evolution of Max Planck Institute for Evoluti onary Ant hropology at Leipzig. 6. References [1] A. D’Andrea, R. Gallotti and M. Piperno, “Applicazione di un GIS Intra-Site al Giacimento Paleolitico di Garba IV (Melka Kunture, Etiopia),” Archeologia e Calcolatori, Vol. 11, 2000, pp. 319-338. [2] R. Gallotti, M. Arzarello, G. Lembo, A. Minelli, U. Thun Hohenstein and C. Peretto, “Informatic Management of the Excavation Data of Isernia La Pineta (Molise, Italy),” Proceedings XIV UISPP Congress, Liegi, 2-8 September 2002, pp. 57-62. [3] R. Gallotti and M. Piperno, “Prehistoric Archaeology. The Site of Garba IV. Spatial Analysis of the Lithic Material from Level D,” In: J. Chavaillon and M. Piperno, Eds., Studies on the Early Paleolithic Site of Melka Kunture, Ethiopia, Origines, Florence, 2004, pp. 599-635. [4] D. Nigro, D. J. De Ruiter, L. R. Berger and P. S. Ungar, “A Tridimensional Geographic Information System for Swartkrans,” Meeting of the Paleoanthropology Society, Kansas City, March 27-28 2001. [5] D. Nigro, P. S. Ungar, D. J. De Ruiter and L. R. Berger, “Developing a Geographical Information System (GIS) for Mapping and Analysing Fossil Deposits at Swartkrans, Gauteng Province, South Africa,” Journal of Arch- aeological Science, Vol. 30, No. 3, 2003, pp. 317-324. doi:10.1006/jasc.2002.0839 [6] C. Santagata, J.-P. Raynal, J.-L. Guadelli, P. Fernandes and I. Fiore, “SIG Intra-Site et Analyse de la Distribution Spatiale des Vestiges,” In: J.-P. Raynal, Ed., La Grotte de Sainte-Anne I. Le Paléolithique Moyen de l’unité J1, Les dossiers de l’Archéo-Logis 3, l’Archéo-Logis/CDERAD, Laussonne, 2007, pp. 199-258. [7] J. Thomas, R. Potts and D. Cole, “The Role of GIS in the Interdisciplinary Investigation at Olorgesailie, Kenya, a Pleistocene Archaeological Locality”, In: M. Aldenderfer and H. D. G. Maschner, Eds., Anthropology, Space and Geographical Information System, Oxford University Press, New York, 1996, pp. 202-213. [8] N. Vullo, F. Fontana and A. Guerreschi, “The Application of GIS to Intra-Site Spatial Analysis: Pre- liminary Results from Alpe Veglia (VB) and Mondeval de Sora (BL), two Mesolithic sites, in Italian Alpes,” In: J. Barcelò, I. Briz and A. Vila, Eds., New Techniques for Old Times, Proceedings of the 26th CAA Conference, Barcelona, March 1998, pp. 111-115. [9] A. Malinsky-Buller, E. Hovers and O. Marder, “Making time: ‘Living FLOORS’, ‘Palimpsests’ and Site Formation Processes—A Perspective from the Open-Air Lower Paleolithic Site of Revadim Quarry,” Israel Jour- nal of Anthropological Archaeology, Vol. 30, No. 2, 2011, pp. 89-101. doi:10.1016/j.jaa.2010.11.002 [10] J.-P. Texier, “A Propos des Processus de Formation des Sites Préhistoriques,” Paléo, Vol. 12, No. 12, 2000, pp. 379-386. [11] F. Djindjian, “Improvements in Intrasite Spatial Analysis Techniques,” In: S. P. Q. Rahtz, Ed., Computer and Quantitative Methods in Archaeology, British Archaeo- logical Reports, Oxford, 1988, pp. 95-106. [12] F. Djindjian, “L’analyse Spatiale de L’habitat: État de l’art,” Archeologia e Calcolatori, Vol. 10, 1999, pp. 17- 32. [13] I. Hodder and C. Orton, “Spatial Analysis in Archaeo- logy,” CUP, Cambridge, 1976. [14] T. Johnson, “Contribution Méthodologique à L’étude de la Répartition des Vestiges dans les Niveaux Arch- éologiques,” Diplôme d’Etudes Supérieures, University of Bordeaux, Bordeaux, 1976. [15] K. W. Kintigh and A. J. Ammermann, “Heuristic App- roaches to Spatial Analysis in Archaeology,” American Antiquity, Vol. 47, No. 1, 1982, pp. 31-63. doi:10.2307/280052 [16] J. F. Simek, “A K-Means Approach to the Analysis of Spatial Structures in Upper Palaeolithic Habitation Sites: Le Flageolet I and Pincevent Section 36,” British Archaeological Reports, Oxford, 1984. [17] R. Whallon, “Unconstrained Clustering for the Analysis of Spatial Distributions in Archaeology,” In: H. J. Hietala, Ed., Intrasite Spatial Analysis in Archaeology, Cam- bridge University Press, Cambridge, 1984, pp. 242-277. [18] D. Lefèvre and J. P. Raynal, “Les Formations Plio- Pléistocènes de Casablanca et la Chronostratigraphie du Quaternaire marin du Maroc Revisitées,” Quaternaire, Vol. 13, No. 1, 2002, pp. 9-21. [19] J. P. Raynal, F. Z. Sbihi-Alaoui, L. Magoga, A. Mohib and M. Zouak, “Casablanca and the Early Occupation of North-Atlantic Morocco,” Quaternaire, Vol. 13, No. 1, 2002, pp. 65-77. doi:10.3406/quate.2002.1704 [20] J. P. Raynal, F. Z. Sbihi-Ala oui, A. Mohib, M. El Graoui, D. Lefèvre, J.-P. Texier, D. Geraads, J.-J. Hublin, T. Smith, P. Tafforeau, M. Zouak, R. Grün, E. J. Rhodes, S. Eggins, C. Daujeard, P. Fernandes, R. Gallotti, S. Hossini and A. Queffelec, “Hominid Cave at Thomas Quarry I (Casablanca, Morocco): Recent Findings and Their Con- text”, Quaternary International, Vols. 223-224, 2010, pp. 369-382. doi:10.1016/j.quaint.2010.03.011 Copyright © 2011 SciRes. JGIS |