

Paper Menu >>
Journal Menu >>
 Vol.2, No.6, 465-469 (2009) doi:10.4236/jbise.2009.26067 SciRes Copyright © 2009 Openly accessible at http://www.scirp.org/journal/JBISE/ JBiSE Diabetic diagnose test based on PPG signal and identification system Hadis Karimipour1, Heydar Toossian Shandiz1, Edmond Zahedi2 1School of Electrical Engineering, Shahrood University of Technology, Shahrood, Iran; 2School of Electrical Engineering, Sharif University of technology, Tehran, Iran. Email: [email protected]; [email protected] Received 11 May 2009; revised 29 June 2009; accepted 6 July 2009. ABSTRACT In this paper, photoplethysmogram (PPG) sig- nals from two classes consisting of healthy and diabetic subjects have been used to estimate the parameters of Auto-Regressive Moving Av- erage (ARMA) models. The healthy class con- sist s of 70 healthy and the diabetic classes of 70 diabetic patients. The estimated ARMA parame- ters have then been averaged for each class, leading to a unique representative model per class. The order of the ARMA model has been selected as to achieve the best classification. The resulting model produces a specificity of %91.4 and a sensitivity of, %100. The proposed technique may find applications in determining the diabetic state of a subject based on a non-invasive signal. Keywords: PPG Signal; Diabetic; Identification; ARMA Model 1. INTRODUCTION Diabetes has been recognized as fourth leading cause of death in developed countries. Prediction based on re- corded data in health centers worldwide shows that it is reaching epidemic proportions in many developing and newly industrialized nations [1]. When the body has difficulty regulating the amount of glucose in the blood stream Diabetes Mellitus has been occurred. Rising of the blood sugar lev el which will lead to hyperglycemia or hypoglycemia is due to the glucose accumulates in the bloodstream [2-3]. Glucose level above 150- 160mg/dl for long time poses significant health risk with possible long lasting effect [4]. Easy, low cost and on time recognizing diabetic with simple method and portable technology for the primary care and community-based clinical settings is the main goal of researchers in this area. The PPG technology has been used in a wide range of commercially available medical devices for measuring oxygen saturation, blood pressure and cardiac output [5]. Due to change in glucose level, the amount of blood volume in the figure changes, this variation can be measured by PPG. When a fixed source of infrared radiation is used, the variation of blood vol- ume act as a phototransistor and the receive signal is changed. This is why we use the PPG signal for recog- nizing the diabetic. In this work by filtering on pho- toplethysmography (PPG) signal and estimate ARMA model for healthy and patient, a method for recognizing diabetic is proposed. Field data shows this method work properly. 2. METHODOLOGY Identification systems methods are the best way for find- ing mathematic description of a black box. Figure 1 shows such a system in which only input and output ter- minals are introduced. If there is no a noise sourc e insi d e th e s ys te m or me as - urement input and output are noise free, the number of unknown parameters in the system can determine the number of required measurements. As the real systems mathematically describe with finite parameter, every- body can determine the mod el easily. Perturbation in the system parameter and noise in the measurements lead to parameter estimation of the system. Figure 2 shows the flow chart of each system identi- fication method. The prior knowledge is used in all part of the model calculation. Based on the prior knowledge the experiment is set up to produce the data. The data have to be as much as informative. The observer adjusts the frequency content and amplitude of the input signals in the system with external input or chose the probab ility density function (PDF) in the system with unknown in- put. Figure 1. A black box system. 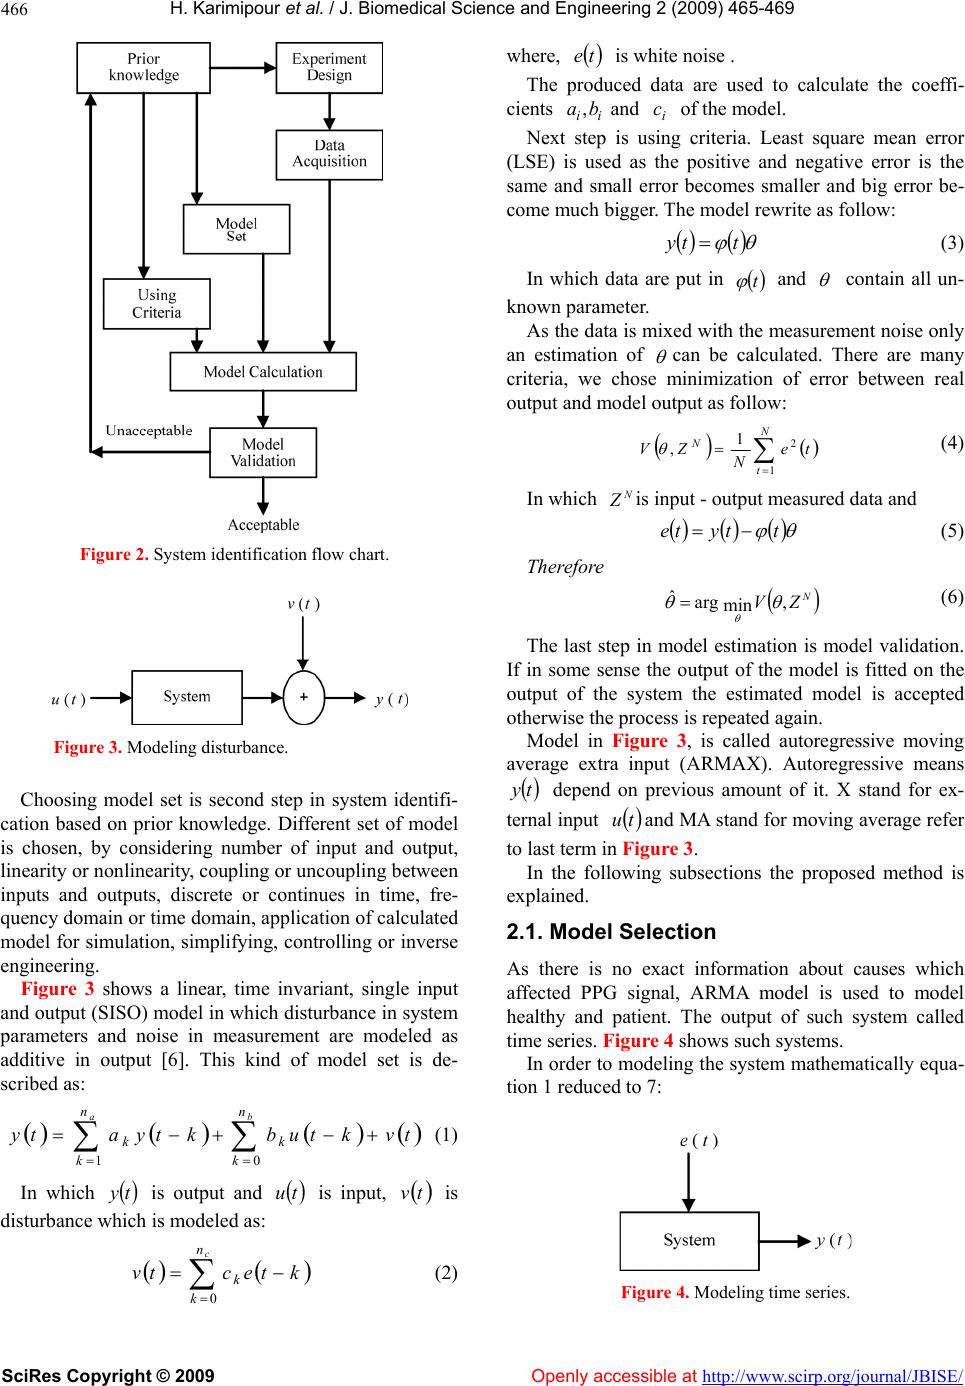 H. Karimipour et al. / J. Biomedical Science and Engi neering 2 (2009) 465 -469 SciRes Copyright © 2009 Openly accessible at http://www.scirp.org/journal/JBISE/ 466 Figure 2. System identification flow chart. Figure 3. Modeling disturbance. Choosing model set is second step in system identifi- cation based on prior knowledge. Different set of model is chosen, by considering number of input and output, linearity or nonlinearity, coupling or uncoupling between inputs and outputs, discrete or continues in time, fre- quency domain or time domain, application of calculated model for simulation, simplifying, controlling or inverse engineering. Figure 3 shows a linear, time invariant, single input and output (SISO) model in which disturbance in system parameters and noise in measurement are modeled as additive in output [6]. This kind of model set is de- scribed as: tvktubktyaty ba n k k n k k 01 (1) In which is output and is input, ty tu tv is disturbance which is modeled as: c n k kktectv 0 (2) where, te is white noise . The produced data are used to calculate the coeffi- cients and of the model. ii ba ,i c Next step is using criteria. Least square mean error (LSE) is used as the positive and negative error is the same and small error becomes smaller and big error be- come much bigger. The model rewrite as follow: tty (3) In which data are put in t and contain all un- known parameter. As the data is mixed with the measurement noise only an estimation of can be calculated. There are many criteria, we chose minimization of error between real output and model output as follow: N t Nte N ZV 1 2 1 , (4) In which N Z is input - outp ut m easured data and ttyte (5) Therefore (6) N ZV , min arg ˆ The last step in model estimation is model validation. If in some sense the output of the model is fitted on the output of the system the estimated model is accepted otherwise the process is repeated again. Model in Figure 3, is called autoregressive moving average extra input (ARMAX). Autoregressive means ty depend on previous amount of it. X stand for ex- ternal input tu and MA stand for moving average refer to last term in Figur e 3. In the following subsections the proposed method is explained. 2.1. Model Selection As there is no exact information about causes which affected PPG signal, ARMA model is used to model healthy and patient. The output of such system called time series. Figur e 4 shows such systems. In order to modeling the system mathematically equa- tion 1 reduced t o 7: Figure 4. Modeling time series. 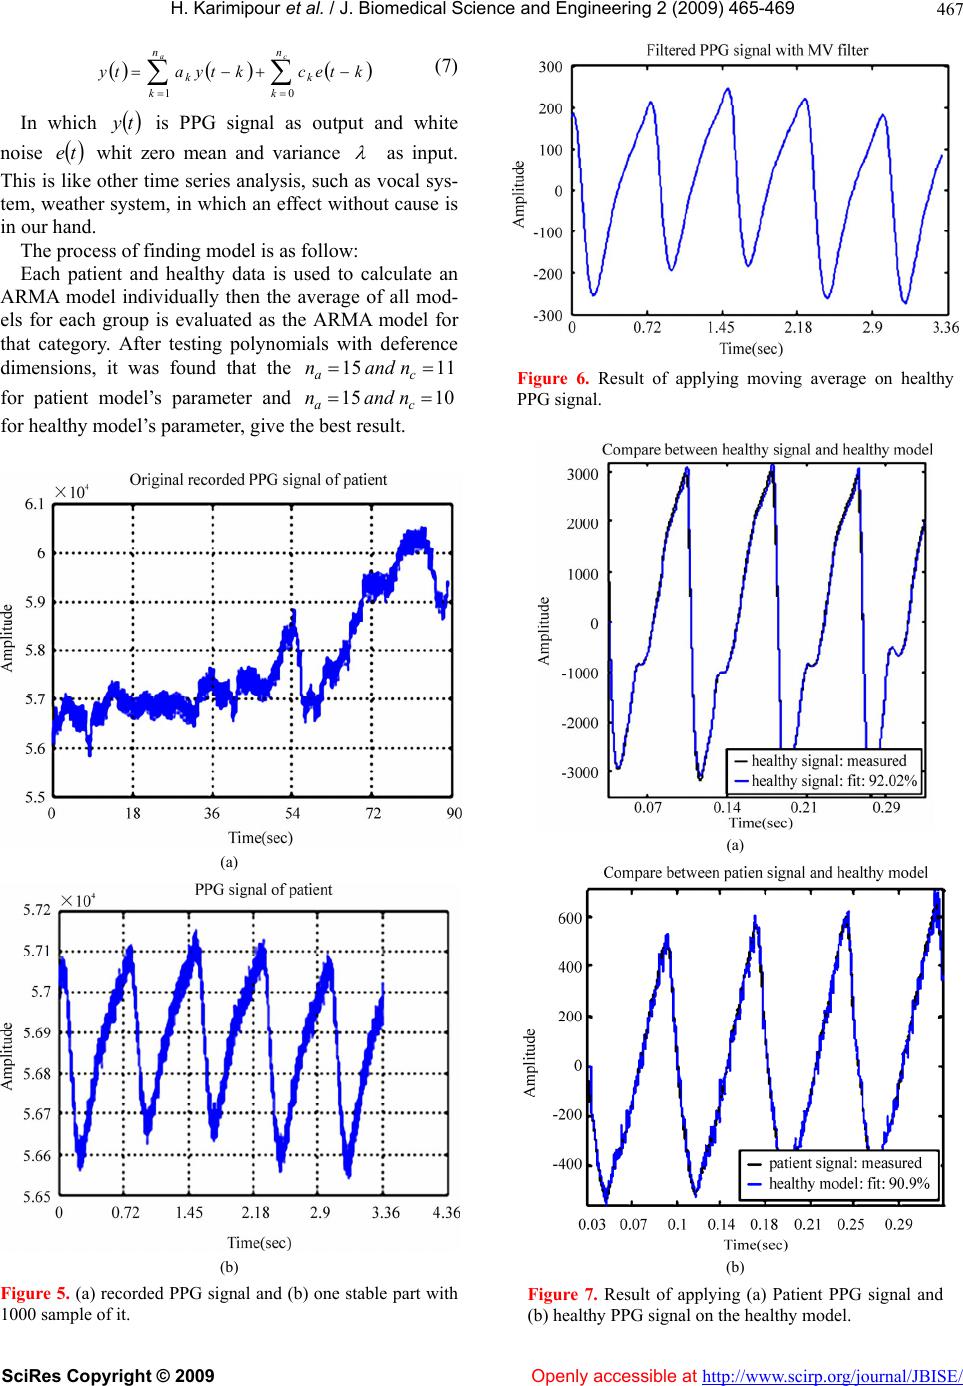 H. Karimipour et al. / J. Biomedical Science and Engi neering 2 (2009) 465 -469 SciRes Copyright © 2009 Openly accessible at http://www.scirp.org/journal/JBISE/ 467 ca n k k n k kktecktyaty 01 (7) In which is PPG signal as output and white noise whit zero mean and variance ty te as input. This is like other time series analysis, such as vocal sys- tem, weather system, in which an effect without cause is in our hand. The process of finding model is as follow: Each patient and healthy data is used to calculate an ARMA model individually then the average of all mod- els for each group is evaluated as the ARMA model for that category. After testing polynomials with deference dimensions, it was found that the 11 15 ca nandn 10 15 for patient model’s parameter and ca nandn for healthy model’s parameter, give the best result. (a) (b) Figure 5. (a) recorded PPG signal and (b) one stable part with 1000 sample of it. Figure 6. Result of applying moving average on healthy PPG signal. (a) (b) Figure 7. Result of applying (a) Patient PPG signal and (b) healthy PPG signal on the healthy model. 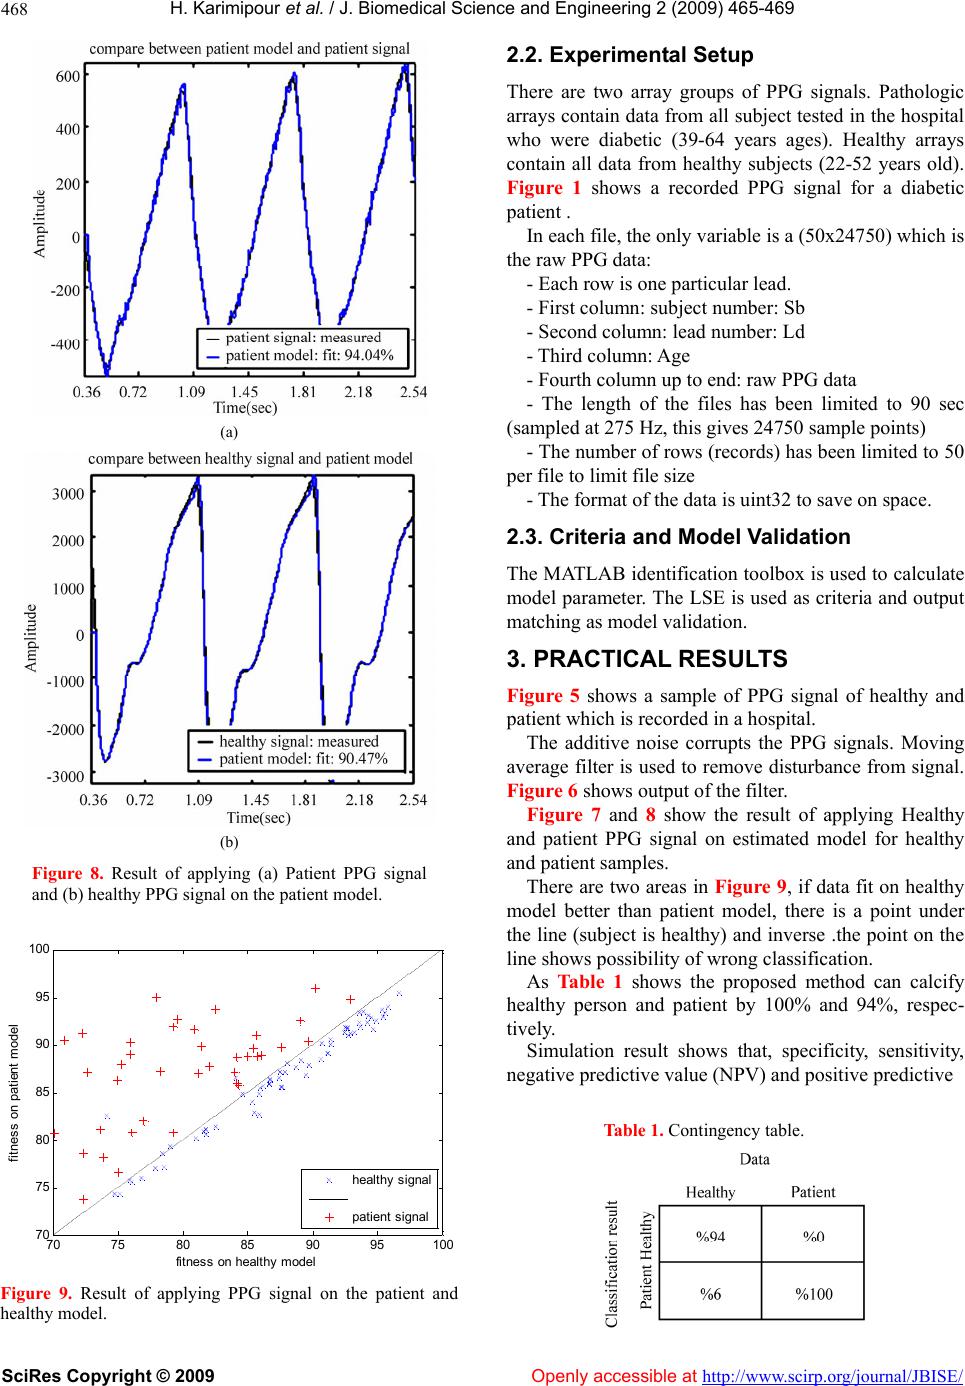 H. Karimipour et al. / J. Biomedical Science and Engi neering 2 (2009) 465 -469 SciRes Copyright © 2009 Openly accessible at http://www.scirp.org/journal/JBISE/ 468 (a) (b) Figure 8. Result of applying (a) Patient PPG signal and (b) healthy PPG signal on the patient model. 70 7580859095100 70 75 80 85 90 95 100 fitness on healthy model f i t ness on pati ent m odel healt hy signal pati ent si gnal Figure 9. Result of applying PPG signal on the patient and healthy model. 2.2. Experimental Setup There are two array groups of PPG signals. Pathologic arrays contain data from all subject tested in th e hospital who were diabetic (39-64 years ages). Healthy arrays contain all data from healthy subjects (22-52 years old). Figure 1 shows a recorded PPG signal for a diabetic patient . In each file, the only variable is a (50x24750) which is the raw PPG data: - Each row is one particular lead. - First column: subject number: Sb - Second column: lead number: Ld - Third column: Age - Fourth column up to end: raw PPG data - The length of the files has been limited to 90 sec (sampled at 275 Hz, this gives 24750 sample points) - The number of rows (records) has been limited to 50 per file to limit file size - The format of the data is uint32 to save on space. 2.3. Criteria and Model Validation The MATLAB identification toolbox is used to calculate model parameter. The LSE is used as criteria and output matching as model validation. 3. PRACTICAL RESULTS Figure 5 shows a sample of PPG signal of healthy and patient which is recorded in a hospital. The additive noise corrupts the PPG signals. Moving average filter is used to remove disturbance from signal. Figure 6 shows output of the filter. Figure 7 and 8 show the result of applying Healthy and patient PPG signal on estimated model for healthy and patient samples. There are two areas in Figure 9, if data fit on healthy model better than patient model, there is a point under the line (subject is healthy) an d inverse .the point on the line shows possibility of wrong classification. As Table 1 shows the proposed method can calcify healthy person and patient by 100% and 94%, respec- tively. Simulation result shows that, specificity, sensitivity, negative predictive value (NPV) and positive predictive Table 1. Contingency table.  H. Karimipour et al. / J. Biomedical Science and Engi neering 2 (2009) 465 -469 SciRes Copyright © 2009 http://www.scirp.org/journal/JBISE/ 469 value (PPV) is % 91.4, % 100, % 100, and % 92.1 spectfully. 4. CONCLUSIONS The proposed technique using non-invasive PPG signal is able to separate healthy subjects from pats using an ARMA model. One potial applicatn of these eeded to be injected to diabetic people. MENTS ussels: http://www.eatlas.idf.org/webdata/docs/Atlas%202003-S ummary.pdf. re-[2] H. L. Wee, H. K. Ho, and S. C. Li, (2002) Public awareness of diabetes mellitus in singapore, J .Singapore [3] Romanillos Palerm, (2003) Drug infusion Med 43(3), 128–134. Cesar Carlos s control: An extended direct model reference adaptive control strategy, PhD thesis, Rensselaer Polytechnic Institute, Tro y, N ew Y tien ioten ork. [4] V. Carmen Doran, H. Nicolas Hudson, T. Katherine, J. Moorhead, Geoffrey Chase, M. Geoffrey Shaw, and E. Chris Hann, (2004) Derivative weighted active insulin control modelling and clin models could be to estimate the state of diabetes of pa- tients and eventually be used in controlling the amount of insulin nical trials for ICU patients, Elsevier ju, Medical Engineering & Physics. [5] V. K. Jayasree, T. V. Sandhya, and P. Radhakrishnan (2008) Non-invasive studies on age related parameters using a blood volume pulse sensor, Measurment Science Reveiw, 8(4), Section 2. 5. ACKNOWLEDGE The authors gratefully acknowledge the PPG signals kindly provided by the Faculty of Engineering and Built Environment, University Ke- bangssan Malaysia. REFERENCES [1] D. Gan, editor, (2003) Diabetes atlas, 2nd Edition, Br Openly accessible at International Diabetes Federation, [6] L. Ljung, (1999) System identification: theory for user, Second edition, Prentice Hall. |