

Paper Menu >>
Journal Menu >>
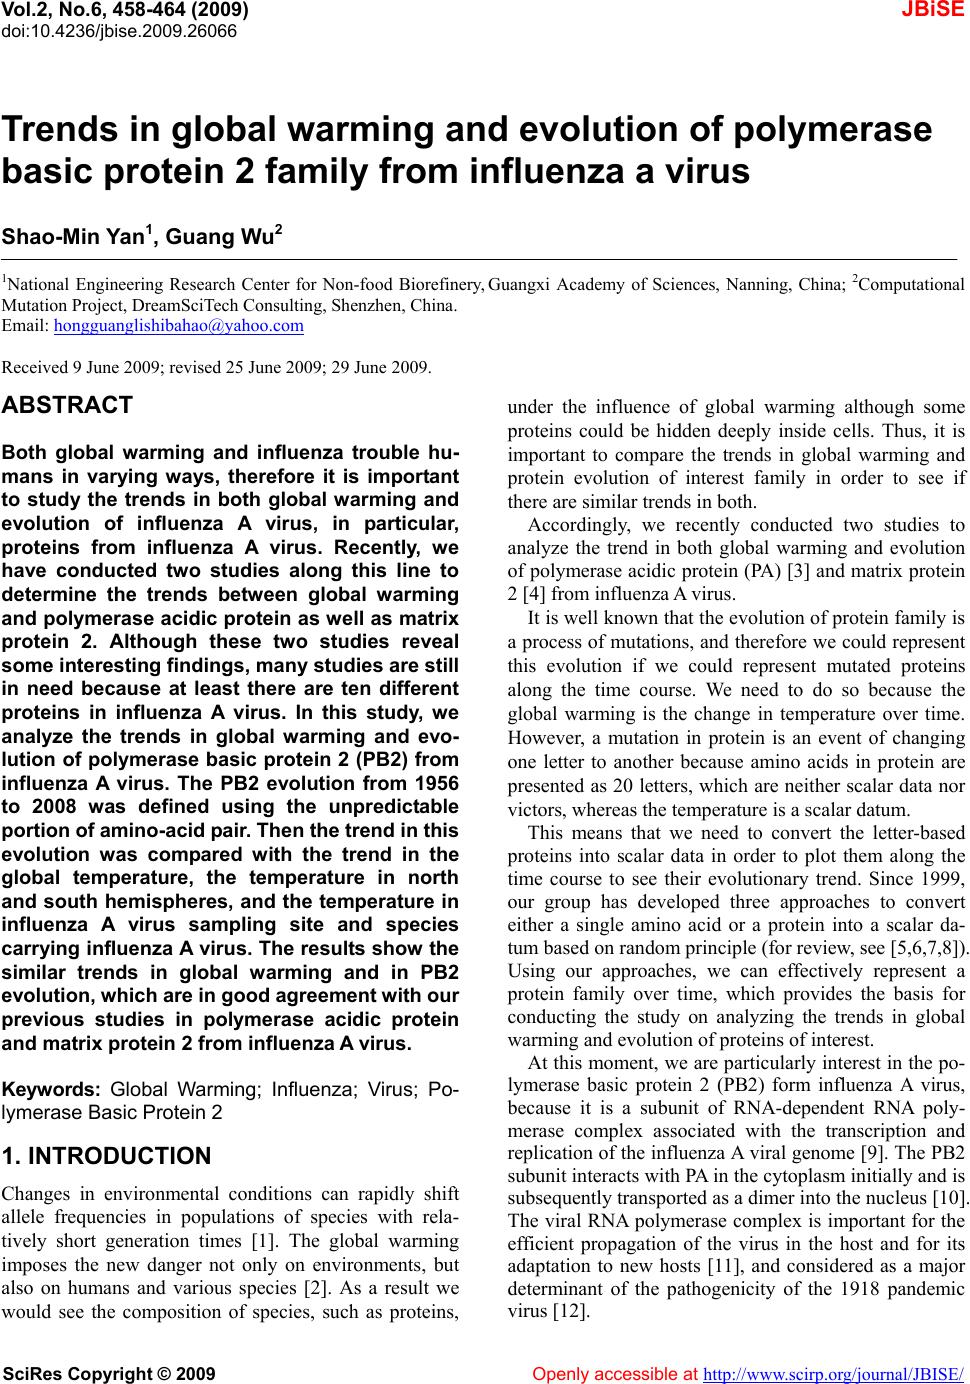 Vol.2, No.6, 458-464 (2009) doi:10.4236/jbise.2009.26066 SciRes Copyright © 2009 Openly accessible at http://www.scirp.org/journal/JBISE/ JBiSE Trends in global warming and evolution of polymerase basic protein 2 family from influenza a virus Shao-Min Yan1, Guang Wu2 1National Engineering Research Center for Non-food Biorefinery, Guangxi Academy of Sciences, Nanning, China; 2Computation al Mutation Project, DreamSciTech Consulting, Shenzhen, China. Email: [email protected] Received 9 June 2009; revised 25 June 2009; 29 June 2009. ABSTRACT Both global warming and influenza trouble hu- mans in varying ways, therefore it is important to study the trends in both global warming and evolution of influenza A virus, in particular, proteins from influenza A virus. Recently, we have conducted two studies along this line to determine the trends between global warming and polymerase acidic protein as well as matrix protein 2. Although these two studies reveal some interesting findings, many studies are still in need because at least there are ten different proteins in influenza A virus. In this study, we analyze the trends in global warming and evo- lution of polymerase basic protein 2 (PB2) from influenza A virus. The PB2 evolution from 1956 to 2008 was defined using the unpredictable portion of amino-acid p air. Then the trend in this evolution was compared with the trend in the global temperature, the temperature in north and south hemispheres, and the temperature in influenza A virus sampling site and species carrying influenza A virus. The results show the similar trends in global warming and in PB2 evolution , which are in good agreem ent with our previous studies in polymerase acidic protein and matrix protein 2 from influenza A v irus. Keywords: Global Warming; Influenza; Virus; Po- lymerase Bas ic Protein 2 1. INTRODUCTION Changes in environmental conditions can rapidly shift allele frequencies in populations of species with rela- tively short generation times [1]. The global warming imposes the new danger not only on environments, but also on humans and various species [2]. As a result we would see the composition of species, such as proteins, under the influence of global warming although some proteins could be hidden deeply inside cells. Thus, it is important to compare the trends in global warming and protein evolution of interest family in order to see if there are similar trends in both. Accordingly, we recently conducted two studies to analyze the trend in both global warming and evolution of polymerase acidic protein (PA) [3] and matrix protein 2 [4] from influenza A virus. It is well known that the evolution of protein family is a process of mutations, and th erefore we could represent this evolution if we could represent mutated proteins along the time course. We need to do so because the global warming is the change in temperature over time. However, a mutation in protein is an event of changing one letter to another because amino acids in protein are presented as 20 letters, which are neither scalar data nor victors, whereas the temperature is a scalar datum. This means that we need to convert the letter-based proteins into scalar data in order to plot them along the time course to see their evolutionary trend. Since 1999, our group has developed three approaches to convert either a single amino acid or a protein into a scalar da- tum based on random principle (for review, see [5,6,7,8]). Using our approaches, we can effectively represent a protein family over time, which provides the basis for conducting the study on analyzing the trends in global warming and evolution of proteins of interest. At this moment, we are particularly interest in the po- lymerase basic protein 2 (PB2) form influenza A virus, because it is a subunit of RNA-dependent RNA poly- merase complex associated with the transcription and replication of the influenza A viral genome [9]. The PB2 subunit interacts with PA in th e cytoplasm initially an d is subsequently transported as a dimer into the n uc leus [10 ]. The viral RNA polymerase complex is important for the efficient propagation of the virus in the host and for its adaptation to new hosts [11], and considered as a major determinant of the pathogenicity of the 1918 pandemic viru s [12]. 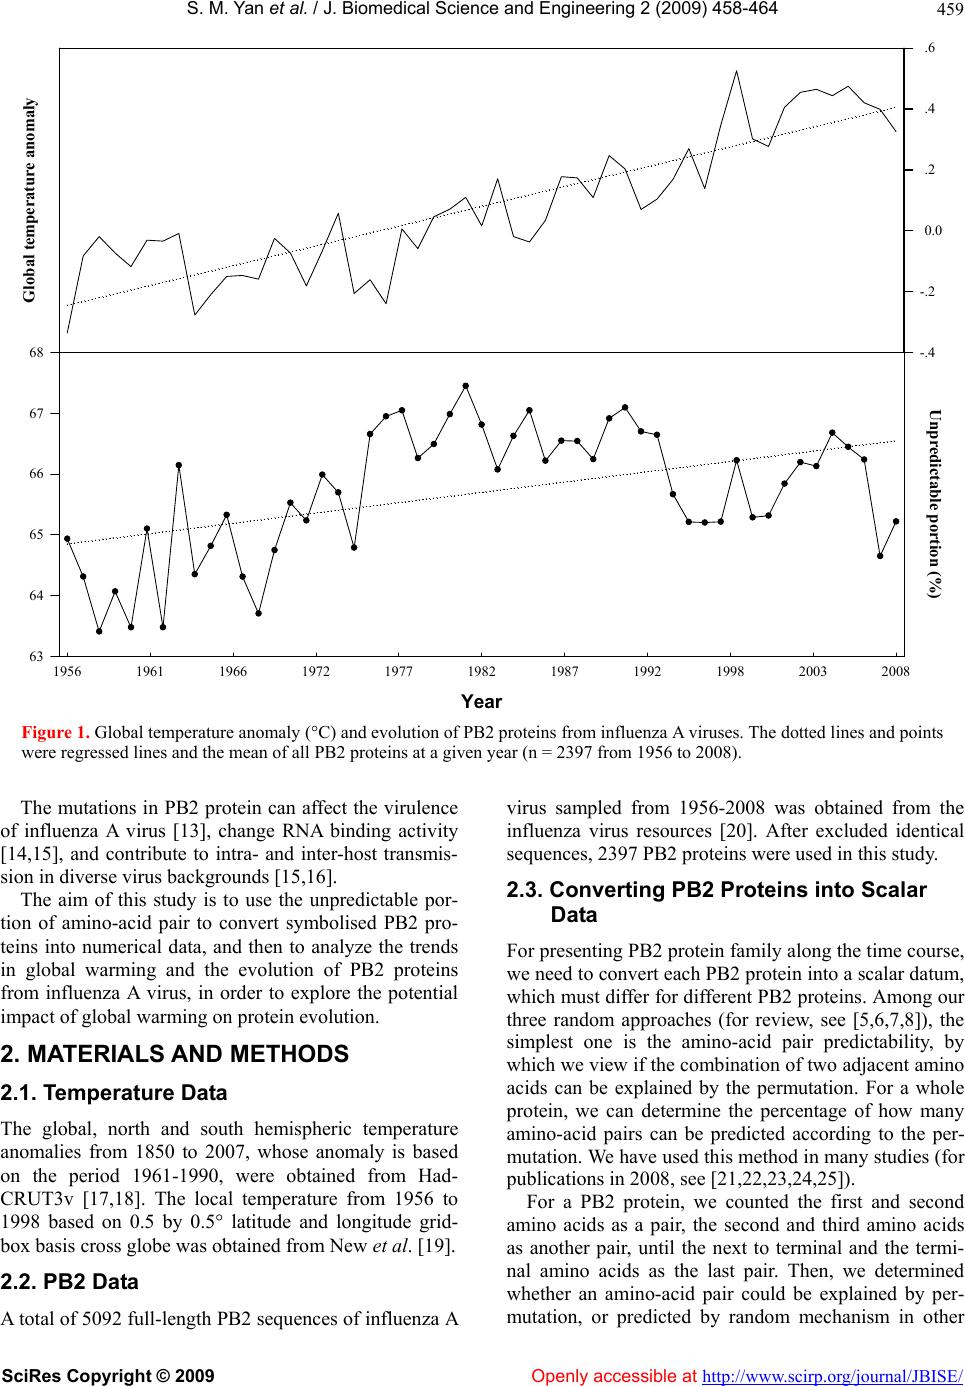 S. M. Yan et al. / J. Biomedical Science and Engineerin g 2 (2009) 458-464 SciRes Copyright © 2009 http://www.scirp.org/journal/JBISE/ 459 Global temperature anomaly -.4 -.2 0.0 .2 .4 .6 Year 1956 1961 1966 1972 1977 1982 1987 1992 1998 2003 2008 63 64 65 66 67 68 Unpredictable portion (%) Figure 1. Global temperature anomaly (°C) and evolution of PB2 proteins from influenza A viruses. The dotted lines and points were regressed lines and the mean of all PB2 proteins at a given year (n = 2397 from 1956 to 2008). The mutations in PB2 protein can affect the virulence of influenza A virus [13], change RNA binding activity [14,15], and contribute to intra- and inter-host transmis- sion in diverse virus backgrounds [15,16]. Openly accessible at The aim of this study is to use the unpredictable por- tion of amino-acid pair to convert symbolised PB2 pro- teins into numerical data, and then to analyze the trends in global warming and the evolution of PB2 proteins from influenza A virus, in order to explore the potential impact of glob a l warming on prot ei n ev olution. 2. MATERIALS AND METHODS 2.1. Temperature Data The global, north and south hemispheric temperature anomalies from 1850 to 2007, whose anomaly is based on the period 1961-1990, were obtained from Had- CRUT3v [17,18]. The local temperature from 1956 to 1998 based on 0.5 by 0.5° latitude and longitude grid- box basis cross globe was obtained from New et al. [19]. 2.2. PB2 Data A total of 509 2 full-length PB2 sequences of influenza A virus sampled from 1956-2008 was obtained from the influenza virus resources [20]. After excluded identical sequences, 2397 PB2 proteins were used in this study. 2.3. Converting PB2 Proteins into Scalar Data For presenting PB2 protein family along the time course, we need to convert each PB2 protein into a scalar datum, which must differ for different PB2 proteins. Among our three random approaches (for review, see [5,6,7,8]), the simplest one is the amino-acid pair predictability, by which we view if the combination of two adjacent amino acids can be explained by the permutation. For a whole protein, we can determine the percentage of how many amino-acid pairs can be predicted according to the per- mutation. We have used this method in many studies (for publications in 2008, see [21,22,23,24,25]). For a PB2 protein, we counted the first and second amino acids as a pair, the second and third amino acids as another pair, until the next to terminal and the termi- nal amino acids as the last pair. Then, we determined whether an amino-acid pair could be explained by per- mutation, or predicted by random mechanism in other  S. M. Yan et al. / J. Biomedical Science and Engineerin g 2 (2009) 458-464 SciRes Copyright © 2009 Openly accessible at http://www.scirp.org/journal/JBISE/ 460 Anomaly temperature -.4 -.2 0.0 .2 .4 .6 63 64 65 66 67 68 Unpredic tabl e portion (%) Anomaly temperature -.4 -.2 0.0 .2 .4 Year 1956 1961 1966 1972 1977 1982 1987 1992 1998 2003 2008 62 63 64 65 66 67 68 69 70 Unpredictable portion (%) North hemisphere South hemisphere Figure 2. Trends in temperature and PB2 evolution grouped according to north (n = 2177) and south (n = 220) hemispheres. The dotted lines were regressed lines.  S. M. Yan et al. / J. Biomedical Science and Engineerin g 2 (2009) 458-464 SciRes Copyright © 2009 Openly accessible at http://www.scirp.org/journal/JBISE/ 461 words. Finally, we calculated the percentage of how many amino-acid pairs were predictable and unpredict- able in a PB2 protein. For example, a PB2 protein (strain A/Virginia/UR06- 0139/2007(H1N1) and accession number ABW40267) was composed of 759 amino acids. There were 53 threonines “T” and 59 arginines “R” in this protein. If the appearance of amino-acid pair TR could be ex- plained by the permutation, it would appear 4 times in the PB2 protein (53/75959/758758=4.12). Act ually there were 4 pairs of TR in it, so the appearance of TR was predictable. By clear contrast, there were 34 aspara- gines “N” and 28 prolines “P” in this PB2 protein. Ac- cording to the permutation, the amino-acid pair NP would appear once (34/75928/758=1.25) in this pr o- tein. However, it appeared 5 times in realty, which was unpredictable. In this way, we classified all of the amino- acid pairs in ABW40267 PB2 protein as predict- able and unpredictable. It is absolutely necessary that the predictable/unpre- dictable portion is subject to a tiny difference between two PB2 proteins, thus different PB2 proteins should have different values to be distinguishable. In the past, we have tested many proteins to verify this request and got the positive answer [3,4,5,6,7,8,21,22,23,24,25]. For instance, the predictable and unpredictable portions were 36.49% and 63.51% for AB W40267 PB 2 prot ein. Ano t he r human H1N1 influenza A virus was isolated from USA in 2007, its PB2 protein (accession number ABW 40410) had only one amino acid at position 108 different from that of ABW40267 PB2 protein. However, its predictable and unpredictable portions were 36.82% and 63.18%. In this manner, we converted 2397 letter-symbolized PB2 proteins into 2397 scalar data [26]. As each PB2 protein had its sampling year, we thus had two scalar datasets, the temperature recorded each year and the unpredictable portion of PB2 protein sampled each year. Hence we could plot both datasets along the time course to observe their trends. 3. RESULTS AND DIS CUS SION Figure 1 showed the trends in both global warming and evolution of PB2 proteins, where both trends revealed similar as indicated by their regressed lines. The unpre- dictable portion of PB2 proteins increased over time, which was similar to that the global temperature in creased along the time course. Year 1956 1960 1964 1969 1973 1977 1981 1985 1990 1994 1998 61 63 65 67 69 71 73 Unpredictable portion (%) Temperature per se -15 -5 5 15 25 35 Figure 3. Point-to-point temperature versus PB2 proteins (n=828) from 1956 to 1998. Each point presented a local temperature (°C) at the given year (upper panel), corresponding to the place where a PB2 protein was sampled (lower panel). The dotted lines were regressed lines.  S. M. Yan et al. / J. Biomedical Science and Engineerin g 2 (2009) 458-464 SciRes Copyright © 2009 Openly accessible at http://www.scirp.org/journal/JBISE/ 462 Tem pe rature -20 -10 0 10 20 30 40 Unpredictable portion 60 62 64 66 68 70 72 74 Temperature -10 0 10 20 30 40 A vian (n = 394) Unpredictable portion 60 62 64 66 68 70 Human (n = 289) Temperature -5 0 5 10 15 20 25 30 Y ear 1956 1960 1964 1969 1973 1977 1981 1985 1990 1994 1998 Unpredictable portion 62 64 66 68 70 72 Swine (n = 78) Figure 4. Point-to-point temperature (°C) versus PB2 proteins sampled from different species. The dotted lines were regressed lines.  S. M. Yan et al. / J. Biomedical Science and Engineerin g 2 (2009) 458-464 SciRes Copyright © 2009 http://www.scirp.org/journal/JBISE/ 463 Openly accessible at On the other hand, we cannot ignore these trends be- cause we cannot create another earth without global warming but with active influenza virus for comparison over the same time span. As the validation of global warming is done through the comparison along the time course, we would argue that the validation of PB2 evo- lution should also be done along the time course, i.e. the comparison between any two different time points. Moreover, the global temperature was generally di- vided into north and south hemisphere, so we could group PB2 proteins accordingly to see if the trend still held on in such circumstance. As shown in Figure 2, the similar trend was clearer in north hemisphere than in south one, which could be explained by the fact that most of PB2 proteins were sampled in north hemisphere. This study demonstrated the changes in the unpre- dictable portions of PB2 proteins were different in dif- ferent species. In human and swine, the trends of evolu- tion of PB2 proteins were similar to that of temperature, but not in avian (Figure 4). This difference can be due to the fact that the place where avian was sampled would not be the place where the mutation occurred, because migratory birds are common reservoirs responsible for spreading avian influenza viruses [28,29,30,31]. Climate change would almost certainly alter bird migration, in- fluence the avian influenza virus transmission cycle and directly affect virus survival outside the host [32,33]. On the other hand, the human and swine were generally lo- calized, thus the present results indicate the potential impact of global warming on the evolution of influenza A viruses. Actually the data of PB2 proteins in Figures 1 and 2 were averaged in each year. For example, there were only 2 samples in 1956, but 220 PB2 pro teins were sam- pled in 2007. Another way to analyze the trends is to apply the point-to-point method, that is, we coupled each PB2 protein with the temperature according to its sam- pling place and year. In other word, we took the tem- perature measured at each geographical latitude and lon- gitude of the place where a PB2 protein was sampled at the same year to make the comparison. Figure 3 displayed 828 point-to-point relationships between temperature and unpredictable portion of PB2 proteins from 1956 to 1998, and their regression indi- cated the similar trends. The results in Figure 3 were in consistent with what we found in Figures 1 and 2, that is, there were similar trends between global warming and evolution of PB2 prote ins. Global climate changes affect the functioning of eco- systems, in particular host-pathogen interactions, with major consequences in health ecology [34,35,36]. The results in this study are in good ag reement with our pre- vious studies [3,4], thus these results furthermore sug- gest the general trend in evolution of proteins from in- fluenza A virus. However, much studies are in need be- cause there are still seven other proteins from influenza A virus, which we have yet to study. Because influenza viruses were hosted in different species, we could advance our analysis by the point-to- point relationship between temperature and species, from which the PB2 proteins were sampled. Figure 4 demonstrated the trends of PB2 evolution with respect to the temperature in three major species. The results sug- gested that the trends were similar in human and swine, but different in avian. 4. ACKNOWLEDGEMENTS In this study, we found the similar trends in global warming and the evolution of PB2 proteins from influ- enza A viruses. This is very suggestive, because this founding indicates that the effect of global warming on many different levels on biological evolution, even the proteins hidden inside cell could be subject to the global warming. This is understandable because all of the bio- logical functions are interconnected from macro level to micro level. This study is supported in part by Guangxi Science Foundation No. 0782003-4, 0991080 and Guangxi Academy of Sciences, project 09YJ17SW07. REFERENCES [1] A. A. Hoffmann and Y. Willi, (2008) Detecting genetic responses to environmental change, Nat. Rev. Genet., 9, 421–432. [2] C. D. Thomas, A. Cameron, R. E. Green, M. Bakkenes, L. J. Beaumont, Y. C. Collingham, B. F. Erasmus, M. F. De Siqueira, A. Grainger, L. Hannah, L. Hughes, B. Huntley, A. S. Van Jaarsveld, G. F. Midgley, L. Miles, M. A. Or- tega-Huerta, A. T. Peterson, O. L. Phillips, and S. E. Wil- liams, (2004) Extinction risk from climate change, Na- ture, 427, 145–148. However, can we correlate both trends in this study statistically? At this stage, it would be difficult to deter- mine such correlation because 1) to the best of our knowledge there is no statistical method available to determine the correlation between two lines including a discontinued one in this study; and 2) many statistical books tell that the correlation does not mean the cause- consequence relationship, that is, even we would find the so-called correlation between two trends, we still need to determine if there is any direct or indirect cause-conse- quence relation s hi p . [3] G. Wu and S. Yan, (2009) What these trends suggest? Am. J. Appl. Sci., 6, 1116–1121. [4] G. Wu and S. Yan, (2009) Trends in global warming and evolution of matrix protein 2 family from influenza A virus, Interdiscip. Sci. Comput. Life. Sci., (in pre ss). [5] G. Wu and S. Yan, (2002) Randomness in the primary structure of protein: methods and implications, Mol. Biol. Today, 3, 55–69.  S. M. Yan et al. / J. Biomedical Science and Engineerin g 2 (2009) 458-464 SciRes Copyright © 2009 Openly accessible at http://www.scirp.org/journal/JBISE/ 464 [6] G. Wu and S. Yan, (2006) Fate of influenza A virus pro- teins, Protein Pept. Lett., 13, 399–406. [7] G. Wu and S. Yan, (2006) Mutation trend of hemaggluti- nin of influenza a virus: A review from computational mutation viewpoint, Acta Pharmacol, Sin., 27, 513–526. [8] G. Wu and S. Yan, (2008) Lecture notes on computational mutation, Nova Science Publishers, New York. [9] O. G. Engelhardt and E. Fodor, (2006) Functional asso- ciation between viral and cellular transcription during in- fluenza virus infection, Rev. Med. Virol., 16, 329–345. [10] J. N. Heme rka, D. Wa ng, Y. Weng, W. Lu, R. S. Kaushik, J. Jin, A. F. Harmon, and F. Li, (2009) Detection and characterization of influenza A virus PA-PB2 interaction through a bimolecular fluorescence complementation as- say, J. Virol., 83, 3944–3955. [11] N. Van Hoeven, C. Pappas, J. A. Belser, T. R. Maines, H. Zeng, A. García-Sastre, R. Sasisekharan, J. M. Katz, and T. M. Tumpey, (2009) Human HA and polymerase sub- unit PB2 proteins confer transmission of an avian influ- enza virus through the air, Proc. Natl. Acad. Sci., U. S. A., 106, 3366–3371. [12] T. Watanabe, S. Watanabe, K. Shinya, J. H. Kim, M. Hatta & Y. Kawaoka, (2009) Viral RNA polymerase com - plex promotes optimal growth of 1918 virus in the lower respiratory tract of ferrets, Proc. Natl. Acad. Sci. U. S. A., 106, 588–592. [13] M. Hatta and Y. Kawaoka, (2002) The continued pan- demic threat posed by avian influenza viruses in Hong Kong. T rends Microbiol., 10, 340–344. [14] T. Kuzuhara, D. Kise, H. Yoshida, T. Horita, Y. Murazaki, A. Nishimura, N. Echigo, H. Utsunomiya, and H. Tsuge, (2009) Structural basis of the influenza A virus RNA po- lymerase PB2 RNA-binding domain containing the pathogenicity-determinant lysine 627 residue, J. Biol. Chem., 284, 6855–6860. [15] J. Steel, A. C. Lowen, L. Pena, M. Angel, A. Solórzano, R. Albrecht, D. R. Perez, A. García-Sastre, and P. Palese, (2009) Live attenuated influenza viruses containing NS1 truncations as vaccine candidates against H5N1 highly pathogenic avian influenza. J. Virol., 83, 1742–1753. [16] Q. M. Le, Y. Sakai-Tagawa, M. Ozawa, M. Ito, and Y. Kawaoka, (2009) Selection of H5N1 influenza virus PB2 during replication in humans, J. Virol., 83, 5278–5281. [17] N. A. Rayner, P. Brohan, D. E. Parker, C. K. Folland, J. J. Kennedy, M. Vanicek, T. Ansell, and S. F. B. Tett, (2006) Improved analyses of changes and uncertainties in ma- rine temperature measured in situ since the mid nine- teenth century: The HadSST2 dataset, J. Clim., 19, 446– 469. [18] Climatic Research Unit, (2009) http://www.cru.uea.ac.uk/cru/data/temperature/. [19] M. New, M. Hulme, and P. Jones, (2000) Representing twentieth-century space-time climate variability, Part II: Development of 1901-96 monthly grids of terrestrial surface climate, J. Clim., 13, 2217–2238. [20] Influenza virus resources, (2009) http://www.ncbi.nlm.nih.gov/genomes/FLU/Database/mu ltiple.cgi. [21] G. Wu and S. Yan, (2008) Prediction of mutations engi- neered by randomness in H5N1 neuraminidases from in- fluenza a virus . Amino Acids, 34, 81–90. [22] G. Wu and S. Yan, (2008) Prediction of mutations initi- ated by internal power in H3N2 hemagglutinins of influ- enza a virus from North America, Int. J. Pept. Res. Ther., 14, 41–51. [23] G. Wu and S. Yan, (2008) Prediction of mutation in H3N2 hemagglutinins of influenza A virus from North America based on different datasets, Protein Pept. Lett., 15, 144–152. [24] G. Wu and S. Yan, (2008) Prediction of mutations engi- neered by randomness in H5N1 hemagglutinins of influ- enza a virus, Amino Acid, 35, 365–373. [25] G. Wu and S. Yan, (2008) Three sampling strategies to predict mutations in H5N1 hemagglutinins from influ- enza A virus. Protein Pept. Lett., 15, 731–738. [26] Amino-acid pair predictability, (2009) http://www.dreamscitech.com/Service/rationale.htm. [27] Get Lat Lon, (2009) http://www.getlatlon.com/. [28] S. Krauss, D. Walker, S. P. Pryor, L. Niles, L. Chenghong, V. S. Hinshaw, and R. G. Webster, (2004) Influenza A vi- ruses of migrating wild aquatic birds in North America, Vector Borne Zoonotic. Dis., 4, 177–189. [29] L. Z. Garamszegi and A. P. Møller, (2007) Prevalence of avian influenza and host ecology, Proc. Biol. Sci., 274, 2003–2012. [30] T. P. Weber & N. I. Stilianakis, (2007) Ecologic immu- nology of avian influenza (H5N1) in migratory birds, Emerg. Infect. Dis., 13, 1139–1143. [31] A. Jahangir, Y. Watanabe, O. Chinen, S. Yamazaki, K. Sakai, M. Okamura, M. Nakamura & K. Takehara, (2008) Surveillance of avian influenza viruses in Northern pin- tails (Anas acuta) in Tohoku District, Japan. Avian Dis., 52, 49–53. [32] M. Gilbert, J. Slingenbergh & X. Xiao, (2008) Climate change and avian influenza, Rev. Sci. Tech., 27, 459– 466. [33] Louchart, (2008) Emergence of long distance bird migra- tions: A new model integrating global climate changes, Naturwissenschaften, 95, 1109–1119. [34] S. de La Rocque, J. A. Rioux & J. Slingenbergh, (2008) Climate change: effects on animal disease systems and implications for surveillance and control, Rev. Sci. Tech., 27, 339–354. [35] S. Morand & J. F. Guégan, (2008) How the biodiversity sciences may aid biological tools and ecological engi- neering to assess the impact of climatic changes, Rev. Sci. Tech., 27, 355–366. [36] E. A. Gould & S. Higgs, (2009) Impact of climate change and other factors on emerging arbovirus diseases, Trans. R. Soc. Trop. Med. Hyg., 103, 109–121. |