

Paper Menu >>
Journal Menu >>
 Pharmacology & Pharmacy, 2011, 2, 341-346 doi:10.4236/pp.2011.24044 Published Online October 2011 (http://www.SciRP.org/journal/pp) Copyright © 2011 SciRes. PP 341 Validated LC-MS/MS Method for the Determination of Rosuvastatin in Human Plasma: Application to a Bioequivalence Study in Chinese Volunteers Dujuan Zhang1,2, Jing Zhang2, Xiaoyan Liu2, Chunmin Wei2, Rui Zhang2, Haojing Song2, Han Yao2, Guiyan Yuan2, Benjie Wang2, Ruichen Guo2* 1School of Pharmacy, Shandong University, Jinan, China, 2Institute of Clinical Pharmacology, Qilu Hospital of Shandong University, Jinan, China. Email: *[email protected] Received July 28th, 2011; revised August 26th, 2011; accepted September 20th, 2011. ABSTRACT A sensitive and selective liquid chromatography-electrospray ionization-tandem mass spectrometry (LC-MS/MS) method was developed and validated for the determination of rosuvastatin in human plasma using gliclazide as an internal standard (IS). Rosuvastatin and gliclazide in plasma were extracted with ethyl acetate, separated on a C18 reversed phase column, eluted with mobile phase of acetonitrile-methanoic acid (0.1%) (60:40, v/v), ionized by positive ion pneumatically assisted electrospray and detected in the multi-reaction monitoring mode using precursor → product ions of m/z 482.1 → 258.1 for rosuvastatin and m/z 324.2 → 127.2 for IS , respectively. The calibration curve was lin- ear (r2 > 0.99, n = 5) over the concentration range of 0.1 - 60 ng/mL. The specificity, matrix effect, recovery, sensitivity, linearity, accuracy, precision, and stabilities were validated for ro suvastatin in human plasma. In conclusion , the vali- dation results showed that this method was sensitive, economical and less toxic and it can successfully fulfill the re- quirement of bioequivalence study of rosuvastatin calcium tablets in Chinese healthy volunteers. Keywords: Rosuvastatin, Bioequivalence, LC-MS/MS, Pharmacokinetics 1. Introduction Rosuvastatin (Figure 1) is a hydroxyl-methyl-glutaryl coenzyme A (HMG-CoA) reductase inhibitor used in the treatment of patients with dyslipidemia [1]. Rosuvastatin has been reported to reduce serum levels of low-density lipoprotein cholesterol [2], accompanied by increases in high-density lipoprotein cholesterol [3] and reductions in triglycerides [4]. The population pharmacokinetic study revealed that plasma exposure to rosuvastatin was sig- nificantly higher in Asian subjects than in White subjects living in the same environment [5]. In recent years, several methods have been reported for the quantification of rosuvastatin in plasma. Kumar TR et al published a HPLC-UV method for the determi- nation of rosuvastatin in rat plasma [6]. Some LC-MS/ MS methods were developed [7-9], but they adopted ei- ther ethyl ether as extraction solvent [7,8], which was toxic and difficult to quantitate, or SPE [9], which was relatively expensive, especially for the bioequivalence study where a large number of samples were to be col- lected and treated. Simultaneous quantitations of rosu- vastatin and fenofibric acid [10] or other coadministrated drugs [11,12] in biological samples were also proposed by some literatures, using HPLC with ultraviolet detec- tion [11,12] or LC-MS/MS [10], but the lowest detection limit of these methods was 0.6 ng/mL, not sensitive enough to meet the requirement for rosuvastation deter- mination in plasma. It was therefore necessary to develop a more optimized LC-MS/MS method for the quantita- tion of rosuvastatin in plasma. In this paper, a sensitive and selective LC-MS/MS method has been developed and used to evaluate the bio- equivalence of two rosuvastatin calcium tablets in healthy Chinese volunteers. 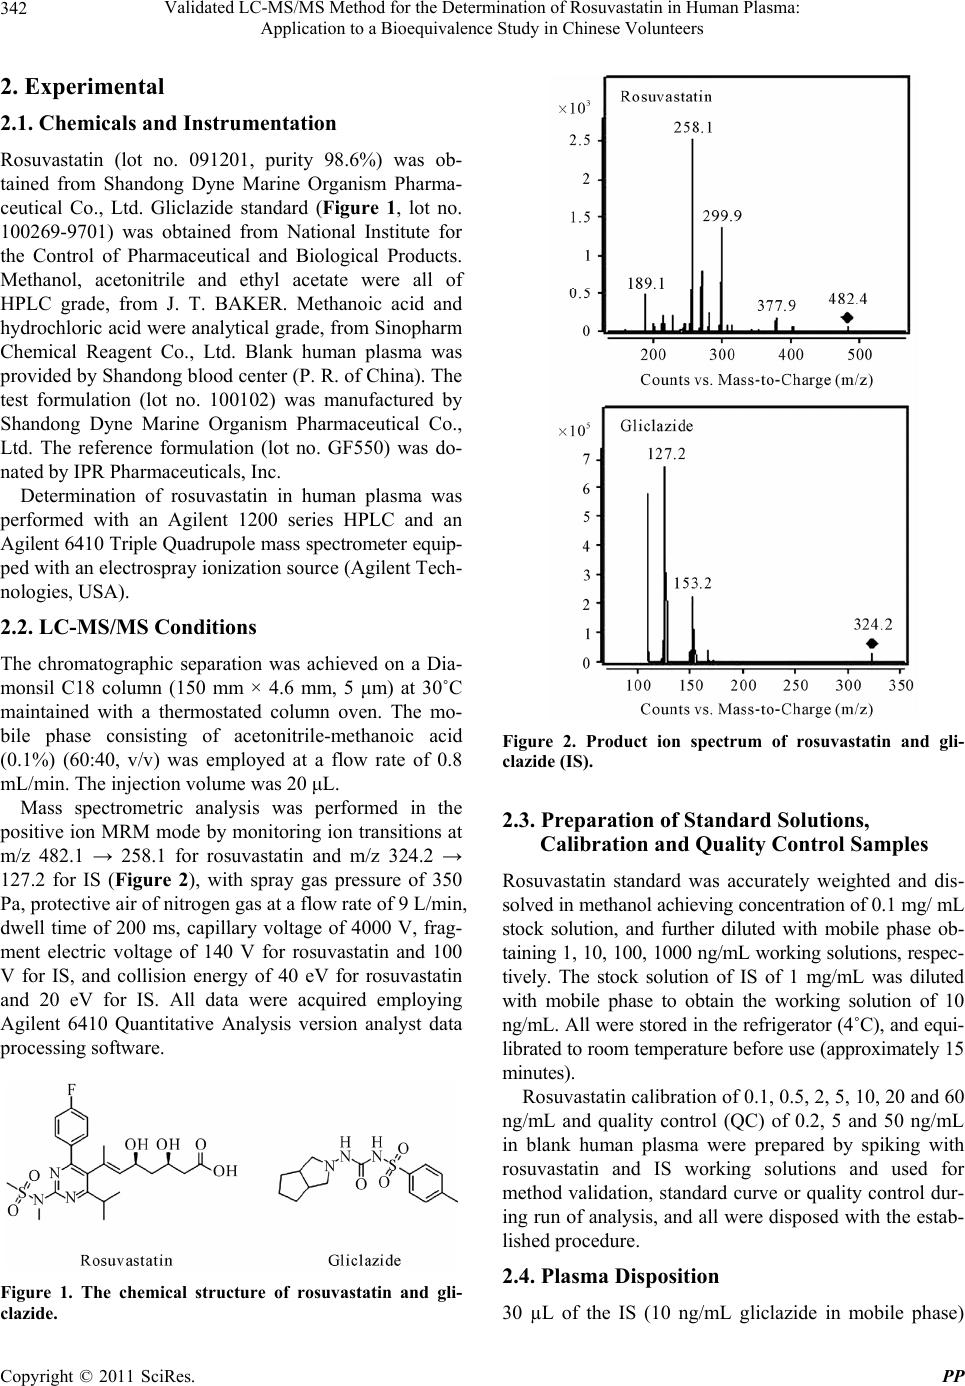 Validated LC-MS/MS Method for the Determination of Rosuvastatin in Human Plasma: 342 Application to a Bioequivalence Study in Chinese Volunteers 2. Experimental 2.1. Chemicals and Instrumentation Rosuvastatin (lot no. 091201, purity 98.6%) was ob- tained from Shandong Dyne Marine Organism Pharma- ceutical Co., Ltd. Gliclazide standard (Figure 1, lot no. 100269-9701) was obtained from National Institute for the Control of Pharmaceutical and Biological Products. Methanol, acetonitrile and ethyl acetate were all of HPLC grade, from J. T. BAKER. Methanoic acid and hydrochloric acid were analytical grade, from Sinopharm Chemical Reagent Co., Ltd. Blank human plasma was provided by Shandong blood center (P. R. of China). The test formulation (lot no. 100102) was manufactured by Shandong Dyne Marine Organism Pharmaceutical Co., Ltd. The reference formulation (lot no. GF550) was do- nated by IPR Pharmaceuticals, Inc. Determination of rosuvastatin in human plasma was performed with an Agilent 1200 series HPLC and an Agilent 6410 Triple Quadrupole mass spectrometer equip- ped with an electrospray ionization source (Agilent Tech- nologies, USA). 2.2. LC-MS/MS Conditions The chromatographic separation was achieved on a Dia- monsil C18 column (150 mm × 4.6 mm, 5 μm) at 30˚C maintained with a thermostated column oven. The mo- bile phase consisting of acetonitrile-methanoic acid (0.1%) (60:40, v/v) was employed at a flow rate of 0.8 mL/min. The injection volume was 20 μL. Mass spectrometric analysis was performed in the positive ion MRM mode by monitoring ion transitions at m/z 482.1 → 258.1 for rosuvastatin and m/z 324.2 → 127.2 for IS (Figure 2), with spray gas pressure of 350 Pa, protective air of nitrogen gas at a flow rate of 9 L/min, dwell time of 200 ms, capillary voltage of 4000 V, frag- ment electric voltage of 140 V for rosuvastatin and 100 V for IS, and collision energy of 40 eV for rosuvastatin and 20 eV for IS. All data were acquired employing Agilent 6410 Quantitative Analysis version analyst data processing software. Figure 1. The chemical structure of rosuvastatin and gli- clazide. Figure 2. Product ion spectrum of rosuvastatin and gli- clazide (IS). 2.3. Preparation of Standard Solutions, Calibration and Quality Control Samples Rosuvastatin standard was accurately weighted and dis- solved in methanol achieving concentration of 0.1 mg/ mL stock solution, and further diluted with mobile phase ob- taining 1, 10, 100, 1000 ng/mL working solutions, respec- tively. The stock solution of IS of 1 mg/mL was diluted with mobile phase to obtain the working solution of 10 ng/mL. All were stored in the refrigerator (4˚C), and equi- librated to room temperature before use (approximately 15 minutes). Rosuvastatin calibration of 0.1, 0.5, 2, 5, 10, 20 and 60 ng/mL and quality control (QC) of 0.2, 5 and 50 ng/mL in blank human plasma were prepared by spiking with rosuvastatin and IS working solutions and used for method validation, standard curve or quality control dur- ing run of analysis, and all were disposed with the estab- lished procedure. 2.4. Plasma Disposition 30 µL of the IS (10 ng/mL gliclazide in mobile phase) Copyright © 2011 SciRes. PP 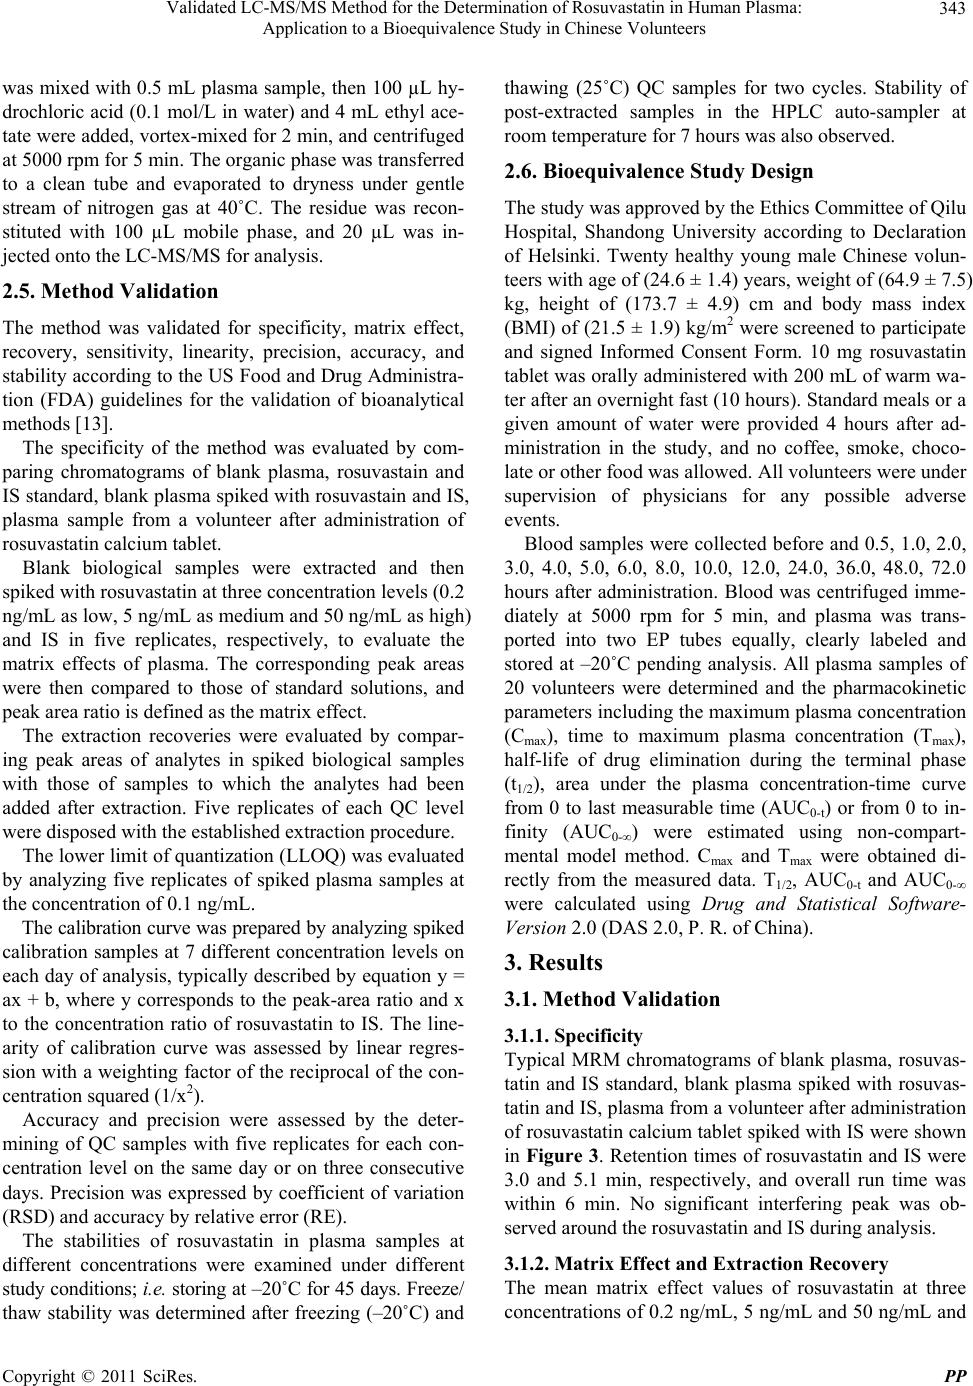 Validated LC-MS/MS Method for the Determination of Rosuvastatin in Human Plasma: Application to a Bioequivalence Study in Chinese Volunteers Copyright © 2011 SciRes. PP 343 was mixed with 0.5 mL plasma sample, then 100 µL hy- drochloric acid (0.1 mol/L in water) and 4 mL ethyl ace- tate were added, vortex-mixed for 2 min, and centrifuged at 5000 rpm for 5 min. The organic phase was transferred to a clean tube and evaporated to dryness under gentle stream of nitrogen gas at 40˚C. The residue was recon- stituted with 100 µL mobile phase, and 20 µL was in- jected onto the LC-MS/MS for analysis. 2.5. Method Validation The method was validated for specificity, matrix effect, recovery, sensitivity, linearity, precision, accuracy, and stability according to the US Food and Drug Administra- tion (FDA) guidelines for the validation of bioanalytical methods [13]. The specificity of the method was evaluated by com- paring chromatograms of blank plasma, rosuvastain and IS standard, blank plasma spiked with rosuvastain and IS, plasma sample from a volunteer after administration of rosuvastatin calcium tablet. Blank biological samples were extracted and then spiked with rosuvastatin at three concentration levels (0.2 ng/mL as low, 5 ng/mL as medium and 50 ng/mL as high) and IS in five replicates, respectively, to evaluate the matrix effects of plasma. The corresponding peak areas were then compared to those of standard solutions, and peak area ratio is defined as the matrix effect. The extraction recoveries were evaluated by compar- ing peak areas of analytes in spiked biological samples with those of samples to which the analytes had been added after extraction. Five replicates of each QC level were disposed with the established extraction procedure. The lower limit of quantization (LLOQ) was evaluated by analyzing five replicates of spiked plasma samples at the concentration of 0.1 ng/mL. The calibration curve was prepared by analyzing spiked calibration samples at 7 different concentration levels on each day of analysis, typically described by equation y = ax + b, where y corresponds to the peak-area ratio and x to the concentration ratio of rosuvastatin to IS. The line- arity of calibration curve was assessed by linear regres- sion with a weighting factor of the reciprocal of the con- centration squared (1/x2). Accuracy and precision were assessed by the deter- mining of QC samples with five replicates for each con- centration level on the same day or on three consecutive days. Precision was expressed by coefficient of variation (RSD) and accuracy by relative error (RE). The stabilities of rosuvastatin in plasma samples at different concentrations were examined under different study conditions; i.e. storing at –20˚C for 45 days. Freeze/ thaw stability was determined after freezing (–20˚C) and thawing (25˚C) QC samples for two cycles. Stability of post-extracted samples in the HPLC auto-sampler at room temperature for 7 hours was also observed. 2.6. Bioequivalence Study Design The study was approved by the Ethics Committee of Qilu Hospital, Shandong University according to Declaration of Helsinki. Twenty healthy young male Chinese volun- teers with age of (24.6 ± 1.4) years, weight of (64.9 ± 7.5) kg, height of (173.7 ± 4.9) cm and body mass index (BMI) of (21.5 ± 1.9) kg/m2 were screened to participate and signed Informed Consent Form. 10 mg rosuvastatin tablet was orally administered with 200 mL of warm wa- ter after an overnight fast (10 hours). Standard meals or a given amount of water were provided 4 hours after ad- ministration in the study, and no coffee, smoke, choco- late or other food was allowed. All volunteers were under supervision of physicians for any possible adverse events. Blood samples were collected before and 0.5, 1.0, 2.0, 3.0, 4.0, 5.0, 6.0, 8.0, 10.0, 12.0, 24.0, 36.0, 48.0, 72.0 hours after administration. Blood was centrifuged imme- diately at 5000 rpm for 5 min, and plasma was trans- ported into two EP tubes equally, clearly labeled and stored at –20˚C pending analysis. All plasma samples of 20 volunteers were determined and the pharmacokinetic parameters including the maximum plasma concentration (Cmax), time to maximum plasma concentration (Tmax), half-life of drug elimination during the terminal phase (t1/2), area under the plasma concentration-time curve from 0 to last measurable time (AUC0-t) or from 0 to in- finity (AUC0-∞) were estimated using non-compart- mental model method. Cmax and Tmax were obtained di- rectly from the measured data. T1/2, AUC0-t and AUC0-∞ were calculated using Drug and Statistical Software- Version 2.0 (DAS 2.0, P. R. of China). 3. Results 3.1. Method Validation 3.1.1. Specificity Typical MRM chromatograms of blank plasma, rosuvas- tatin and IS standard, blank plasma spiked with rosuvas- tatin and IS, plasma from a volunteer after administration of rosuvastatin calcium tablet spiked with IS were shown in Figure 3. Retention times of rosuvastatin and IS were 3.0 and 5.1 min, respectively, and overall run time was within 6 min. No significant interfering peak was ob- served around the rosuvastatin and IS during analysis. 3.1.2. Matrix Effect and Extraction Recovery The mean matrix effect values of rosuvastatin at three concentrations of 0.2 ng/mL, 5 ng/mL and 50 ng/mL and  Validated LC-MS/MS Method for the Determination of Rosuvastatin in Human Plasma: 344 Application to a Bioequivalence Study in Chinese Volunteers (a) (b) (c) (d) Figure 3. Typical chromatograms of rosuvastatin and IS in human plasma: blank plasma sample (a); rosuvastatin and IS standard (b); a blank plasma sample spiked with rosuvastatin (3 ng/mL) and IS (c); a plasma sample of a volunteer at 0.5 hours after administration of 10 mg rosuvastatin calcium tablet (d). IS at 3 ng/mL were (96.41 ± 6.14)%, (99.75 ± 1.43)%, (98.35 ± 3.01)%, and (88.93 ± 3.39)%, respectively. It demonstrated no matrix significantly affected the deter- mination of rosuvastatin in human plasma. Mean extraction recoveries of rosuvastatin at three QC levels and IS were (85.73 ± 6.62)%, (83.99 ± 1.52)%, (79.67 ± 4.13)%, and (75.98 ± 1.34)%, respectively. The results were shown to be consistent, precise and repro- ducible. 3.1.3. Calibration Curve and LLOQ The calibration curves showed a good linearity in the concentration range of 0.1 - 60 ng/mL with correlation coefficient (r2 > 0.99) and the LLOQ for rosuvastatin was proved to be 0.1 ng/mL with RSD and RE were 4.5% and –5.6%, respectively. 3.1.4. Accuracy and Precision The results of intraday and interday precision and accu- racy were shown in Table 1. Both precision values (RSD) were less than 7.7%. Intraday and interday accuracy (RE) ranged from –10.1% to –4.3% and –9.5% to –2.8%, re- spectively. 3.1.5. Stability The results of stability of rosuvastatin were shown in Table 2. The data demonstrated that rosuvastain was stable under the indicated conditions for the bioequiva- lence study. The stock solutions of rosuvastatin and IS were comparable to the freshly prepared ones after stor- age at −20˚C for days and two freeze-thaw cycles. 3.2. Application to Bioequivalence Study The validated method was applied to the bioequivalence study of rosuvastatin in human plasma after a single oral administration of 10 mg rosuvastatin calcium tablet to 20 healthy male volunteers. The mean plasma concentra- tion-time profile and main pharmacokinetic parameters Copyright © 2011 SciRes. PP 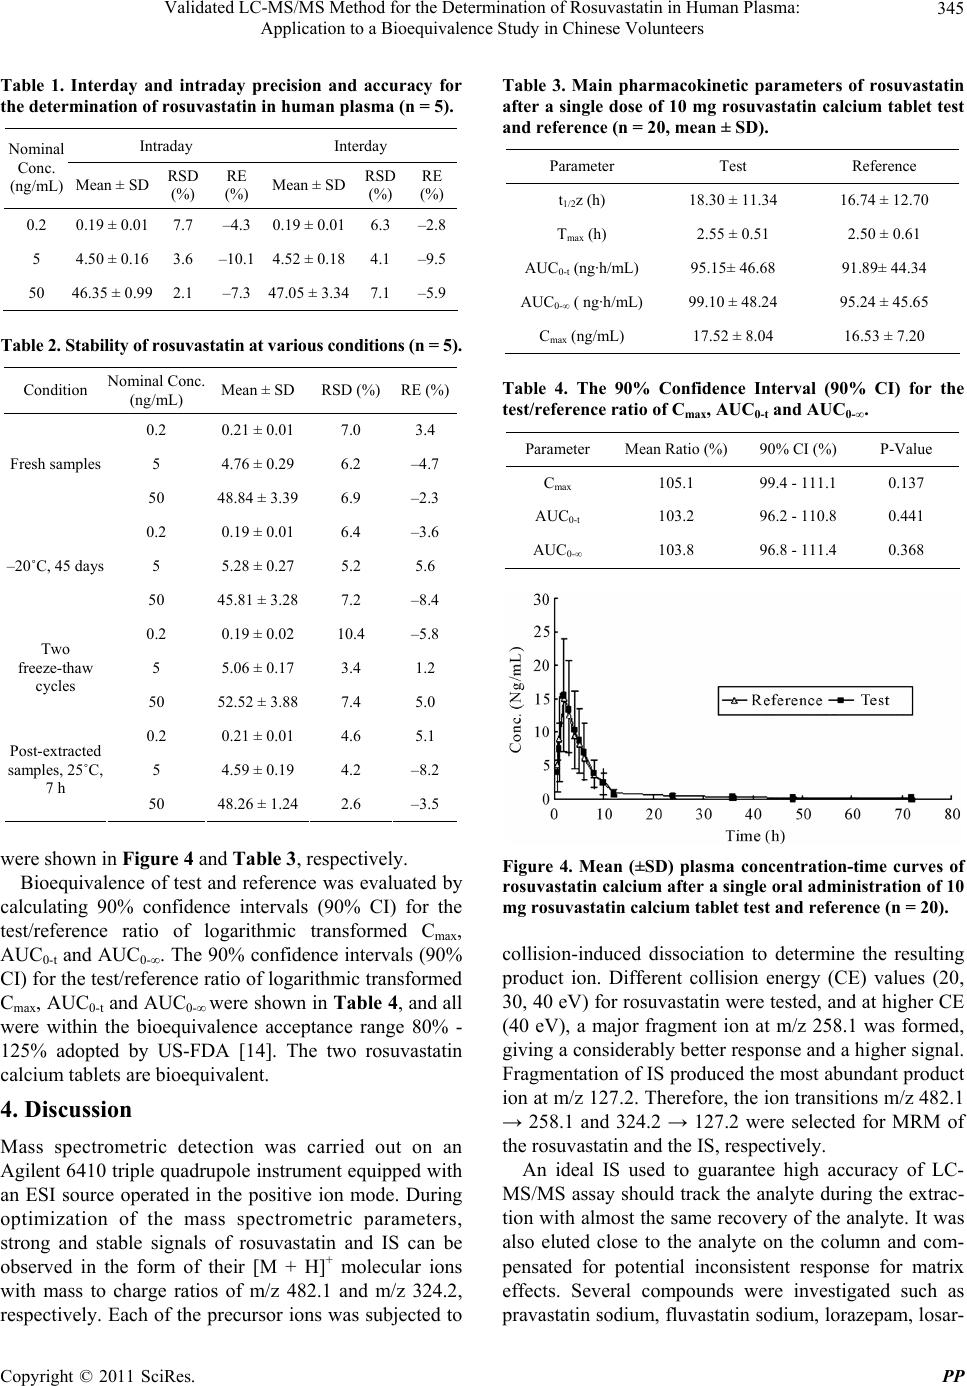 Validated LC-MS/MS Method for the Determination of Rosuvastatin in Human Plasma: 345 Application to a Bioequivalence Study in Chinese Volunteers Table 1. Interday and intraday precision and accuracy for the determination of rosuvastatin in human plasma (n = 5). Intraday Interday Nominal Conc. (ng/mL) Mean ± SD RSD (%) RE (%) Mean ± SD RSD (%) RE (%) 0.2 0.19 ± 0.01 7.7 –4.30.19 ± 0.01 6.3 –2.8 5 4.50 ± 0.16 3.6 –10.14.52 ± 0.18 4.1 –9.5 50 46.35 ± 0.99 2.1 –7.347.05 ± 3.34 7.1 –5.9 Table 2. Stability of rosuvastatin at various conditions (n = 5). Condition Nominal Conc. (ng/mL) Mean ± SD RSD (%)RE (%) 0.2 0.21 ± 0.01 7.0 3.4 5 4.76 ± 0.29 6.2 –4.7 Fresh samples 50 48.84 ± 3.39 6.9 –2.3 0.2 0.19 ± 0.01 6.4 –3.6 5 5.28 ± 0.27 5.2 5.6 –20˚C, 45 days 50 45.81 ± 3.28 7.2 –8.4 0.2 0.19 ± 0.02 10.4 –5.8 5 5.06 ± 0.17 3.4 1.2 Two freeze-thaw cycles 50 52.52 ± 3.88 7.4 5.0 0.2 0.21 ± 0.01 4.6 5.1 5 4.59 ± 0.19 4.2 –8.2 Post-extracted samples, 25˚C, 7 h 50 48.26 ± 1.24 2.6 –3.5 were shown in Figure 4 and Table 3, respectively. Bioequivalence of test and reference was evaluated by calculating 90% confidence intervals (90% CI) for the test/reference ratio of logarithmic transformed Cmax, AUC0-t and AUC0-∞. The 90% confidence intervals (90% CI) for the test/reference ratio of logarithmic transformed Cmax, AUC0-t and AUC0-∞ were shown in Table 4, and all were within the bioequivalence acceptance range 80% - 125% adopted by US-FDA [14]. The two rosuvastatin calcium tablets are bioequivalent. 4. Discussion Mass spectrometric detection was carried out on an Agilent 6410 triple quadrupole instrument equipped with an ESI source operated in the positive ion mode. During optimization of the mass spectrometric parameters, strong and stable signals of rosuvastatin and IS can be observed in the form of their [M + H]+ molecular ions with mass to charge ratios of m/z 482.1 and m/z 324.2, respectively. Each of the precursor ions was subjected to Table 3. Main pharmacokinetic parameters of rosuvastatin after a single dose of 10 mg rosuvastatin calcium tablet test and reference (n = 20, mean ± SD). Parameter Test Reference t1/2z (h) 18.30 ± 11.34 16.74 ± 12.70 Tmax (h) 2.55 ± 0.51 2.50 ± 0.61 AUC0-t (ng·h/mL) 95.15± 46.68 91.89± 44.34 AUC0-∞ ( ng·h/mL)99.10 ± 48.24 95.24 ± 45.65 Cmax (ng/mL) 17.52 ± 8.04 16.53 ± 7.20 Table 4. The 90% Confidence Interval (90% CI) for the test/reference ratio of Cmax, AUC0-t and AUC0-∞. Parameter Mean Ratio (%) 90% CI (%) P-Value Cmax 105.1 99.4 - 111.1 0.137 AUC0-t 103.2 96.2 - 110.8 0.441 AUC0-∞ 103.8 96.8 - 111.4 0.368 Figure 4. Mean (±SD) plasma concentration-time curves of rosuvastatin calcium after a single oral administration of 10 mg rosuvastatin calcium tablet test and reference (n = 20). collision-induced dissociation to determine the resulting product ion. Different collision energy (CE) values (20, 30, 40 eV) for rosuvastatin were tested, and at higher CE (40 eV), a major fragment ion at m/z 258.1 was formed, giving a considerably better response and a higher signal. Fragmentation of IS produced the most abundant product ion at m/z 127.2. Therefore, the ion transitions m/z 482.1 → 258.1 and 324.2 → 127.2 were selected for MRM of the rosuvastatin and the IS, respectively. An ideal IS used to guarantee high accuracy of LC- MS/MS assay should track the analyte during the extrac- tion with almost the same recovery of the analyte. It was also eluted close to the analyte on the column and com- pensated for potential inconsistent response for matrix effects. Several compounds were investigated such as pravastatin sodium, fluvastatin sodium, lorazepam, losar- Copyright © 2011 SciRes. PP 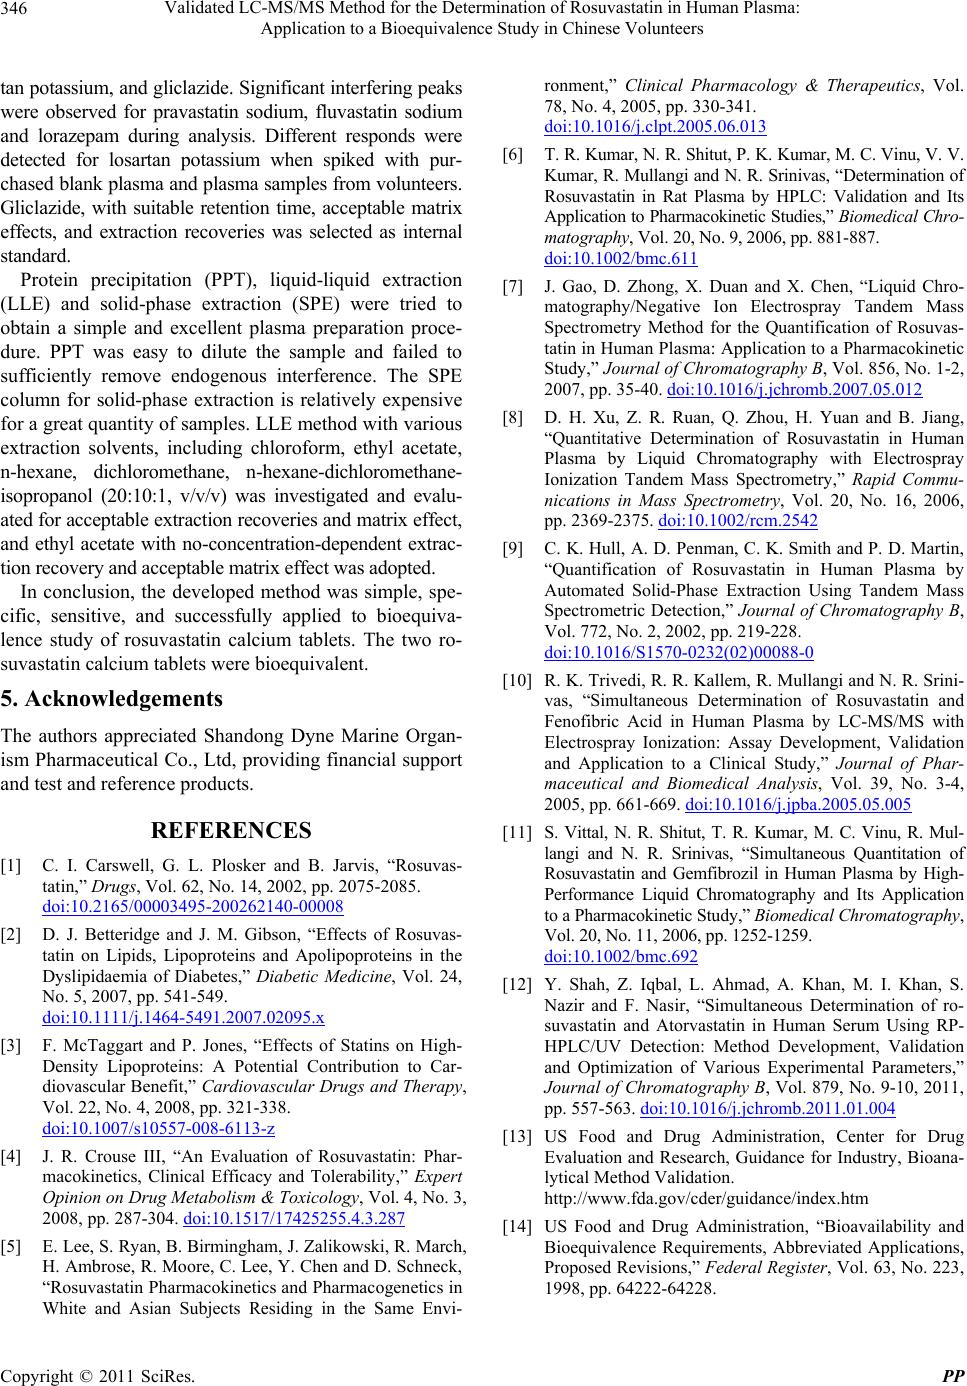 Validated LC-MS/MS Method for the Determination of Rosuvastatin in Human Plasma: Application to a Bioequivalence Study in Chinese Volunteers Copyright © 2011 SciRes. PP 346 tan potassium, and gliclazide. Significant interfering peaks were observed for pravastatin sodium, fluvastatin sodium and lorazepam during analysis. Different responds were detected for losartan potassium when spiked with pur- chased blank plasma and plasma samples from volunteers. Gliclazide, with suitable retention time, acceptable matrix effects, and extraction recoveries was selected as internal standard. Protein precipitation (PPT), liquid-liquid extraction (LLE) and solid-phase extraction (SPE) were tried to obtain a simple and excellent plasma preparation proce- dure. PPT was easy to dilute the sample and failed to sufficiently remove endogenous interference. The SPE column for solid-phase extraction is relatively expensive for a great quantity of samples. LLE method with various extraction solvents, including chloroform, ethyl acetate, n-hexane, dichloromethane, n-hexane-dichloromethane- isopropanol (20:10:1, v/v/v) was investigated and evalu- ated for acceptable extraction recoveries and matrix effect, and ethyl acetate with no-concentration-dependent extrac- tion recovery and acceptable matrix effect was adopted. In conclusion, the developed method was simple, spe- cific, sensitive, and successfully applied to bioequiva- lence study of rosuvastatin calcium tablets. The two ro- suvastatin calcium tablets were bioequivalent. 5. Acknowledgements The authors appreciated Shandong Dyne Marine Organ- ism Pharmaceutical Co., Ltd, providing financial support and test and reference products. REFERENCES [1] C. I. Carswell, G. L. Plosker and B. Jarvis, “Rosuvas- tatin,” Drugs, Vol. 62, No. 14, 2002, pp. 2075-2085. doi:10.2165/00003495-200262140-00008 [2] D. J. Betteridge and J. M. Gibson, “Effects of Rosuvas- tatin on Lipids, Lipoproteins and Apolipoproteins in the Dyslipidaemia of Diabetes,” Diabetic Medicine, Vol. 24, No. 5, 2007, pp. 541-549. doi:10.1111/j.1464-5491.2007.02095.x [3] F. McTaggart and P. Jones, “Effects of Statins on High- Density Lipoproteins: A Potential Contribution to Car- diovascular Benefit,” Cardiovascular Drugs and Therapy, Vol. 22, No. 4, 2008, pp. 321-338. doi:10.1007/s10557-008-6113-z [4] J. R. Crouse III, “An Evaluation of Rosuvastatin: Phar- macokinetics, Clinical Efficacy and Tolerability,” Expert Opinion on Drug Metabolism & Toxicology, Vol. 4, No. 3, 2008, pp. 287-304. doi:10.1517/17425255.4.3.287 [5] E. Lee, S. Ryan, B. Birmingham, J. Zalikowski, R. March, H. Ambrose, R. Moore, C. Lee, Y. Chen and D. Schneck, “Rosuvastatin Pharmacokinetics and Pharmacogenetics in White and Asian Subjects Residing in the Same Envi- ronment,” Clinical Pharmacology & Therapeutics, Vol. 78, No. 4, 2005, pp. 330-341. doi:10.1016/j.clpt.2005.06.013 [6] T. R. Kumar, N. R. Shitut, P. K. Kumar, M. C. Vinu, V. V. Kumar, R. Mullangi and N. R. Srinivas, “Determination of Rosuvastatin in Rat Plasma by HPLC: Validation and Its Application to Pharmacokinetic Studies,” Biomedi cal Chro- matography, Vol. 20, No. 9, 2006, pp. 881-887. doi:10.1002/bmc.611 [7] J. Gao, D. Zhong, X. Duan and X. Chen, “Liquid Chro- matography/Negative Ion Electrospray Tandem Mass Spectrometry Method for the Quantification of Rosuvas- tatin in Human Plasma: Application to a Pharmacokinetic Study,” Journal of Chromatography B, Vol. 856, No. 1-2, 2007, pp. 35-40. doi:10.1016/j.jchromb.2007.05.012 [8] D. H. Xu, Z. R. Ruan, Q. Zhou, H. Yuan and B. Jiang, “Quantitative Determination of Rosuvastatin in Human Plasma by Liquid Chromatography with Electrospray Ionization Tandem Mass Spectrometry,” Rapid Commu- nications in Mass Spectrometry, Vol. 20, No. 16, 2006, pp. 2369-2375. doi:10.1002/rcm.2542 [9] C. K. Hull, A. D. Penman, C. K. Smith and P. D. Martin, “Quantification of Rosuvastatin in Human Plasma by Automated Solid-Phase Extraction Using Tandem Mass Spectrometric Detection,” Journal of Chromatography B, Vol. 772, No. 2, 2002, pp. 219-228. doi:10.1016/S1570-0232(02)00088-0 [10] R. K. Trivedi, R. R. Kallem, R. Mullangi and N. R. Srini- vas, “Simultaneous Determination of Rosuvastatin and Fenofibric Acid in Human Plasma by LC-MS/MS with Electrospray Ionization: Assay Development, Validation and Application to a Clinical Study,” Journal of Phar- maceutical and Biomedical Analysis, Vol. 39, No. 3-4, 2005, pp. 661-669. doi:10.1016/j.jpba.2005.05.005 [11] S. Vittal, N. R. Shitut, T. R. Kumar, M. C. Vinu, R. Mul- langi and N. R. Srinivas, “Simultaneous Quantitation of Rosuvastatin and Gemfibrozil in Human Plasma by High- Performance Liquid Chromatography and Its Application to a Pharmacokinetic Study,” Biomedical Chromatography, Vol. 20, No. 11, 2006, pp. 1252-1259. doi:10.1002/bmc.692 [12] Y. Shah, Z. Iqbal, L. Ahmad, A. Khan, M. I. Khan, S. Nazir and F. Nasir, “Simultaneous Determination of ro- suvastatin and Atorvastatin in Human Serum Using RP- HPLC/UV Detection: Method Development, Validation and Optimization of Various Experimental Parameters,” Journal of Chromatography B, Vol. 879, No. 9-10, 2011, pp. 557-563. doi:10.1016/j.jchromb.2011.01.004 [13] US Food and Drug Administration, Center for Drug Evaluation and Research, Guidance for Industry, Bioana- lytical Method Validation. http://www.fda.gov/cder/guidance/index.htm [14] US Food and Drug Administration, “Bioavailability and Bioequivalence Requirements, Abbreviated Applications, Proposed Revisions,” Federal Registe r, Vol. 63, No. 223, 1998, pp. 64222-64228. |