

Paper Menu >>
Journal Menu >>
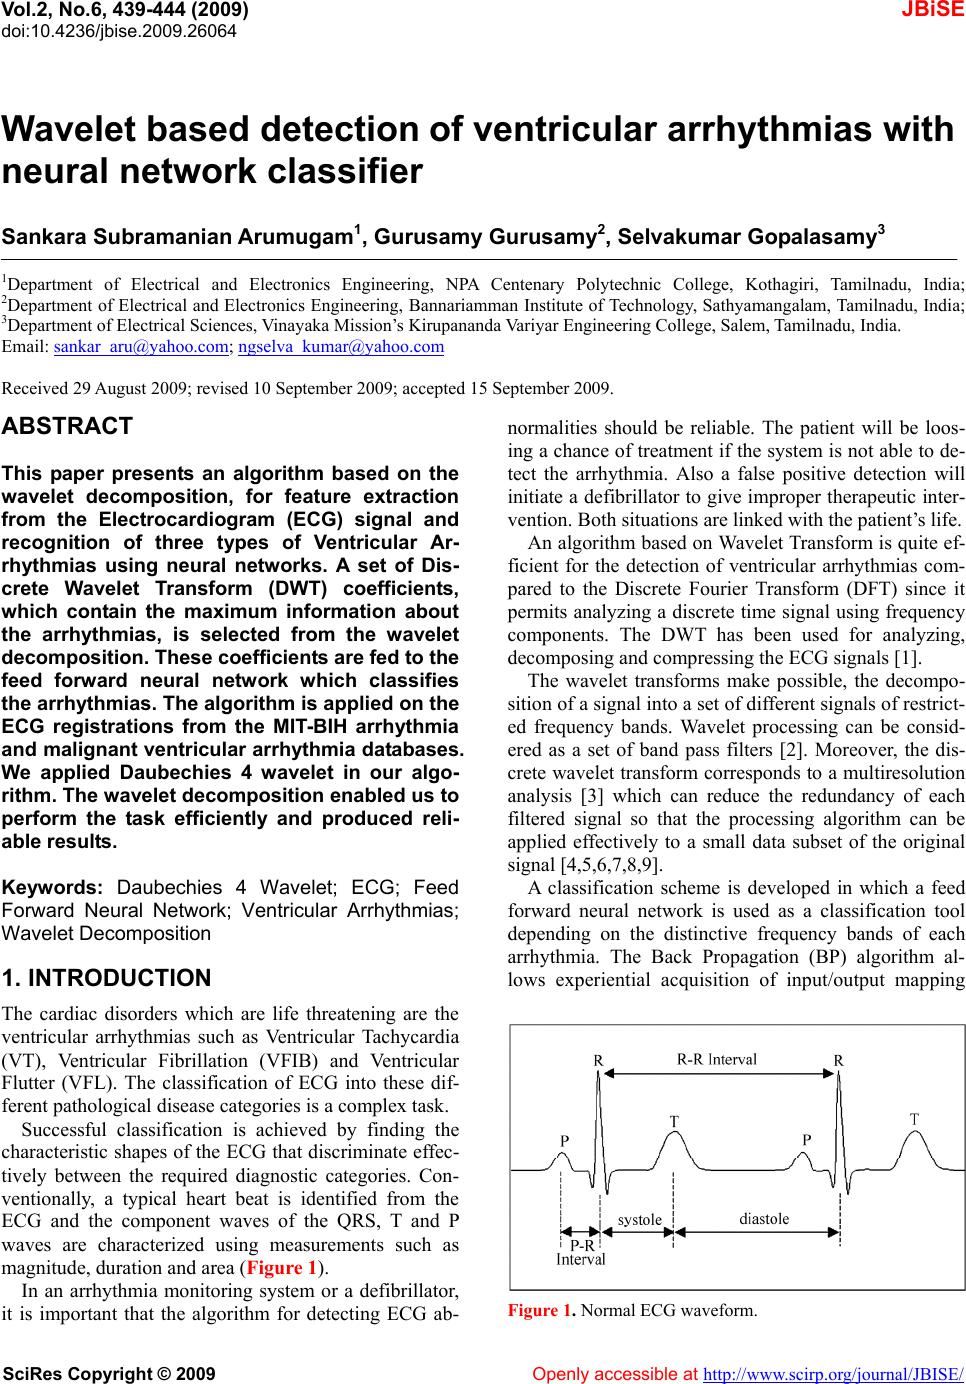 Vol.2, No.6, 439-444 (2009) doi:10.4236/jbise.2009.26064 SciRes Copyright © 2009 Openly accessible at http://www.scirp.org/journal/JBISE/ JBiSE Wavelet based detection of ventricular arrhythmias with neural network classifier Sankara Subramanian Arumugam1, Gurusamy Gurusamy2, Selvakumar Gopalasamy3 1Department of Electrical and Electronics Engineering, NPA Centenary Polytechnic College, Kothagiri, Tamilnadu, India; 2Department of Electrical and Electronics Engineering, Bannariamman Institute of Technology, Sathyamangalam, Tamilnadu, India; 3Department of Electrical Sciences, Vinayaka Mission’s Kirupananda Variyar Engineering College, Salem, Tamilnadu, India. Email: [email protected]; [email protected] Received 29 August 2009; revised 10 September 2009; accepted 15 September 2009. ABSTRACT This paper presents an algorithm based on the wavelet decomposition, for feature extraction from the Electrocardiogram (ECG) signal and recognition of three types of Ventricular Ar- rhythmias using neural networks. A set of Dis- crete Wavelet Transform (DWT) coefficients, which contain the maximum information about the arrhythmias, is selected from the wavelet decompositio n. Th ese co eff icients are fed to t h e feed forward neural network which classifies the arrhythmias. The algorithm is applied on the ECG registrations from the MIT-BIH arrhythmia and malignant ventricular arrhythmia databases. We applied Daubechies 4 wavelet in our algo- rithm. The wavelet decomposition enabled us to perform the task efficiently and produced reli- able result s. Keywords: Daubechies 4 Wavelet; ECG; Feed Forward Neural Network; Ventricular Arrhythmias; Wavelet Decomposition 1. INTRODUCTION The cardiac disorders which are life threatening are the ventricular arrhythmias such as Ventricular Tachycardia (VT), Ventricular Fibrillation (VFIB) and Ventricular Flutter (VFL). The classification of ECG into these dif- ferent pathological disease categories is a complex task. Successful classification is achieved by finding the characteristic shapes of the ECG that discriminate effec- tively between the required diagnostic categories. Con- ventionally, a typical heart beat is identified from the ECG and the component waves of the QRS, T and P waves are characterized using measurements such as magnitude, duration and area (Figure 1). In an arrhythmia monitoring system or a defibrillator, it is important that the algorithm for detecting ECG ab- normalities should be reliable. The patient will be loos- ing a chance of treatment if the system is not able to de- tect the arrhythmia. Also a false positive detection will initiate a defibrillator to give improper therapeutic inter- vention. Both situations are linked with the patient’s life. An algorithm based on Wavelet Transform is quite ef- ficient for the detection of ventricular arrhythmias com- pared to the Discrete Fourier Transform (DFT) since it permits analyzing a discrete time signal using frequency components. The DWT has been used for analyzing, decomposing and compressing the ECG signals [1]. The wavelet transforms make possible, the decompo- sition of a signal into a set of different signals of restrict- ed frequency bands. Wavelet processing can be consid- ered as a set of band pass filters [2]. Moreover, the dis- crete wavelet transform corresponds to a multiresolution analysis [3] which can reduce the redundancy of each filtered signal so that the processing algorithm can be applied effectively to a small data subset of the original signal [4,5,6,7,8,9]. A classification scheme is developed in which a feed forward neural network is used as a classification tool depending on the distinctive frequency bands of each arrhythmia. The Back Propagation (BP) algorithm al- lows experiential acquisition of input/output mapping Figure 1. Normal ECG waveform. 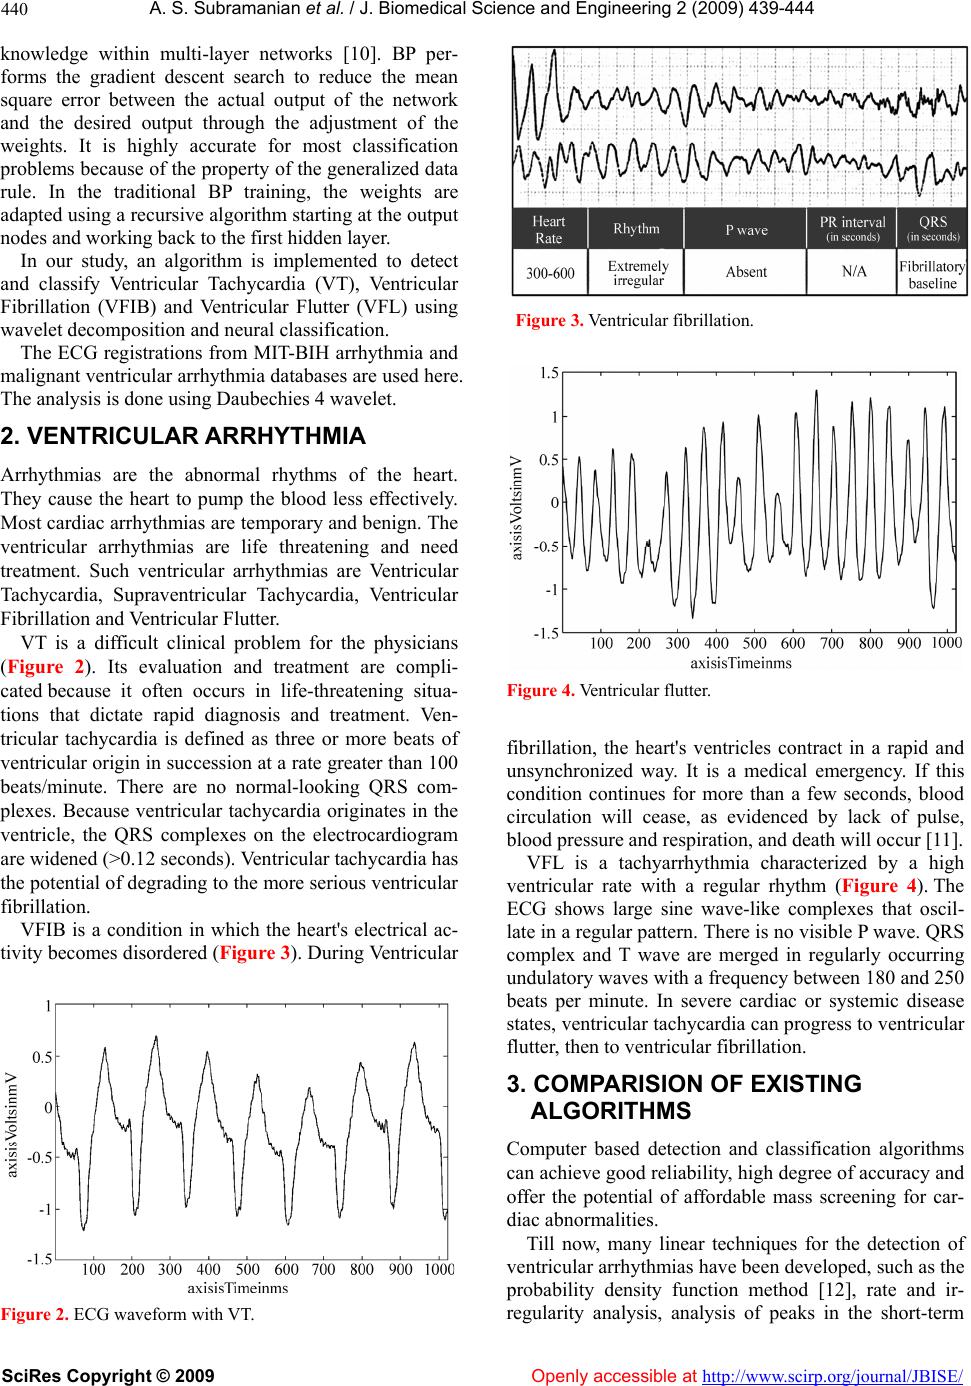 A. S. Subramanian et al. / J. Biomedical Science and En gineering 2 (2009) 439-444 SciRes Copyright © 2009 Openly accessible at http://www.scirp.org/journal/JBISE/ 440 knowledge within multi-layer networks [10]. BP per- forms the gradient descent search to reduce the mean square error between the actual output of the network and the desired output through the adjustment of the weights. It is highly accurate for most classification problems because of the property of the generalized data rule. In the traditional BP training, the weights are adapted using a recursive algorithm starting at the output nodes and working back to the first hidden layer. In our study, an algorithm is implemented to detect and classify Ventricular Tachycardia (VT), Ventricular Fibrillation (VFIB) and Ventricular Flutter (VFL) using wavelet decomposition and neural classification. The ECG registrations from MIT-BIH arrhythmia and malignant ventricular arrhythmia databases are used here. The analysis is done using Daubechies 4 wavelet. 2. VENTRICULAR ARRHYTHMIA Arrhythmias are the abnormal rhythms of the heart. They cause the heart to pump the blood less effectively. Most cardiac arrhythmias are temporary and benign. The ventricular arrhythmias are life threatening and need treatment. Such ventricular arrhythmias are Ventricular Tachycardia, Supraventricular Tachycardia, Ventricular Fibrillation and Ventricular Flutter. VT is a difficult clinical problem for the physicians (Figure 2). Its evaluation and treatment are compli- cated because it often occurs in life-threatening situa- tions that dictate rapid diagnosis and treatment. Ven- tricular tachycardia is defined as three or more beats of ventricular origin in succession at a rate greater than 100 beats/minute. There are no normal-looking QRS com- plexes. Because ventricular tachycardia originates in the ventricle, the QRS complexes on the electrocardiogram are widened (>0.12 seconds). Ventricular tachycardia has the potential of degrading to the more serious ventricular fibrillation. VFIB is a condition in which the heart's electrical ac- tivity becomes disordered (Figure 3). During Ventricular Figure 2. ECG waveform with VT. Figure 3. Ventricular fibrillation. Figure 4. Ventricular flutter. fibrillation, the heart's ventricles contract in a rapid and unsynchronized way. It is a medical emergency. If this condition continues for more than a few seconds, blood circulation will cease, as evidenced by lack of pulse, blood pressure and respiration, and death will occur [11]. VFL is a tachyarrhythmia characterized by a high ventricular rate with a regular rhythm (Figure 4). The ECG shows large sine wave-like complexes that oscil- late in a regular pattern. There is no visible P wave. QRS complex and T wave are merged in regularly occurring undulatory waves with a frequency between 180 and 250 beats per minute. In severe cardiac or systemic disease states, ventricular tachycardia can progress to ventricular flutter, then to ventricular fibrillation. 3. COMPARISION OF EXISTING ALGORITHMS Computer based detection and classification algorithms can achieve good reliability, high degree of accuracy and offer the potential of affordable mass screening for car- diac abnormalities. Till now, many linear techniques for the detection of ventricular arrhythmias have been developed, such as the probability density function method [12], rate and ir- regularity analysis, analysis of peaks in the short-term 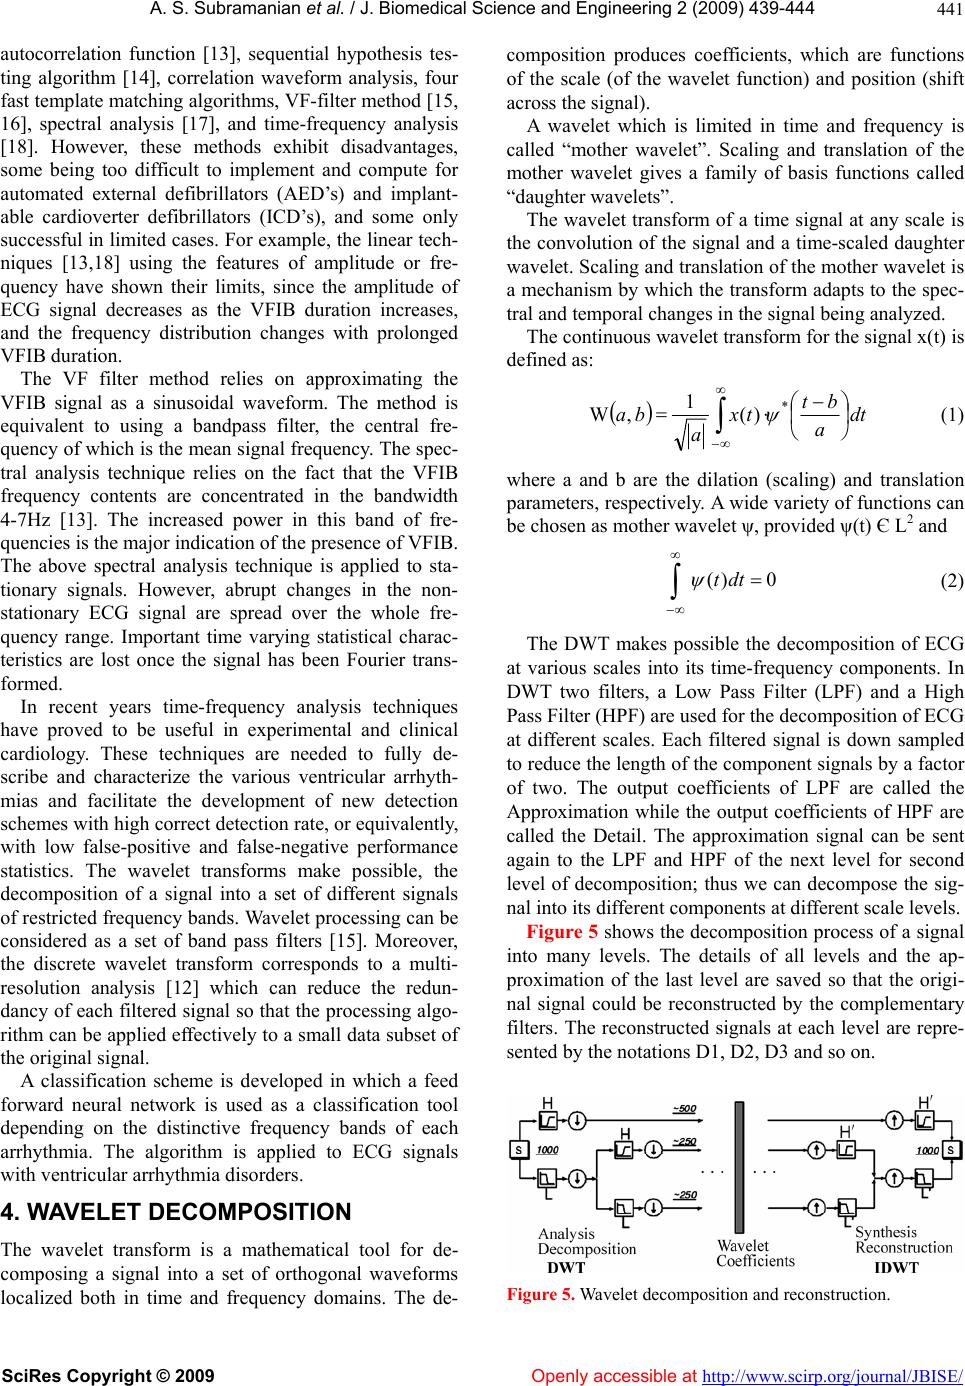 A. S. Subramanian et al. / J. Biomedical Science and En gineering 2 (2009) 439-444 SciRes Copyright © 2009 http://www.scirp.org/journal/JBISE/ 441 autocorrelation function [13], sequential hypothesis tes- ting algorithm [14], correlation waveform analysis, four fast template matching algorithms, VF-filter method [15, 16], spectral analysis [17], and time-frequency analysis [18]. However, these methods exhibit disadvantages, some being too difficult to implement and compute for automated external defibrillators (AED’s) and implant- able cardioverter defibrillators (ICD’s), and some only successful in limited cases. For example, the linear tech- niques [13,18] using the features of amplitude or fre- quency have shown their limits, since the amplitude of ECG signal decreases as the VFIB duration increases, and the frequency distribution changes with prolonged VFIB duration. Openly accessible at The VF filter method relies on approximating the VFIB signal as a sinusoidal waveform. The method is equivalent to using a bandpass filter, the central fre- quency of which is the mean signal frequency. The spec- tral analysis technique relies on the fact that the VFIB frequency contents are concentrated in the bandwidth 4-7Hz [13]. The increased power in this band of fre- quencies is the major indication of the presence of VFIB. The above spectral analysis technique is applied to sta- tionary signals. However, abrupt changes in the non- stationary ECG signal are spread over the whole fre- quency range. Important time varying statistical charac- teristics are lost once the signal has been Fourier trans- formed. In recent years time-frequency analysis techniques have proved to be useful in experimental and clinical cardiology. These techniques are needed to fully de- scribe and characterize the various ventricular arrhyth- mias and facilitate the development of new detection schemes with high correct detection rate, or equivalently, with low false-positive and false-negative performance statistics. The wavelet transforms make possible, the decomposition of a signal into a set of different signals of restricted frequency bands. Wavelet processing can be considered as a set of band pass filters [15]. Moreover, the discrete wavelet transform corresponds to a multi- resolution analysis [12] which can reduce the redun- dancy of each filtered signal so that the processing algo- rithm can be applied effectively to a small data subset of the original signal. A classification scheme is developed in which a feed forward neural network is used as a classification tool depending on the distinctive frequency bands of each arrhythmia. The algorithm is applied to ECG signals with ventricular arrhythmia disorders. 4. WAVELET DECOMPOSITION The wavelet transform is a mathematical tool for de- composing a signal into a set of orthogonal waveforms localized both in time and frequency domains. The de- composition produces coefficients, which are functions of the scale (of the wavelet function) and position (shift across the signal). A wavelet which is limited in time and frequency is called “mother wavelet”. Scaling and translation of the mother wavelet gives a family of basis functions called “daughter wavelets”. The wavelet transform of a time signal at any scale is the convolution of the signal and a time-scaled daughter wavelet. Scaling and translation of the mother wavelet is a mechanism by which the transform adapts to the spec- tral and temporal changes in the signal being analyzed. The continuous wavelet transform for the signal x(t) is defined as: dt a bt tx a ba * )( 1 ,W (1) where a and b are the dilation (scaling) and translation parameters, respectively. A wide variety of functions can be chosen as mother wavelet ψ, provided ψ(t) Є L2 and 0)( dtt (2) The DWT makes possible the decomposition of ECG at various scales into its time-frequency components. In DWT two filters, a Low Pass Filter (LPF) and a High Pass Filter (HPF) are used for the decomposition of ECG at different scales. Each filtered signal is down sampled to reduce the length of the component signals by a factor of two. The output coefficients of LPF are called the Approximation while the output coefficients of HPF are called the Detail. The approximation signal can be sent again to the LPF and HPF of the next level for second level of decomposition; thus we can decompose the sig- nal into its different components at different scale levels. Figure 5 shows the decomposition process of a signal into many levels. The details of all levels and the ap- proximation of the last level are saved so that the origi- nal signal could be reconstructed by the complementary filters. The reconstructed signals at each level are repre- sented by the notations D1, D2, D3 and so on. Figure 5. Wavelet decomposition and reconstruction. 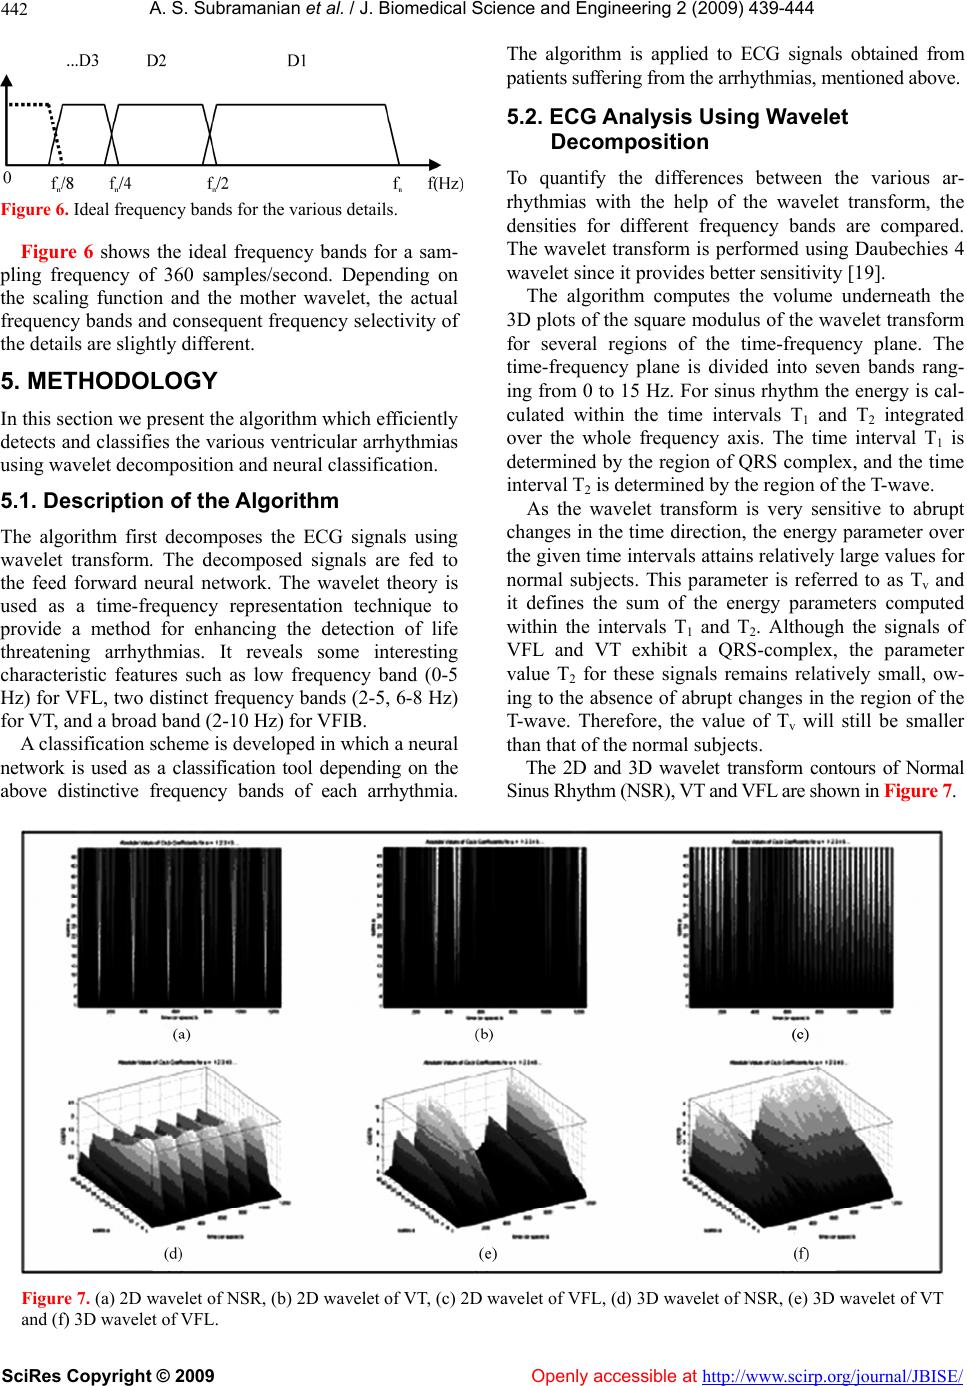 A. S. Subramanian et al. / J. Biomedical Science and En gineering 2 (2009) 439-444 SciRes Copyright © 2009 Openly accessible at http://www.scirp.org/journal/JBISE/ 442 Figure 6. Ideal frequency bands for the various details. Figure 6 shows the ideal frequency bands for a sam- pling frequency of 360 samples/second. Depending on the scaling function and the mother wavelet, the actual frequency bands and consequent frequency selectivity of the details are slightly different. 5. METHODOLOGY In this section we present the algorithm which efficiently detects and classifies the various ventricular arrhythmias using wavelet decomposition and neural classification. 5.1. Description of the Algorithm The algorithm first decomposes the ECG signals using wavelet transform. The decomposed signals are fed to the feed forward neural network. The wavelet theory is used as a time-frequency representation technique to provide a method for enhancing the detection of life threatening arrhythmias. It reveals some interesting characteristic features such as low frequency band (0-5 Hz) for VFL, two distinct frequency bands (2-5, 6-8 Hz) for VT, and a broad band (2-10 Hz) for VFIB. A classification scheme is developed in which a neural network is used as a classification tool depending on the above distinctive frequency bands of each arrhythmia. The algorithm is applied to ECG signals obtained from patients suffering from the arrhythmias, mentioned above. 5.2. ECG Analysis Using Wavelet Decomposition To quantify the differences between the various ar- rhythmias with the help of the wavelet transform, the densities for different frequency bands are compared. The wavelet transform is performed using Daubechies 4 wavelet since it provides better sensitivity [19]. The algorithm computes the volume underneath the 3D plots of the square modulus of the wavelet transform for several regions of the time-frequency plane. The time-frequency plane is divided into seven bands rang- ing from 0 to 15 Hz. For sinus rhythm the energy is cal- culated within the time intervals T1 and T2 integrated over the whole frequency axis. The time interval T1 is determined by the region of QRS complex, and the time interval T2 is determined by the region of the T-wave. As the wavelet transform is very sensitive to abrupt changes in the time direction, the energy parameter over the given time intervals attains relatively large values for normal subjects. This parameter is referred to as Tv and it defines the sum of the energy parameters computed within the intervals T1 and T2. Although the signals of VFL and VT exhibit a QRS-complex, the parameter value T2 for these signals remains relatively small, ow- ing to the absence of abrupt changes in the region of the T-wave. Therefore, the value of Tv will still be smaller than that of the normal subjects. The 2D and 3D wavelet transform contours of Normal Sinus Rhythm (NSR), VT and VFL are shown in Figure 7. Figure 7. (a) 2D wavelet of NSR, (b) 2D wavelet of VT, (c) 2D wavelet of VFL, (d) 3D wavelet of NSR, (e) 3D wavelet of VT and (f) 3D wavelet of VFL. 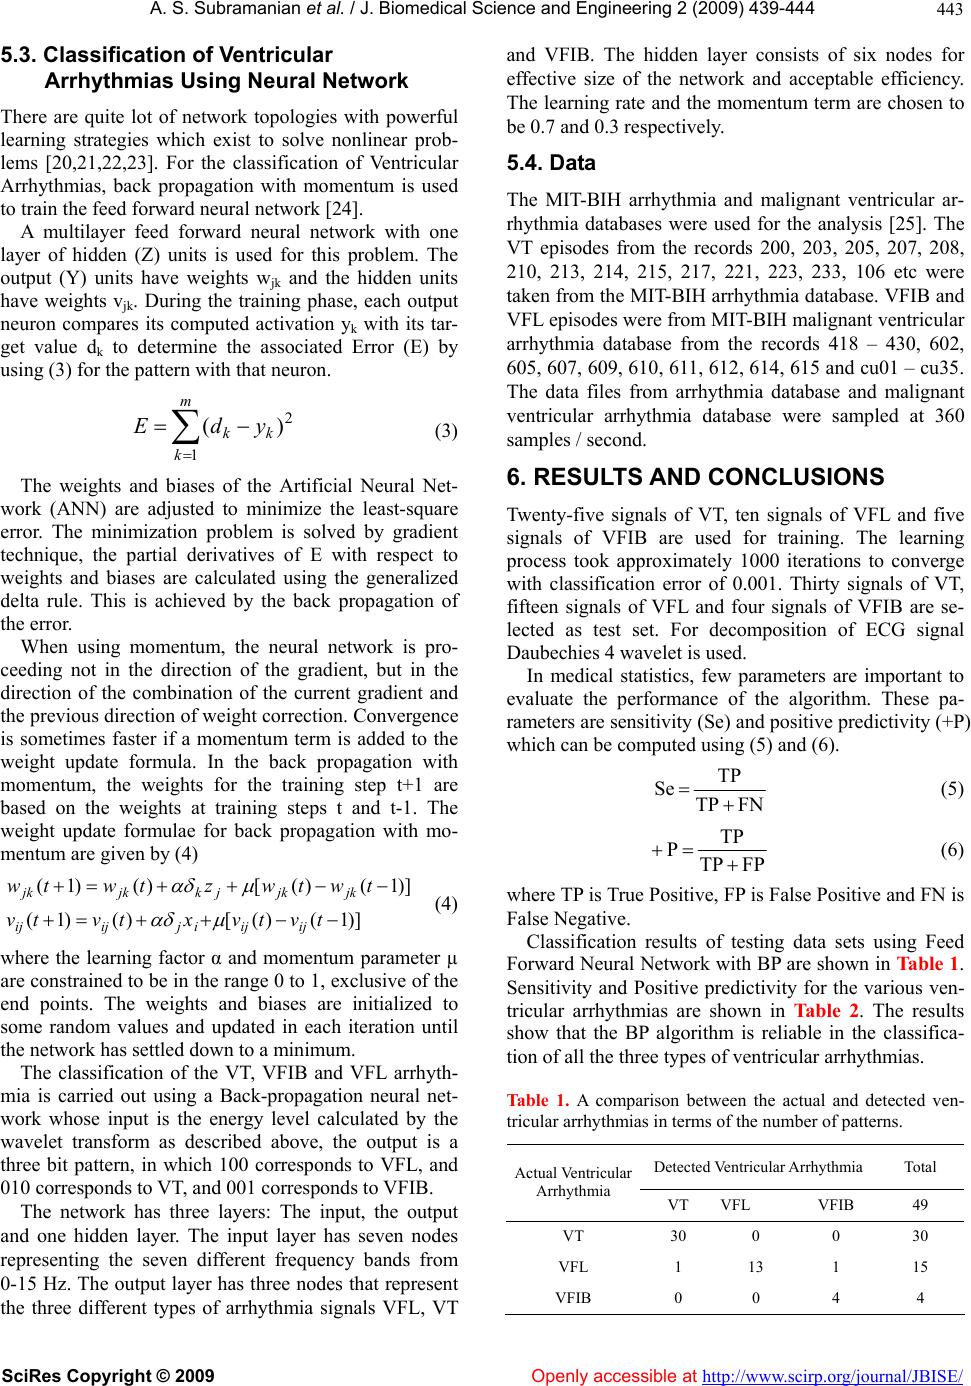 A. S. Subramanian et al. / J. Biomedical Science and En gineering 2 (2009) 439-444 SciRes Copyright © 2009 Openly accessible at http://www.scirp.org/journal/JBISE/ 443 5. ful learni ou (3) The weights and biases of the A work (ANN) er in the direction of the gradient, but in the 3. Classification of Ventricular Arrhythmias Using Neural Network There are quite lot of network topologies with power ng strategies which exist to solve nonlinear prob- lems [20,21,22,23]. For the classification of Ventricular Arrhythmias, back propagation with momentum is used to train the feed forward neural network [24]. A multilayer feed forward neural network with one layer of hidden (Z) units is used for this problem. The tput (Y) units have weights wjk and the hidden units have weights vjk. During the training phase, each output neuron compares its computed activation yk with its tar- get value dk to determine the associated Error (E) by using (3) for the pattern with that neuron. m 2 )( k kk ydE 1 rtificial Neural Net- are adjusted to minimize the least-square ror. The minimization problem is solved by gradient technique, the partial derivatives of E with respect to weights and biases are calculated using the generalized delta rule. This is achieved by the back propagation of the error. When using momentum, the neural network is pro- ceeding not direction of the combination of the current gradient and the previous direction of weight correction. Convergence is sometimes faster if a momentum term is added to the weight update formula. In the back propagation with momentum, the weights for the training step t+1 are based on the weights at training steps t and t-1. The weight update formulae for back propagation with mo- mentum are given by (4) )]1()([)()1( twtwztwtw kjkjk )]1()([)()1( tvtvxtvtv ijijijijij jkjkj (4) where the learning factor α and momentum param eural net- r d for the analysis [25]. The rom the records 200, 203, 205, 207, 208, 14, 215, 217, 221, 223, 233, 106 etc were re used for training. The learning onverge of VT, ) and (6). eter µ are constrained to be in the range 0 to 1, exclusive of the end points. The weights and biases are initialized to some random values and updated in each iteration until the network has settled down to a minimum. The classification of the VT, VFIB and VFL arrhyth- mia is carried out using a Back-propagation n work whose input is the energy level calculated by the wavelet transform as described above, the output is a three bit pattern, in which 100 corresponds to VFL, and 010 corresponds to VT, and 001 corresponds to VFIB. The network has three layers: The input, the output and one hidden layer. The input layer has seven nodes representing the seven different frequency bands from 0-15 Hz. The output layer has three nodes that represent the three different types of arrhythmia signals VFL, VT effective size of the network and acceptable efficiency. The learning rate and the momentum term are chosen to be 0.7 and 0.3 respectively. 5.4. Data The MIT-BIH arrhythmia and malignant ventricular ar- rhythmia databases were use and VFIB. The hidden layer consists of six nodes fo VT episodes f 210, 213, 2 taken from the MIT-BIH arrhythmia database. VFIB and VFL episodes were from MIT-BIH malignant ventricular arrhythmia database from the records 418 – 430, 602, 605, 607, 609, 610, 611, 612, 614, 615 and cu01 – cu35. The data files from arrhythmia database and malignant ventricular arrhythmia database were sampled at 360 samples / second. 6. RESULTS AND CONCLUSIONS Twenty-five signals of VT, ten signals of VFL and five signals of VFIB a process took approximately 1000 iterations to c with classification error of 0.001. Thirty signals fifteen signals of VFL and four signals of VFIB are se- lected as test set. For decomposition of ECG signal Daubechies 4 wavelet is used. In medical statistics, few parameters are important to evaluate the performance of the algorithm. These pa- rameters are sensitivity (Se) and positive predictivity (+P) which can be computed using (5 FNTP TP Se (5) FPTP TP P (6) where TP is True Positive, FP is False Positive and False Negative. Classification results of testi Forward Neural Network with BP are shown in Table 1. ias are shown in Table 2. The results sh Detected Ventricular Arrhythmia Total FN is ng data sets using Feed Sensitivity and Positive predictivity for the various ven- tricular arrhythm ow that the BP algorithm is reliable in the classifica- tion of all the three types of ventricular arrhythmias. Table 1. A comparison between the actual and detected ven- tricular arrhythmias in terms of the number of patterns. Actual Ventricular Arrhythmia VT VFL VFIB 49 VT 30 0 0 30 VFL 1 13 1 15 VFIB 0 04 4 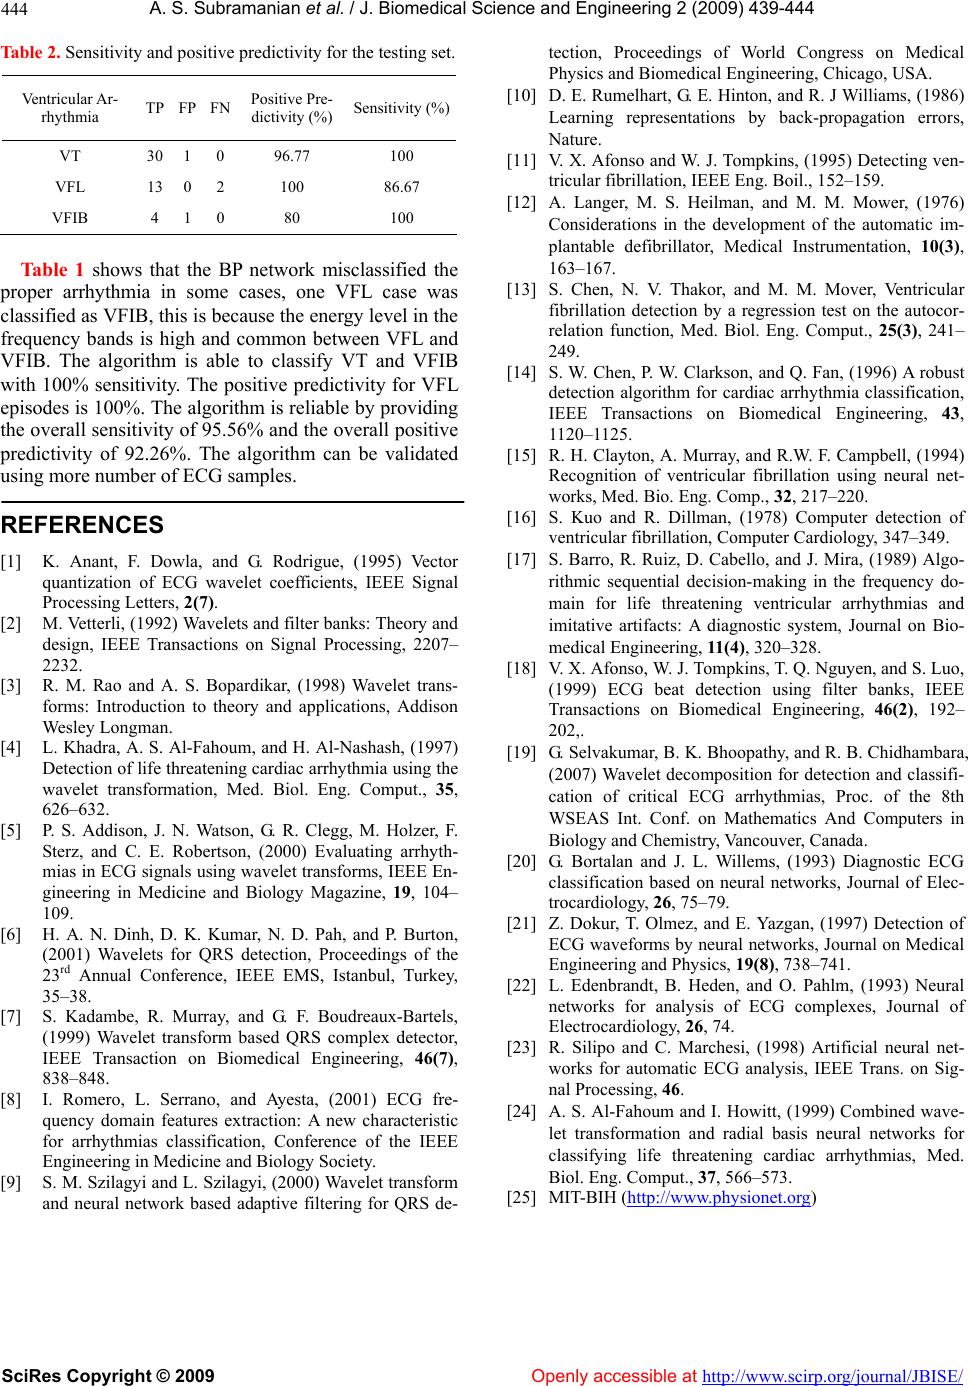 A. S. Subramanian et al. / J. Biomedical Science and En gineering 2 (2009) 439-444 SciRes Copyright © 2009 http://www.scirp.org/journal/JBISE/ 444 Table 2sitivity and positive predictivity r the testing s Ven Ar-TP FP FN sitive Pr ctivity (%Sensitivity (%) . Senfoet. Openly accessible at tricular rhythmia Po e- di) VT 30 1 0 96.77 100 VFL VFIB 13 4 0 1 2 0 100 80 86.67 100 Tabl shows that te BP network misclashe properythmi mcasee VFL classified as VFIB, this is ause energy level in the equency bands is high and common between VFL V ents, IEEE Signal 2(7). Wavelets and filter banks: Theory and rs, ibrillation, IEEE Eng. Boil., 152–159. matic im- detection by a regression test on the autocor- ion algorithm for cardiac arrhythmia classification, of ventricular fibrillation using neural net- –349. - lter banks, IEEE Wavelet decomposition for detection and classifi- nal of Elec- l networks, Journal on Medical s, Journal of analysis, IEEE Trans. on Sig- nd radial basis neural networks for tection, Proceedings of World Congress on Medical Physics and Biomedical Engineering, Chicago, USA. [10] D. E. Rumelhart, G. E. Hinton, and R. J Williams, (1986) Learning representations by back-propagation erro Nature. [11] V. X. Afonso and W. J. Tompkins, (1995) Detecting ven- tricular f [12] A. Langer, M. S. Heilman, and M. M. Mower, (1976) Considerations in the development of the auto e 1 arrh h so sified t case was a ine s, on becthe and relation function, Med. Biol. Eng. Comput., 25(3), 241– 249. [14] S. W. Chen, P. W. Clarkson, and Q. Fan, (1996) A robust detect plantable defibrillator, Medical Instrumentation, 10(3), 163–167. [13] S. Chen, N. V. Thakor, and M. M. Mover, Ventricular fibrillation fr FIB. The algorithm is able to classify VT and VFIB with 100% sensitivity. The positive predictivity for VFL episodes is 100%. The algorithm is reliable by providing the overall sensitivity of 95.56% and the overall positive predictivity of 92.26%. The algorithm can be validated using more number of ECG samples. REFERENCES [1] K. Anant, F. Dowla, and G. Rodrigue, (1995) Vector quantization of ECG wavelet coeffici IEEE Transactions on Biomedical Engineering, 43, 1120–1125. [15] R. H. Clayton, A. Murray, and R.W. F. Campbell, (1994) Recognition works, Med. Bio. Eng. Comp., 32, 217–220. [16] S. Kuo and R. Dillman, (1978) Computer detection of ventricular fibrillation, Computer Cardiology, 347 Processing Letters, [2] M. Vetterli, (1992) design, IEEE Transactions on Signal Processing, 2207– 2232. [3] R. M. Rao and A. S. Bopardikar, (1998) Wavelet trans- forms: Introduction to theory and applications, Addison Wesley Longman. [4] L. Khadra, A. S. Al-Fahoum, and H. Al-Nashash, (1997) Detection of life threatening cardiac arrhythmia using the wavelet transformation, Med. Biol. Eng. Comput., 35, 626–632. [5] P. S. Addison, J. N. Watson, G. R. Clegg, M. Holzer, F. Sterz, and C. E. Robertson, (2000) Evaluating arrhyth- mias in ECG signals using wavelet transforms, IEEE En- gineering in Medicine and Biology Magazine, 19, 104– 109. [6] H. A. N. Dinh, D. K. Kumar, N. D. Pah, and P. Burton, (2001) Wavelets for QRS detection, Proceedings of the 23rd Annual Conference, IEEE EMS, Istanbul, Turkey, 35–38. [7] S. Kadambe, R. Murray, and G. F. Boudreaux-Bartels, (1999) Wavelet transform based QRS complex detector, IEEE Transaction on Biomedical Engineering, 46(7), 838–848. [8] I. Romero, L. Serrano, and Ayesta, (2001) ECG fre- quency domain features extraction: A new characteristic for arrhythmias classification, Conference of the IEEE Engineering in Medicine and Biology Society. [9] S. M. Szilagyi and L. Szilagyi, (2000) Wavelet transform and neural network based adaptive filtering for QRS de- [17] S. Barro, R. Ruiz, D. Cabello, and J. Mira, (1989) Algo- rithmic sequential decision-making in the frequency do main for life threatening ventricular arrhythmias and imitative artifacts: A diagnostic system, Journal on Bio- medical Engineering, 11(4), 320–328. [18] V. X. Afonso, W. J. Tompkins, T. Q. Nguyen, and S. Luo, (1999) ECG beat detection using fi Transactions on Biomedical Engineering, 46(2), 192– 202,. [19] G. Selvakumar, B. K. Bhoopathy, and R. B. Chidhambara, (2007) cation of critical ECG arrhythmias, Proc. of the 8th WSEAS Int. Conf. on Mathematics And Computers in Biology and Chemistry, Vancouver, Canada. [20] G. Bortalan and J. L. Willems, (1993) Diagnostic ECG classification based on neural networks, Jour trocardiology, 26, 75–79. [21] Z. Dokur, T. Olmez, and E. Yazgan, (1997) Detection of ECG waveforms by neura Engineering and Physics, 19(8), 738–741. [22] L. Edenbrandt, B. Heden, and O. Pahlm, (1993) Neural networks for analysis of ECG complexe Electrocardiology, 26, 74. [23] R. Silipo and C. Marchesi, (1998) Artificial neural net- works for automatic ECG nal Processing, 46. [24] A. S. Al-Fahoum and I. Howitt, (1999) Combined wave- let transformation a classifying life threatening cardiac arrhythmias, Med. Biol. Eng. Comput., 37, 566–573. [25] MIT-BIH (http://www.physionet.org) |