

Paper Menu >>
Journal Menu >>
 Journal of Environmental Protection, 2011, 2, 1108-1112 doi:10.4236/jep.2011.28128 Published Online October 2011 (http://www.scirp.org/journal/jep) Copyright © 2011 SciRes. JEP Stratospheric Ozone Detection Using a Photon Stimulated Ozone Sensor Based on Indium Oxide Nanoparticles Chunyu Wang1*, Robert Willi Becker1, Otmar Kappeler1, Volker Cimalla1, Michael Matthes2, Jens Mundhenke3 1Fraunhofer Institute for Applied Solid State Physics, Freiburg, Germany; 2DL2SEK, Igersheim, Germany; 3DL4AAS, Igersheim, Germany Email: *[email protected] Received July 19th, 2011; revised August 26th, 2011; accepted September 27th, 2011. ABSTRACT Stratospheric ozone is normally measured using stationary equipments, such as a Dobson spectrometer and filter ozo- nometer, which have the disadvantages of large size, high price and high cost for operation and maintenance. In this work, a balloon-borne photostimulated ozone sensor based on indium oxide nanoparticles has been developed to meas- ure stratospheric ozone. Using the remote compact energy-saving room-temperature ozone sensor, a vertical distribu- tion of ozone concentration with a high resolution was obtained, and the ozone concentration at ~ 27 km over se a level between Lake C on stance, Germany and Lake Zurich, Switzerland was determined to be ~ 5.6 ppm. Keywords: Stratospheric Ozone, Photon Sti mulation, Indium Oxide Nanoparticles 1. Introduction It is of great importance to measure the stratospheric ozone, located between ~ 15 and 50 km above sea level, because the stratospheric ozone absorbs strongly ultra- violet (UV) radiation, in particular protecting organism from photodamage of the UV-B radiation (280 - 320 nm) [1]. The ozone concentration in the stratosphere is nor- mally monitored by two stationary methods: Dobson spectrometer, measures the total thickness of the ozone layer, and filter ozonometer, measures the ozone concen- tration in dependence of the altitude [2]. The Dobson spectrometer, located on the ground, detects a wave- length-dependent absorption of light, which is caused by a strong or weak absorption by ozone at different wave- lengths. The filter ozonometer employs a pair of UV filters or spectral bandpasses, and measures the different absorption at two wavelengths clo se to the poin t at wh ich light is mostly absorbed by ozone [3]. These two instru- ments are very large in size, heavy, and cost-intensive for operation and maintenance. Furthermore, these two methods can hardly be used for space-resolved monitor- ing with a high vertical resolution in order to understand the vertical distribution of ozone, which acts as an indi- cator and driver of climate change [4]. For this purpose, balloon-borne ozone sensors are of great interest. How- ever, the harsh environmental conditions in the upper troposphere, such as a temperature lower than –40˚C and a pressure lower than 20 mbar, limit the usage of com- mercial ozone sensors used normally on the ground. One up-to-date way is to apply balloon-borne ozonesonde based on an electrochemical concentration cell (ECC). The ECC senses ozone via a reaction with the electrolyte (a dilute solution of potassium iodide) in the ECC, yield- ing a current proportional to ozone concentration. How- ever, the ECC ozonesonde produces a high background current, which is not a constant as a function of time or ozone concentration, reducing the sensor accuracy, and leading to extremely low measured ozone concentrations [4]. Furthermore, the ECC ozonesonde has disadvantages, such as the requirement of frequent maintenance, risk of electrolyte desiccation, and unknown long-term stability. These shortcomings reduce the popularity of the ECC ozonesonder. In contrast, other commercial ozone sen- sors used on earth, su ch as ozone photometers an d metal oxide based ozone sensors, are not able to fulfil the re- quirements for an instrument to monitor the stratospheric ozone, such as small-size, portability, low energy-con- sumption, and low calibration complexity [5]. The ozon e  Stratospheric Ozone Detection Using a Photon Stimulated Ozone Sensor Based on Indium Oxide Nanoparticles1109 photometer is large in size and cost-intensive. The semi- conducting metal oxide based ozone sensors, which have been already developed for decades, are very compact and robust, possessing, however, an obvious disadvan- tage, i.e. high energy consumption due to the high-tem- perature operation. If this drawback can be overcome, this type of ozone sensor can be very suitable for moni- toring stratospheric ozone. Recently, we have demonstrated an alternative concept, which employed a sensor reactivation with the help of UV illumination instead of heating [6]. This type of sen - sor operated at room temperature is compact and energy- saving, and is very sensitive to ozone with the help of oxide nanoparticles. In this work, we demonstrate space- resolved ozone monitoring using the new type of ba- lloon-borne photostimulated ozone sensor based on in- dium oxide nanoparticles. 2. Materials and Methods An optical microscopy image of the photostimulated ozone sensor is shown in Figure 1(a). The ozone sensor consists of an in tegrated Pt heater, In2O3 nanoparicles on the surface acting as the sensing layer, and a GaInN quantum well (QW) based light emitting diode (LED) on the back side for photon reactivation (Figure 1(a)). The Pt heater evaporated on the surface of the sensing layers is applied to hold the sensor operation temperature at ~ 20˚C in the troposphere, where the temperature can be below –50˚C at an altitude of above 10 km. This stabi- lizes the operation and prevents condensation and freez- ing of water vapor on the active sensor area. The In2O3 nanoparicles with a mean diameter of ~ 7 nm were de- posited in a horizontal metal organic chemical vapor deposition (MOCVD) reactor (AIXTRON 200) at 200˚C on sapphire (0001) substrate by supplying trimethylin- dium and water vapor as the metal and oxygen precur- sors, respectively. In the transmission electron micro- graph, the lattice planes of the cubic crystal structure such as (321), (420), and (411) can be identified within the nanoparticles (Figure 1(b)). The GaInN QW based LED having a wavelength of ~ 400 nm was deposited on the back side the sapphire wafer in a further horizontal MOCVD system (AIXTRON 200). An image of the LED emitting violet light is shown in Figure 1(c). The integration and the structural characterization of In2O3 nanoparticles and LED have been reported elsewhere [6-8]. Figure 1(d) exhibits a typical ozone measurement in synthesized air with an ozone concentration of ~20 ppb. The photostimulated sensor chip operates in modu- lation mode, i.e. the GaInN QW LED was regularly switched on and off every 2 min, leading to a resistance decrease and increase the In2O3 layer, respectively [9]. On the right Y-axis, the O3 response, which is defined as the ratio between the resistance after LED-OFF and the one after LED-ON. This measuring principle was also used for measurements of the stratospheric ozone. A complete sensing system includes the sensor chip and an electronic unit. In the sensing system, additional miniaturized temperature and humidity sensors have also been implemented in order to determine the ambient conditions around the ozone sensor. The electronic unit controls the LED operation, measures the resistance change of the In2O3 layer, and calculates correspo nd ingly the ozone response. The whole sensor system has a size of 6 × 4 × 2 cm3 and a low energy consumption, and a low power consumption of less than 50 mW. The heating element for maintaining the sensor temperature at ~ 20˚C requires a maximum energy of ~ 200 mW in the tropo- sphere. Thus, the required energy for the complete sens- ing system can be supplied just by several batteries dur- ing the balloon flig ht , whi ch usually la st s 3 - 4 hours. The compact energy-saving sensor system was carried with a balloon to measure the stratospheric ozone within an European balloon project initiated by radio amateurs. First, the photostimultaed ozone sensor was calibrated in synthesized air in the laboratory on earth. Then, the sen- sor was launched in the city of Friedrichsh afen, Germany on June 28th, 2010 by a helium-driven balloon, which was equipped with GPS systems and live telemetry transmission on amateur bands. The measured ozone response was received from the control station and sev- eral mobile monitoring stations on the ground. 3. Results Figure 2(a) shows the ozone sensor response measured by the photostimulated ozone sensor during the whole flight. The ozone concentration was determined from these data considering humidity and pressure. Initially, the O3 response decreases, reaching a lowest point at an altitude of ~ 12 km. This is caused by a reduction of both humidity and ozone concentration in air. The corre- sponding minimum concentration is estimated to be lower than 20 ppb. This is consistent with the reported concentration values, such as lower than 5 ppb in the upper troposphere ([10]) or between 13 and 28 ppb at 5 km over sea level between Solomon Islands and Christ- mas Island [4]. Then, the ozone sensor response in- creased as the balloon ascended through the troposphere, indicating that the ozone concentration increases with the increasing altitude. As the balloon ascended to an alti- tude of ~ 27 km at a GPS-location of (47.296302 N, 8.589812 W) over Lake Zurich, Switzerland, the ozone response reached a peak of ~ 2.16 at an ambient tem- perature of ~ 0˚C, followed by a sharp decrease after balloon burst. It is worth mentioning that the maximum altitude arrived was ~ 28 km before balloon burst. How Copyright © 2011 SciRes. JEP 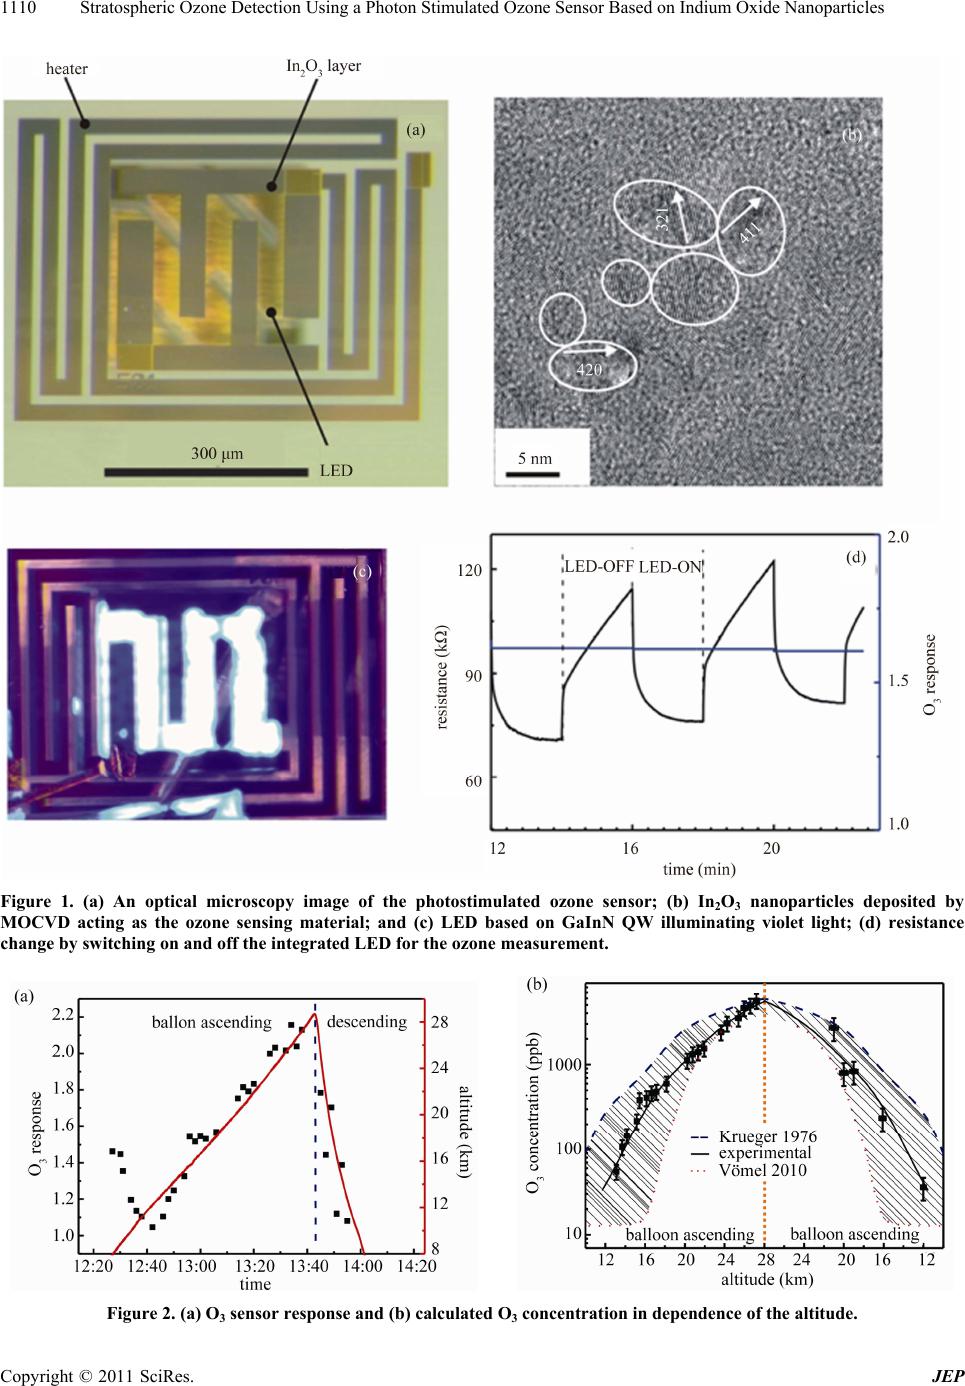 Stratospheric Ozone Detection Using a Photon Stimulated Ozone Sensor Based on Indium Oxide Nanoparticles Copyright © 2011 SciRes. JEP 1110 Figure 1. (a) An optical microscopy image of the photostimulated ozone sensor; (b) In2O3 nanoparticles deposited by MOCVD acting as the ozone sensing material; and (c) LED based on GaInN QW illuminating violet light; (d) resistance change by switching on and off the integrated LED for the ozone measurement. Figure 2. (a) O3 sensor response and (b) calculated O3 concentration in dependence of the altitude.  Stratospheric Ozone Detection Using a Photon Stimulated Ozone Sensor Based on Indium Oxide Nanoparticles1111 ever, because the photostimulated sensor detected ozone every 4 min, there were no ozone concentration measur- edsured for an altitude above ~ 27 km. The high temperature of ~ 0˚C at an altitude of ~ 27 km in the stratospheric layer is caused by absorption of UV radiation from the sun. The maximum ozone re- sponse of ~ 2.16 corresponds to ~ 130 ppb calibrated in synthesized air on earth (0% humidity, 20˚C and 1 bar). Considering that the ambient conditions in the strato- spheric layer (~ 0% humidity, ~ 0˚C, and ~ 20 mbar at ~ 27 km altitude) differ largely with those on earth, the ozone concentration should accordingly be converted. With respect to the definition of gas con centration in ppb, the ozone concentration can be approximately recalcu- lated with the help of the ideal gas law, which describes the state of an amount of gas: , where p is the pressure of the gas, V the volume, n the amount of gas, R the gas constant, and T the absolute temperature. Thus, the ozone concentration in the stratosphere can be recal- culated by: pV nRT s sa sa Cp Cp TT a (1) where Cs, Ts, Ps and Ca, Ta, Pa are the ozone concentra- tion, temperature and pressure in stratosphere and on earth, respectively. The results are shown in Figure 2(b). The two parts corresponds to the calculated concentra- tion values during ascending (left part) and descending (right part) of the balloon. The concentration values are in consistent with each other. In the decreasing direction, there are less measuring points, because the balloon de- scended faster. Since no reference data are available, the measured results are compared with typical data pub- lished in the literature. The experimental valu es lie with- in the range determined by the dotted and dashed lines (Figure 2(b)) as minimum and maximum values from references [4,11], respectively. A good agreement was observed over the whole altitude range with the data re- ported by Krueger et al. for the 1976 U. S. Standard At- mosphere, as shown by the dashed line in Figure 2(b) [11]. The ozone concentration at ~ 27 km altitude is de- termined to be ~ 5.6 ppm (5600 ppb), which is well con- sistent with the reported values between 2 and 8 ppm in the lower portion of the stratosphere [4,12]. 4. Conclusions In summary, we have demonstr ated altit ude-resolved ozone detection based on the photostimulated ozone sensor consisting of In2O3 nanoparticles and GaInN QW based LED. The remote compact energy-saving ozone sensor was used to measure stratospheric ozone at ~ 27 km over sea level between Lake Constance, Germany and Lake Zurich, Switzerland, which was determined to be ~ 5.6 ppm. 5. Acknowledgements This work was supported by the Fraunhofer Research Grants “Attract” and “Challenge”, and “Deutsche For- schungsgemeinschaft” (DFG) within the project “Ther- mInO” (SPP 1386/1). We would like to thank all the mem- bers in the German group of Balloon project P56 (www.ballonprojekt.de). Furthermore, we thank Mr. B. Raynor for critically reading the manuscript. REFERENCES [1] R. C. Smith and K. S. Baker, “Stratospheric Ozone, Mid- dle Ultraviolet-Radiation, and C-14 Measurements of Marine Productivity,” Science, Vol. 208, No. 4444, 1980, pp. 592-593. doi:10.1126/science.208.4444.592 [2] R. Stolarski, R. Bojkov, L. Bishop, C. Zerefos, J. Stae- helin and J. Zawodny, “Measured Trends in Stratospheric Ozone,” Science, Vol. 256, No. 5055, 1992, pp. 342-349. doi:10.1126/science.256.5055.342 [3] R. D. McPeters and S. M. Hollandsworth, “Trends in global ozone as of 1995,” International Journal of Envi- ronmental Studies, Vol. 51, No. 3, 1996, pp. 165-182. doi:10.1080/00207239608711079 [4] H. Vömel and K. Diaz, “Ozone Sonde Cell Current Measurements and Implications for Observations of Near-Zero Ozone Concentrations in the Tropical Upper Troposphere,” Atmospheric Measurement Techniques, Vol. 3, No. 2, 2010, pp. 495-505. doi:10.5194/amt-3-495-2010 [5] H. Nakagawa, S. Okazaki, S. Asakura, H. Shimizu and I. Iwamoto, “A New Ozone Sensor for an Ozone Genera- tor,” Sensors and Actuators B-Chemical, Vol. 77, No. 1-2, 2001, pp. 543-547. doi:10.1016/S0925-4005(01)00696-7 [6] C. Y. Wang, V. Cimalla, T. Kups, C. C. Röhlig, T. Stau- den, O. Ambacher, M. Kunzer, T. Passow, W. Schir- macher, W. Pletschen, K. Köhler and J. Wagner, “Inte- gration of In2O3 Nanoparticle Based Ozone Sensors with GaInN/GaN Light Emitting Diodes,” Applied Physics Letters, Vol. 91, No. 10, 2007, pp. 103509. doi:10.1063/1.2779971 [7] K. Köhler, T. Stephan, A. Perona, J. Wiegert, M. Maier, M. Kunzer and J. Wagner, “Control of the Mg Doping Profile in III-N Light-Emitting Diodes and Its Effect on the Electroluminescence Efficiency,” Journal of Applied Physics, Vol. 97, No. 10, 2005, pp. 104914-104918. doi:10.1063/1.1901836 [8] C. Y. Wang, V. Cimalla, H. Romanus, T. Kups, M. Nie- belschutz and O. Ambacher, “Tuning of Electrical and Structural Properties of Indium Oxide Films Grown by Metal Organic Chemical Vapor Deposition,” Thin Solid Films, Vol. 515, No. 16, 2007, pp. 6611-6614. doi:10.1016/j.tsf.2006.11.079 [9] C. Y. Wang, V. Cimalla, T. Kups, C. C. Rohlig, H. Ro- manus, V. Lebedev, J. Pezoldt, T. Stauden and O. Am- Copyright © 2011 SciRes. JEP  Stratospheric Ozone Detection Using a Photon Stimulated Ozone Sensor Based on Indium Oxide Nanoparticles 1112 bacher, “Photoreduction and Oxidation Behavior of In2O3 Nanoparticles by Metal Organic Chemical Vapor Deposi- tion,” Journal of Applied Physics, Vol. 102, No. 4, 2007, pp. 044310-044316. doi:10.1063/1.2770831 [10] D. Kley, P. J. Crutzen, H. G. J. Smit, H. Vomel, S. J. Oltmans, H. Grassl and V. Ramanathan, “Observations of Near-Zero Ozone Concentrations over the Convective Pacific: Effects on Air Chemistry,” Science, Vol. 274, No. 5285, 1996, pp. 230-233. doi:10.1126/science.274.5285.230 [11] A. J. Krueger and R. A. Minzner, “Mid-Latitude Ozone Model for 1976 United-States Standard Atmosphere,” Journal of Geophysical Research-Oceans and Atmos- pheres, Vol. 81, No. 24, 1976, pp. 4477-4481. doi:10.1029/JC081i024p04477 [12] G. Brasseur, “The Endangered Ozone-Layer,” Environ- ment, Vol. 29, No. 1, 1987, pp. 6-11. doi:10.1080/00139157.1987.9928845 C opyright © 2011 SciRes. JEP |