

Paper Menu >>
Journal Menu >>
 Materials Sciences and Applications, 2011, 2, 1516-1519 doi:10.4236/msa.2011.210204 Published Online October 2011 (http://www.SciRP.org/journal/msa) Copyright © 2011 SciRes. MSA A Comparative Study of Bisphenol-A, Hydantoin and Cyanuric Acid Based Epoxy Resins Using XRD Sanjay Swarup Coaching Institute, Agra, India. Email: [email protected] Received July 12th, 2011; revised August 4th, 2011; accepted September 4th, 2011. ABSTRACT To evaluate the efficiency of modified epoxy resins using bisphenol-A, hydantoin & cyanuric acid & to investigate the structural change due to the presence of Nitrogen atoms in polymeric chain for improved insulating properties, weatherability etc. The samples of epoxy resin bisphenol-A, hydantoin and Cyanuric acid based was taken for X-ray diffraction analysis. The diffraction patterns were Fourier analysed to get an exact idea about the change in the poly- mer structure. From X-ray diffraction analysis it was found that all physical parameters like area of cross section, number of carbon atoms per entanglement, stiffness parameter, particle size, percentage crystallinity & electron density fluctuation, in case of bisphenol-A based epoxy resin is more than other epoxy resins; that is; as the number of nitrogen atoms increased, all the physical parameters were reduced. In the present study only X-ray diffraction patterns of bisphenol-A, hydantoin and cyanuric acid based epoxy resins were studied. However their dielectric and ultrasonic properties could also be studied to get more information about the structure. With the help of X-ray diffraction patterns, one can easily check the synthesized samples of epoxy resins. The method to investigate the structural analysis of epoxy resin was novel and could find numerous applications in surface coatings. Keywords: X-Ray Diffraction, Epoxy Resins, Fourier Analysis, Crystallinity 1. Introduction Polymers are usually amorphous in nature and it is diffi- cult to interpret their detailed structure by methods like U.V. and I.R. spectroscopy. X-ray Diffraction has been successfully used in the study of various structural aspects of amorphous poly- mers [1], as carried out in the present research paper. Recently Liang et al. [2] did XRD studies on polyacryl- ics. Using XRD, the curing kinetics of epoxy resin was studied by Wei-Bing et al. [3]. Epoxy resins are com- pounds which contain the molecule more than one 1,2- epoxy group capable of undergoing polyreaction referred to as curing reactions [4]. Today epoxy resins are the versatile and widely used polymers essential for the various end uses of human civilization. The most widely used epoxy resins are diglycidyl ethers of bisphenol-A (DGEBA) derived from bisphenol-A and epichlorohydrin. Recently, epoxy resins derived from heterocyclic com- pounds have played a significant role showing good high temperature performance, outdoor WEATHERABILITY and insulating properties. A successful interpretation on X-ray DIFFRACTION studies regarding the structure of different resins was published earlier [5,6]. A constant search to get improved properties laid the foundation of a new generation of epoxy resins based on heterocyclic compounds consisting of hydantoin and triazine nuclei. Hydantoin based epoxy resins have been reported to provide increased pot life, chemical and sol- vent resistance and low smoke generation during com- bustion. Heat deflection temperature is significantly higher than that for comparably cured conventional ep- oxy resin [7]. Though conventionally used epoxy resins provide good properties for electrical insulation, hydan- toin based epoxy compositions have also been reported as superior electrical insulators. In this series cyanuric acid based epoxy resins have also been reported as good electrical insulators due to their superior adhesion, ther- mal, electrical and mechanical properties. Researchers have developed many suitable formulations based on 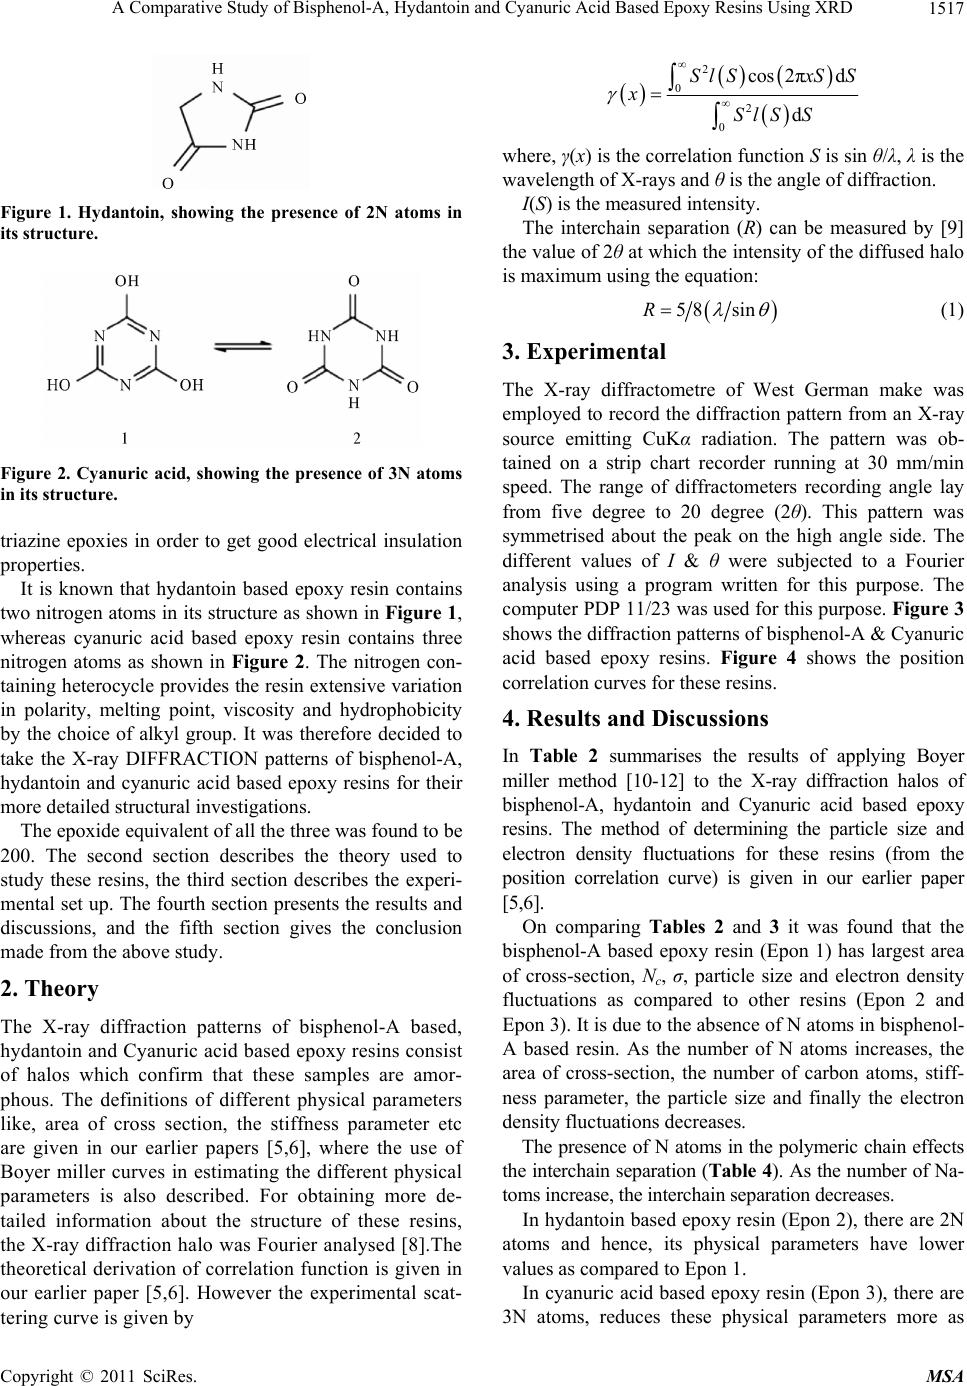 A Comparative Study of Bisphenol-A, Hydantoin and Cyanuric Acid Based Epoxy Resins Using XRD1517 Figure 1. Hydantoin, showing the presence of 2N atoms in its structure. Figure 2. Cyanuric acid, showing the presence of 3N atoms in its structure. triazine epoxies in order to get good electrical insulation properties. It is known that hydantoin based epoxy resin contains two nitrogen atoms in its structure as shown in Figure 1, whereas cyanuric acid based epoxy resin contains three nitrogen atoms as shown in Figure 2. The nitrogen con- taining heterocycle provides the resin extensive variation in polarity, melting point, viscosity and hydrophobicity by the choice of alkyl group. It was therefore decided to take the X-ray DIFFRACTION patterns of bisphenol-A, hydantoin and cyanuric acid based epoxy resins for their more detailed structural investigations. The epoxide equivalent of all the three was found to be 200. The second section describes the theory used to study these resins, the third section describes the experi- mental set up. The fourth section presents the results and discussions, and the fifth section gives the conclusion made from the above study. 2. Theory The X-ray diffraction patterns of bisphenol-A based, hydantoin and Cyanuric acid based epoxy resins consist of halos which confirm that these samples are amor- phous. The definitions of different physical parameters like, area of cross section, the stiffness parameter etc are given in our earlier papers [5,6], where the use of Boyer miller curves in estimating the different physical parameters is also described. For obtaining more de- tailed information about the structure of these resins, the X-ray diffraction halo was Fourier analysed [8].The theoretical derivation of correlation function is given in our earlier paper [5,6]. However the experimental scat- tering curve is given by 2 0 2 0 cos 2πd d Sl SxSS x Sl SS where, γ(x) is the correlation function S is sin θ/λ, λ is the wavelength of X-rays and θ is the angle of diffraction. I(S) is the measured intensity. The interchain separation (R) can be measured by [9] the value of 2θ at which the intensity of the diffused halo is maximum using the equation: 58 sinR (1) 3. Experimental The X-ray diffractometre of West German make was employed to record the diffraction pattern from an X-ray source emitting CuKα radiation. The pattern was ob- tained on a strip chart recorder running at 30 mm/min speed. The range of diffractometers recording angle lay from five degree to 20 degree (2θ). This pattern was symmetrised about the peak on the high angle side. The different values of I & θ were subjected to a Fourier analysis using a program written for this purpose. The computer PDP 11/23 was used for this purpose. Figure 3 shows the diffraction patterns of bisphenol-A & Cyanuric acid based epoxy resins. Figure 4 shows the position correlation curves for these resins. 4. Results and Discussions In Table 2 summarises the results of applying Boyer miller method [10-12] to the X-ray diffraction halos of bisphenol-A, hydantoin and Cyanuric acid based epoxy resins. The method of determining the particle size and electron density fluctuations for these resins (from the position correlation curve) is given in our earlier paper [5,6]. On comparing Tables 2 and 3 it was found that the bisphenol-A based epoxy resin (Epon 1) has largest area of cross-section, Nc, σ, particle size and electron density fluctuations as compared to other resins (Epon 2 and Epon 3). It is due to the absence of N atoms in bisphenol- A based resin. As the number of N atoms increases, the area of cross-section, the number of carbon atoms, stiff- ness parameter, the particle size and finally the electron density fluctuations decreases. The presence of N atoms in the polymeric chain effects the interchain separation (Table 4). As the number of Na- toms increase, the interchain separation decreases. In hydantoin based epoxy resin (Epon 2), there are 2N atoms and hence, its physical parameters have lower values as compared to Epon 1. In cyanuric acid based epoxy resin (Epon 3), there are 3N atoms, reduces these physical parameters more as Copyright © 2011 SciRes. MSA 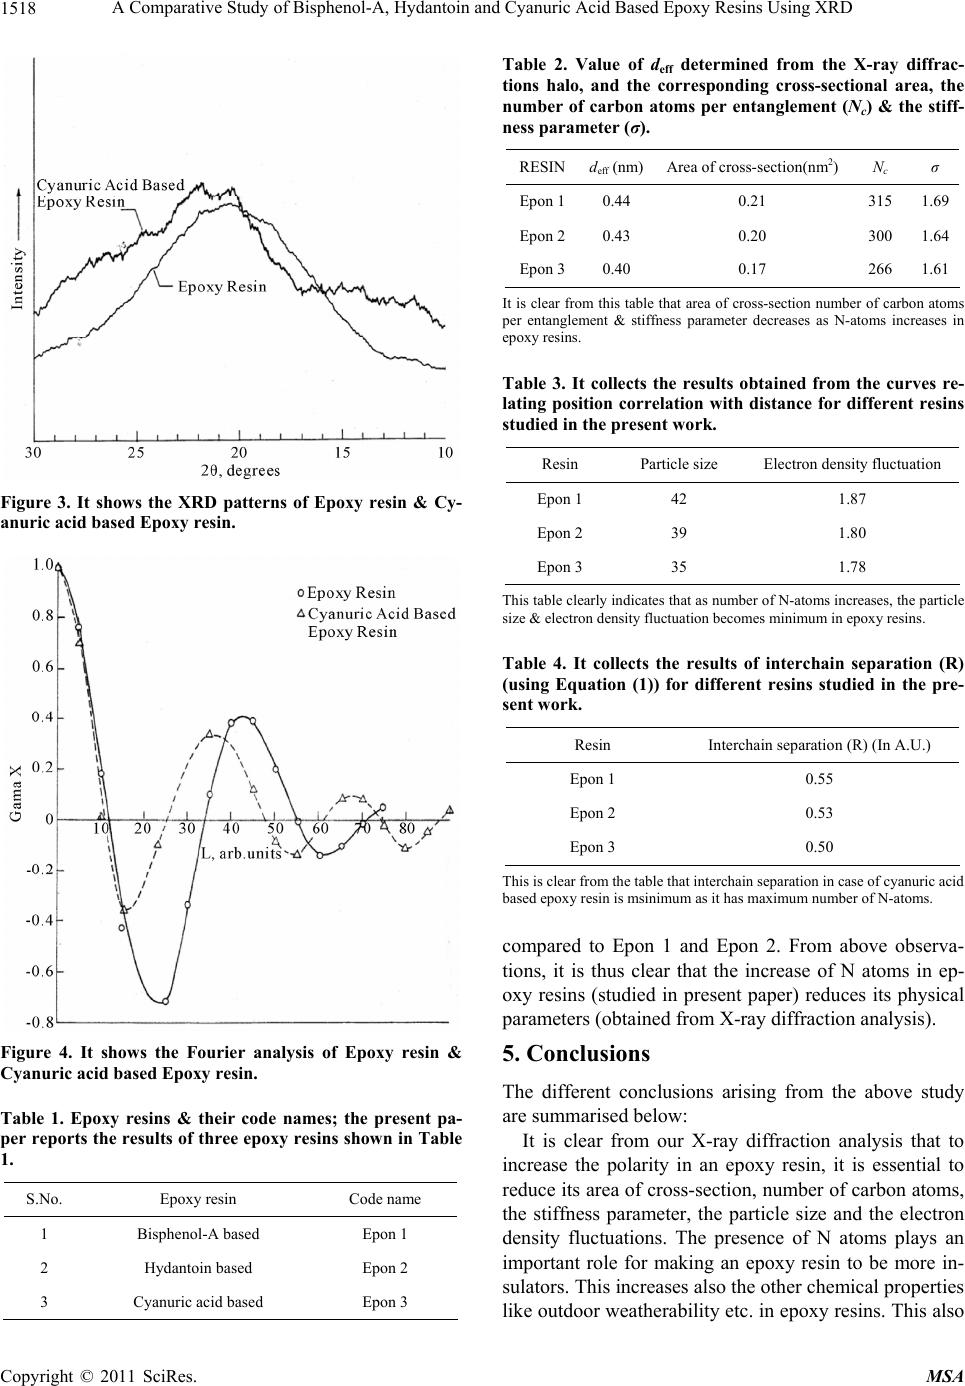 A Comparative Study of Bisphenol-A, Hydantoin and Cyanuric Acid Based Epoxy Resins Using XRD 1518 Figure 3. It shows the XRD patterns of Epoxy resin & Cy- anuric acid based Epoxy resin. Figure 4. It shows the Fourier analysis of Epoxy resin & Cyanuric acid based Epoxy resin. Table 1. Epoxy resins & their code names; the present pa- per reports the results of three epoxy resins shown in Table 1. S.No. Epoxy resin Code name 1 Bisphenol-A based Epon 1 2 Hydantoin based Epon 2 3 Cyanuric acid based Epon 3 Table 2. Value of deff determined from the X-ray diffrac- tions halo, and the corresponding cross-sectional area, the number of carbon atoms per entanglement (Nc) & the stiff- ness parameter (σ). RESIN deff (nm)Area of cross-section(nm2) Nc σ Epon 10.44 0.21 315 1.69 Epon 20.43 0.20 300 1.64 Epon 30.40 0.17 266 1.61 It is clear from this table that area of cross-section number of carbon atoms per entanglement & stiffness parameter decreases as N-atoms increases in epoxy resins. Table 3. It collects the results obtained from the curves re- lating position correlation with distance for different resins studied in the present work. Resin Particle size Electron density fluctuation Epon 1 42 1.87 Epon 2 39 1.80 Epon 3 35 1.78 This table clearly indicates that as number of N-atoms increases, the particle size & electron density fluctuation becomes minimum in epoxy resins. Table 4. It collects the results of interchain separation (R) (using Equation (1)) for different resins studied in the pre- sent work. Resin Interchain separation (R) (In A.U.) Epon 1 0.55 Epon 2 0.53 Epon 3 0.50 This is clear from the table that interchain separation in case of cyanuric acid based epoxy resin is msinimum as it has maximum number of N-atoms. compared to Epon 1 and Epon 2. From above observa- tions, it is thus clear that the increase of N atoms in ep- oxy resins (studied in present paper) reduces its physical parameters (obtained from X-ray diffraction analysis). 5. Conclusions The different conclusions arising from the above study are summarised below: It is clear from our X-ray diffraction analysis that to increase the polarity in an epoxy resin, it is essential to reduce its area of cross-section, number of carbon atoms, the stiffness parameter, the particle size and the electron density fluctuations. The presence of N atoms plays an important role for making an epoxy resin to be more in- sulators. This increases also the other chemical properties like outdoor weatherability etc. in epoxy resins. This also Copyright © 2011 SciRes. MSA  A Comparative Study of Bisphenol-A, Hydantoin and Cyanuric Acid Based Epoxy Resins Using XRD Copyright © 2011 SciRes. MSA 1519 concludes that the application of X-ray diffraction meas- urements leads to the successful interpretation of the structure of bisphenol-A, hydantoin and cyanuric acid based epoxy resins in terms of the presence of N atoms in their structure. REFERENCES [1] N. Sanjeev Murthy, “Recent Developments in Polymer Characterization Using X-Ray Diffraction,” The Rigaku Journal, Vol. 21, No. 1, 2004, pp. 15-24. [2] L. Guo, et al., “Preparation and Characterization of Chi- tosan Poly(Acrylic Acid) Magnetic Microspheres,” Ma- rine Drugs, Vol. 8, No. 7, 2010, pp. 2212-2222. doi:10.3390/md8072212 [3] W.-B. Xu, et al., “Montmorillonite Nanocomposites De- termined by Differential Scanning Calorimetry,” Journal of Applied Polymer Science, Vol. 88, No. 13, 2003, pp. 2932-2941. [4] M. Grayson, “Kirk-Othmer Encyclopedia of Chemical Technology,” 3rd Edition, Wiley-Intersciense, New York, 1980. [5] S. Swarup and S. Chandra, “X-Ray Diffraction of Maleic, Fumaric and Phenolic Resins,” Indian Journal of Tech- nology, Vol. 26, 1988, pp. 401-406. [6] S. Swarup and A. N. Nigam, “X-Ray Diffraction Studies of Vinylferrocene and Vinylruthenocene Polymers,” Polymer Communications, Vol. 30, No. 6, 1989, pp. 190-192. [7] E. H. Catasiff, E. B. Dee and R. Selter, (Resins Deptt, Ciba-Geigy Corp., Ardsley, New York) Mod. Plast, Vol. 55, No. 7, 1978. [8] S. Swarup, “Fourier Analysis of X-Ray Diffraction Pat- terns of Epoxy and Coal Tar Blended Epoxy Resins,” Pigment & Resin Technology, Vol. 19, No. 6, 1990, p.4. [9] R. Hussain and D. Mohammad, “X-Ray Diffraction Study of the Changes Induced during the Thermal Degradation of Poly(Methyl Methacrylate) & Poly(Methacryloyl Ch- loride),” Turkish Journal of Chemistry, Vol. 28, No. 6, 2004, pp. 725-729. [10] R. F. Boyer and R. L. Miller, “Regularities in X-Ray Scattering Patterns from Amorphous Polymers,” Journal of Applied Polymer Science, Vol. 29, No. 12, 1984, pp. 2043-2050. [11] R. F. Boyer and R. L. Miller, “Polymer Chain Stiffness Parameter, and Cross-Sectional Area per Chain,” Mac- romolecules, Vol. 10, 1977, p. 1167. doi:10.1021/ma60059a053 [12] R. F. Boyer and R. L. Miller, “Correlations of Liquid- State Compressibility and Bulk Modulus with Cross- Sectional Area per Polymer Chain,” Macromolecules, Vol. 17, 1984, p. 365. doi:10.1021/ma00133a019 |

