

Paper Menu >>
Journal Menu >>
 Vol.2, No.6, 400-404 (2009) doi:10.4236/jbise.2009.26057 SciRes Copyright © 2009 Openly accessible at http://www.scirp.org/journal/JBISE/ JBiSE Study of blood fat concentration based on serum ultraviolet absorption spectra and neural network Wei-Hua Zhu1,2 , Zhi-Min Zhao1, Xin Guo1, Le-Xin Wang1, Hui Chen1 1College of Science, Nanjing University of Aeronautics and Astronautics, Nanjing, China; 2College of Science, Hohai University, Nanjing, China. Email: [email protected]; [email protected] Received 11 April 2008; revised 31 May 2009; accepted 9 June 2009. ABSTRACT Blood plays an important role in the clinical di- agnosis and treatmen t, the analy sis of blood will be of very important practical significance. The experiment shows that the absorption spectra of blood are of serious noise in the wave band of 200 to 300 nm, which hides the useful spec- tral characteristics. The effective separation of the noise was achieved by db4 wavelet trans- form, and the signals of reconstruction have been obviously improved in the noise serious wave band, reflecting some useful information. The absorption peaks of different samples are displaced to some degrees. The correlation between absorbance at 278nm and blood fat concentration is no significant and random. Based on the evident correlation between se- rum absorption spectrum and blood fat con- centration in the wave band of 265 to 282nm, a neural network model was built to forecast the blood fat concentration, bringing a relatively good prediction. This provides a new spectral test method of blood fat conce ntration. Keywords: Blood Fat Concentration; Ultraviolet Absorption Spectra; Neural Network (NN); Serum; Wavelet Transform 1. INTRODUCTION An organism (especially the human organism) is a com- plex life system, with important spectral information. Research shows that the spectral features of an abnormal biological tissue will be changed. Swiss scientists found that nerve cell degeneration will lead Alzheimer’s dis- ease. Early diagnosis of the disease can be made th rough the analysis of fluorescence information of degeneration process of tissue [1]. Thus, it is a new challenging re- search topic to make effective analysis and diagnosis of disease using the spectrum information of biological tissue, particularly blood analysis technology. Some meaningful research about this have attracted much at- tention [2,3,4,5,6,7,8,9,10,11,12,13,14,15,16,17,18]. Although a lot of researches about blood spectra have been reported, a deep and general research is still need to be processed. This may be because that little blood sam- ple was used and the samples were not representative. For example, Wang et al. [2] have studied the infrared absorption sp ectra of nor mal blood sample and abno rmal blood sample, the difference of the spectra between normal and abnormal blood samples was obtained, how- ever, there are only three samples were researched, so the reliability of their results should be tested deeper. The actual blood components are very complex, so the absorption spectrum is consist of multiple spectral com- ponents, the information of the components can be ob- tained from the spectrum distribution and spectral char- acteristics. Neural network can simulate human learning to han- dle highly nonlinear problems. This can make it widely applied in complex systems forecast, achieving the effect of nonlinear mappings, which are difficult to achieve by traditional algorithms [19,20,21]. It is known from the early study [22] that the serum with different blood fat concentration presents unlike absorption spectrum, therefore, information such as blood fat in the serum can be obtained by analyzing the absorption spectrum of different concentration blood fat and then be help for diseases diagnosing. This paper studies the relation between the blood fat concentration and the absorption spectrum at 278nm, as well as to es- tablish the BP nerve network model used for predicting blood fat concentration, supplying a new method for spectrum analysis of the blood detection. 2. NEURAL NETWORK STRUCTURE AND METHODS Figure 1 shows a widely applied BP neural network 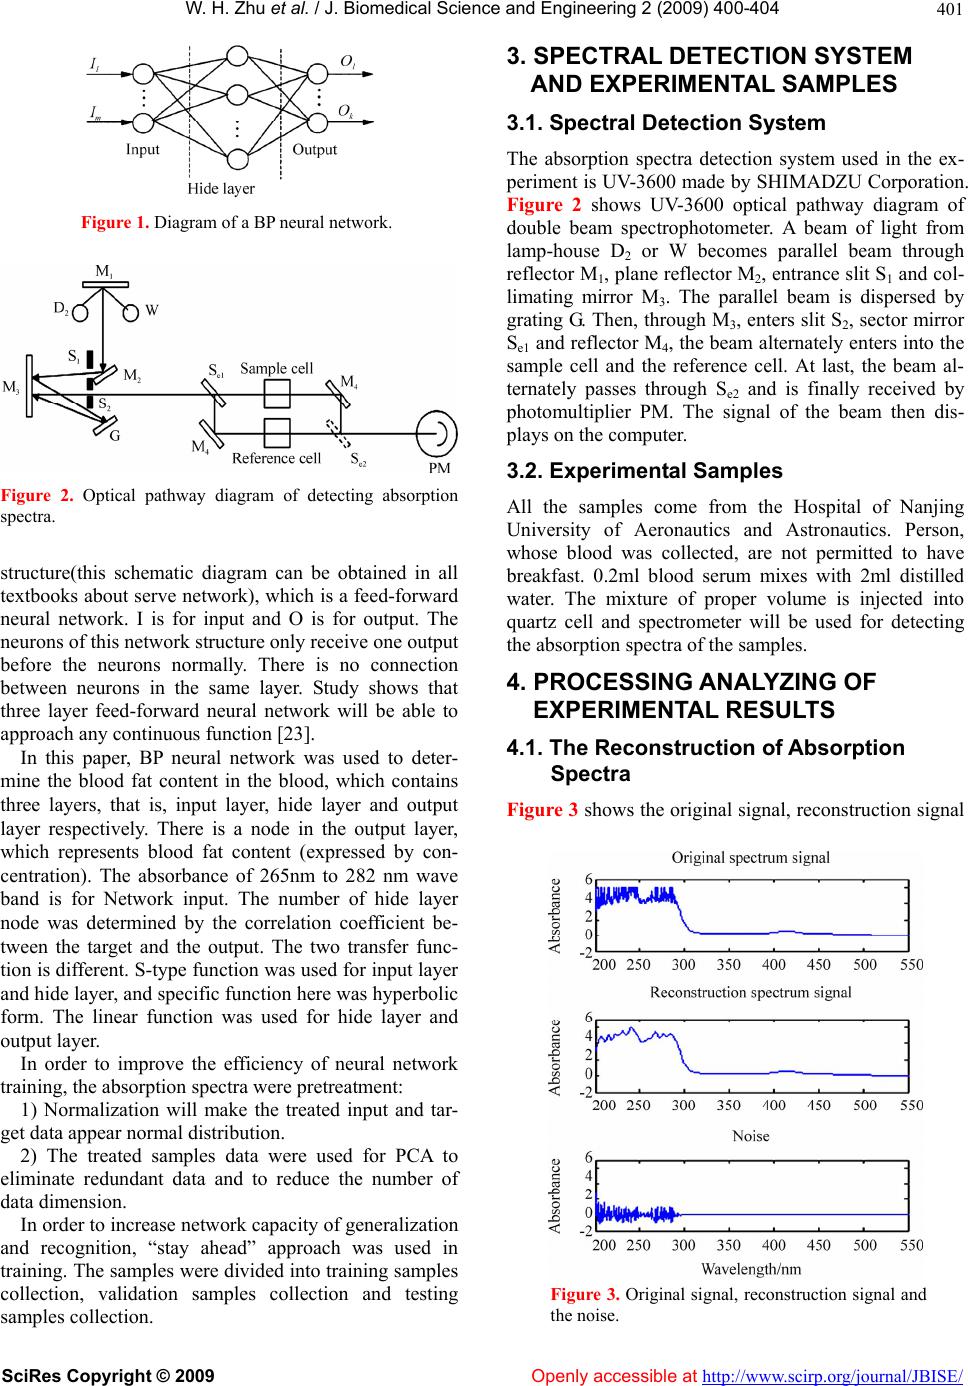 W. H. Zhu et al. / J. Biomedical Science and Engineering 2 (200 9) 400-404 SciRes Copyright © 2009 Openly accessible at http://www.scirp.org/journal/JBISE/ 401 Figure 1. Diagram of a BP neural network. Figure 2. Optical pathway diagram of detecting absorption spectra. structure(this schematic diagram can be obtained in all textbooks about serve network), which is a feed-forward neural network. I is for input and O is for output. The neurons of this network structure only receive one output before the neurons normally. There is no connection between neurons in the same layer. Study shows that three layer feed-forward neural network will be able to approach any continuous function [23]. In this paper, BP neural network was used to deter- mine the blood fat content in the blood, which contains three layers, that is, input layer, hide layer and output layer respectively. There is a node in the output layer, which represents blood fat content (expressed by con- centration). The absorbance of 265nm to 282 nm wave band is for Network input. The number of hide layer node was determined by the correlation coefficient be- tween the target and the output. The two transfer func- tion is different. S-type function was used for input layer and hide layer, and specific function here was hyperbolic form. The linear function was used for hide layer and output layer. In order to improve the efficiency of neural network training, the absorption spectra were pretreatment: 1) Normalization will make the treated input and tar- get data appear normal distribution. 2) The treated samples data were used for PCA to eliminate redundant data and to reduce the number of data dimension. In order to increase network capacity of generalization and recognition, “stay ahead” approach was used in training. The samples were divided into training samples collection, validation samples collection and testing samples collection. 3. SPECTRAL DETECTION SYSTEM AND EXPERIMENTAL SAMPLES 3.1. Spectral Detection System The absorption spectra detection system used in the ex- periment is UV-3600 made by SHIMADZU Corporation. Figure 2 shows UV-3600 optical pathway diagram of double beam spectrophotometer. A beam of light from lamp-house D2 or W becomes parallel beam through reflector M1, plane reflector M2, entrance slit S1 and col- limating mirror M3. The parallel beam is dispersed by grating G. Then, through M3, enters slit S2, sector mirror Se1 and reflector M4, the beam alternately enters into the sample cell and the reference cell. At last, the beam al- ternately passes through Se2 and is finally received by photomultiplier PM. The signal of the beam then dis- plays on the computer. 3.2. Experimental Samples All the samples come from the Hospital of Nanjing University of Aeronautics and Astronautics. Person, whose blood was collected, are not permitted to have breakfast. 0.2ml blood serum mixes with 2ml distilled water. The mixture of proper volume is injected into quartz cell and spectrometer will be used for detecting the absorption spectra of the samples. 4. PROCESSING ANALYZING OF EXPERIMENTAL RESULTS 4.1. The Reconstruction of Absorption Spectra Figure 3 shows the original sign al, reconstruction signal Figure 3. Original signal, reconstruction signal and the noise.  W. H. Zhu et al. / J. Biomedical Science and Engineering 2 (200 9) 400-404 SciRes Copyright © 2009 http://www.scirp.org/journal/JBISE/ 402 they found that the absorbance of these two different kinds serum are obvious different at 278nm, however, there are only three samples are studied, so none exact conclusions are obtained. Our paper will research the relation between absorbance and concentration of 45 samples at 278nm. The relationship is shown in Figure 5. The abscissa is blood fat content, and longitudinal coor- dinates is absorbance. and the noise of a sample by db4 wavelet transform (the signal filtering threshold was selected based on both rigrsure rules and the principle of stein unbiased likeli- hood estimate). It is discovered from Figure 3 that there is serious noise in the w ave band from 200nm to 30 0 nm in the original spectrum signal, which has an influence on analyzing useful information in the spectrum. The reconstruction signal between 200nm and 300nm be- comes clear, and some absorption peaks (such as 278nm) appear. Figure 3 shows that the noises mainly concen- trate on the wave band from 200nm to 300nm, and the values of the noises evenly distribute near zero, which is usually the characteristic of the noise. There is no noise in the wave band after 300nm, and it accords with the original spectrum. We can see from Figure 5 that the correlation between the absorbance and blood fat content is not obvious but random. It indicates the absorbance at 278 nm is synthe- sis of absorption of all kinds of components. When the blood fat content is in 0.5-1.0 mmol.L-1, many samples have the larger absorbance, mostly due to that other con- stituent’s absorbance is relatively larger. Therefore, for the actual blood, whether abnormal blood fat level can not be used to determine only considered the absorbance of some peaks (such as 278 nm) usually. Figure 4 shows the reconstruction signals of part dif- ferent samples in the wave band from 200nm to 300nm. It can be known from the Figure 4 that absorption spec- trum is of the following characteristics in th e wave band from 200nm to 300 nm: 1) The shape of the absorption spectrum is complex. There is more absorption peak, showing that there is a complex absorption phenomenon in blood group macromolecules. 2) The curve shapes of absorption spectra are similar to different samples, due to that the spectrum is synthesis of some group macro- molecules absorption spectrum. Therefore, the spectral distribution contains information such as the blood fat content. 3) The absorption peak of different samples displace to some degree. 4.3 Neural Network Prediction Fat Content As noted above, the absorbance is the synthesis of ab- sorbance of all kinds of components. There is informa- tion of many elements at any wavelength. Therefore, the spectral distribution contains much information such as the blood fat content. In this paper, the neural network model based on a certain absorption spectra was used to obtain information of the blood fat contents. When the range of wavelength variation is changed, the correlation coefficient between the predictive value and target value for the blood concentration will vary. Therefore, we can choose suitable model based on the correlation coeffi- cient. It is known from the calculation that a good net- work forecast model can be found when the spectrum data of 265 to 282 nm is used for network input. 4.2. Relationship between Absorbance of 278nm and Blood Fat Concentration Zhao et al. [22] have reported the ultraviolet absorption spectrum of normal and abnormal serum respectively, 220 225 230 235 240 245 250 255 260 265 270 275 280 285 290 295 300 2.5 3.0 3.5 4.0 4.5 5.0 5.5 6.0 6.5 Absorbance Wavelength/nm C H F E D I J K L M N O P Q Figure 4. The reconstruction signals of part different samples. Openly accessible at  W. H. Zhu et al. / J. Biomedical Science and Engineering 2 (200 9) 400-404 SciRes Copyright © 2009 Openly accessible at http://www.scirp.org/journal/JBISE/ 403 Figure 5. The relationship between absorbance of 278nm and blood fat content Figure 6. Error training curves. Figure 6 shows the network training error curves, where the abscissa being the training number and longi- tudinal coordinate co rresp ondin g to MSE. Th e valid ation error is basic agreement with testing error’s trend, indi- cating the samples division is reasonable. Network training first stop at step 6, which is because that the testing error becoming larger. Training errors is rela- tively satisfying from the training curve error. Figure 7 is the regression analysis result of network output blood fat content. The correlation coefficient be- tween predicted blood fat content output A and objec- tives T reaches 0.928, it can be regarded as a better pre- diction. It also shows that the blood fat content informa- tion is implicit in absorption spectrum and neural net- work provides an effective means to access spectral in- formation. Figure 7. Regression analysis result of network output (A) blood fat content. 5. CONCLUSIONS Db4 wavelet has preferable transformation character when it is used to analyze absorption spectra of blood. The signals of reconstruction are obviously improved in the noise serious wave band, reflecting some useful in- formation. The ultraviolet absorption spectrum of serum is com- plex. There is more absorption peak from 200to 300nm, showing that there is a complex ultraviolet absorption phenomenon in blood group macromolecules. The ab- sorption spectru m is the synthesis result of blood fat and other components spectrum, and the information is con- tained at each wavelength. Therefore, blood fat content and other information are contained in the spectral dis- tribution, which is the basis of blood testing based on spectra analysis. The absorption peaks of different sam- ples are displaced to some degrees. There is no significant correlation between absorbance at 278nm and blood fat concentration. Based on the evi- dent correlation between serum absorption spectrum and blood fat concentration in the wave band of 265 to 282nm, a neural network model was built to forecast the blood fat concentration, resulting a relatively good pre- diction. 6. ACKNOWLEDGEMENTS This study was supported by research funds from the National Natural Science Foundation of China (NO.10172043), the Scientific Research and Innovation Fund (NO.1008905704), the Science Foundation of Hohai University (NO. 2008430311), and the International Science and Technology Cooperation Program (NO. BZ2008060).  W. H. Zhu et al. / J. Biomedical Science and Engineering 2 (200 9) 400-404 SciRes Copyright © 2009 Openly accessible at http://www.scirp.org/journal/JBISE/ 404 REFERENCES [1] Z. Shun, (2004) Nanjing Daly. [2] L. X. Wang, Z. M. Zhao, H. B. Yao, et al, (2002) Infrard absorption spectrum analysis and its application to blood, Spectroscopy and Spectral Analysis, 22(6), 980–982. [3] Z. M. Zhao, Y. M. Chen, and X. L. Yu, (2003) Character- istic analysis and application of blood fluorescence spec- tra, Spectroscopy and Spectral Analysis, 23(5), 922–925. [4] Z. M. Zhao, L. F. Guo, X. L. Yu, et al, (2005) Analysis and application of excitation fluorescence intensity of blood, Spectroscopy and Spectral Analy sis, 25(12), 2056– 2060. [5] X. F. Lan, J. G. Liu, Y. Liu, et al, (2006) Spectroscopy research on cholesterol in hypercholesterolemia serum, Spectroscopy and Spectral Analysis, 26(13), 467–470. [6] C. Q. Yu, F. G. Liu, Y. Gu, et al, (2004) Laser induced fluorescence spectra of human skin and blood, Chin. J. Laser. Med. Surg., 13, 41–444. [7] J. D. Li, J. H. Ding, M. Wu, et al, (2006) Diagnosis of hepatocirrhosis by fluorescence spectrum of serum, AP- PLIED LASER, 24(2), 112–114. [8] J. W. Men, R. E. Zheng, Y. D. Zhang, et al, (2003) Can- cer detection by serum fluorescence analysis: A pectro- scopic study, Chin. J. Laser. Me d. Surg., 1(1), 43–47. [9] X. H. Ge, Y. L. Zhao, F. Q. Zhang, et al, (2007) Effect of cancer cells on the spectra of serums, Spectroscopy and Spectral Analysis, 24(7), 841–843. [10] X. F. Shi, J. Ma, W. Z. Mao, et al, (2006) Applying pa- tial least squares discriminant analysis on autofluores- cence spectra to identify gastric cancer, Spectroscopy and Spectral Analysis, 26(2), 295–298. [11] D. Rohleder, G. Kocherscheidt, and K. Gerber, (2005) Comparison of mid-infrared and Raman spectroscopy in the quantitative analysis of serum, J. Biomedical Optics. 10(3), 1–10. [12] Runger and M. Thomas, (2007) How different wave- lengths of the ultraviolet spectrum contribute to skin car- cinogenesis: The role of cellular damage responses, J. Invest Dermatol, 127(9), 2103–2105. [13] G. C. Tang, (1989) Pulsed and CW laser fluorescence from cancerous, normal and chemically treated normal human heart and lung tissues, Applied Optics, 28(12), 2337–2343. [14] S. Rochkind, M. Nissan, M. Alon, et al, (2001) Effects of laser irradiation on the spinal cord for the regeneration of crushed peripheral nerve in rats, Laser in Surgery Medi- cine, 28(3), 216–219. [15] M. Gniadecka, H. C. Wulf, O. F. Nielsen, et al, (1997) Distinctive molecular abnormalities in benign and ma- lignant skin lesion: Studies by Raman spectroscopy, Photochem Photobiol, 66, 418–423. [16] S. P. Qin, J. H. Ding, and J. D. Li, (2006) Research on fluorescence spectra of liver pathological serum of mice with wavelet transforms method, Journal of Optoelec- tronics Laser, 17(5), 634–637. [17] Y. T. Wang and Y. C. Li, (2006) Application of wavelet threshold denoising method in the fluorescence analysis of pesticides, Journal of Applied Optics, 27(3), 192–194. [18] D. T. Li, C. J. Zhang, and J. Wang, Application of wave- let transform to infrared analysis, Spectroscopy and Spectral Analysis, 26(11), 2024–2026. [19] Y. F. Tang, Z. Y. Zhang, G. Q. Fan, et al, (2005) Identifi- cation of official rhubarb samples based on IR spectra and neural networks, Spectroscopy and Spectral Analysis, 25(5), 715–278. [20] G. H. Wu, C. Y. He, and R. Chen, (2002) Application of artificial neural network to simultaneous spectro-fluori- metric determination of phenol and resorcinol, Spectros- copy and Spectral Analysis, 22(5), 813–815. [21] Y. Z. Han, Y. X. Zhang, S. J. Chang, et al, (2005) Recog- nition for the noninear fluorescence spectra based on op- timal wavelet transform and artificial neural network, Journal of Optoelectronics and Laser, 16(6), 719–721. [22] Z. M. Zhao, Y. J. Xin, L. X. Wang, et al, (2008) Meas- urement and analysis of absorption spectrum of human blood, Spectroscopy and Spectral Analysis, 28(1), 138– 140. [23] J. E. Meng, (2002) Face recognition with radial function (RBF) neural networks, IEEE Transaction on Neural Network, 13(3), 15–17. |