

Paper Menu >>
Journal Menu >>
 Vol.3, No.10, 647-655 (2011) doi:10.4236/health.2011.310109 C opyright © 2011 SciRes. Openly accessible at http://www.scirp.org/journal/HEALTH/ Health Nutritional status of children in rural India: a case study from Tamil Nadu, first in the world to initiate the Mid-Day Meal scheme Palanisamy Navaneethan1,2, Thiagarajan Kalaivani1, Chandrasekaran Rajasekaran1*, Nautiyal Sunil2 1Division of Plant Biotechnology, School of Bio Sciences and Technology, VIT University, Vellore, Tamil Nadu, India; *Corresponding author: [email protected] 2Centre for Ecological Economics and Natural Resources, Institute for Social and Economic Change, Bangalore, India Received 5 January 2011; revised 16 February 2011; accepted 20 March 2011. ABSTRACT In India, during the mid-nineties the Union Gov- ernment had initiated the Mid-Day Meal sche- mes in schools to promote primary education on one hand, and to reduce malnutrition on the other. However, Tamil Nadu had launched this program several decades before; during the regime of Mr. Kumarasami Kamraj (1954-1963). An empirical study was undertaken in the rural areas of Tamil Nadu, in the south of India, to understand the nutritional status of the children between 11 and 18 years old. This group is vul- nerable, as during this age, individuals undergo physical and mental changes. We calculated the Body Mass Index (BMI) of school children to assess their nutritional status. A total of 806 sc- hool children took part in this study and the majority of them were found to be underweight in the study region. Irrespective of their age gr- oup and sex, as per the WHO’s international standards, 83% of the students were underwei- ght (BMI < 18.5). Only 16% of the students w ere in the normal range (BMI 18.5 - 24.9), and of the rest, 0.39% and 0.06% were in the BMI range of 25 - 29.9 (overweight) and 30 - 35.9 (obese), res- pectively. Based on available data, a regression analysis was carried out. This regression model showed that students’ age, sex and father’s occupation significantly affects their BMI. Fur- ther analysis showed that BMI w as independent of the students’ blood group. It was concluded that malnutrition among school children can be eliminated by providing additional healthy foods and by improving the Socio Economic Back- ground (SE B) of the region. Keywords: BMI (Body Mass Index); Underweight; Regression Analysis; Fathers’ Occupation; SEB (Socio Economic Background) 1. INTRODUCTION Humans have been haunted by diseases from time immemorial. The current trend of food consumption and urbanization has led to many complications in diagnos- ing diseases. On one side, there are increased cases of obesity and on the other, there is malnutrition (under- weight). This paradox is very common in developing countries and is found to increase proportionally with time [1,2]. In India alone there are approximately 60 million children who are underweight [3], and the prevalence is higher in rural areas compared to urban areas [4]. The number of malnourished children in India is among the highest in the world and is twice than that of the sub-Saharan region [5]. The condition of being underweight may have resulted from a) low dietary in- take b) excessive work out c) chronic infections [6]. Even though many methods are available to study the nutritional status of an individual, anthropometry is con- sidered as a good tool, especially to study the malnutrition of individuals [7,8]. Within anthropometry, some studies suggest the skin fold measures or waist/hip/arm circum- ferences as an indicator of malnutrition, while others sug- gest using the Body Mass Index (BMI) [8,9]. For our study we used BMI as a measure to study the malnour- ishment in children. We have four reasons for choosing this method: 1) simple procedure 2) no technical compli- cations 3) inexpensive 4) can be used to study large popu- lations. In fact, many researchers favored the application of BMI in the nutritional assessment of individuals [10,11]. One can foresee the development of clinical diseases with the help of BMI [12]. BMI has a direct relationship with body fat [13] and some researchers 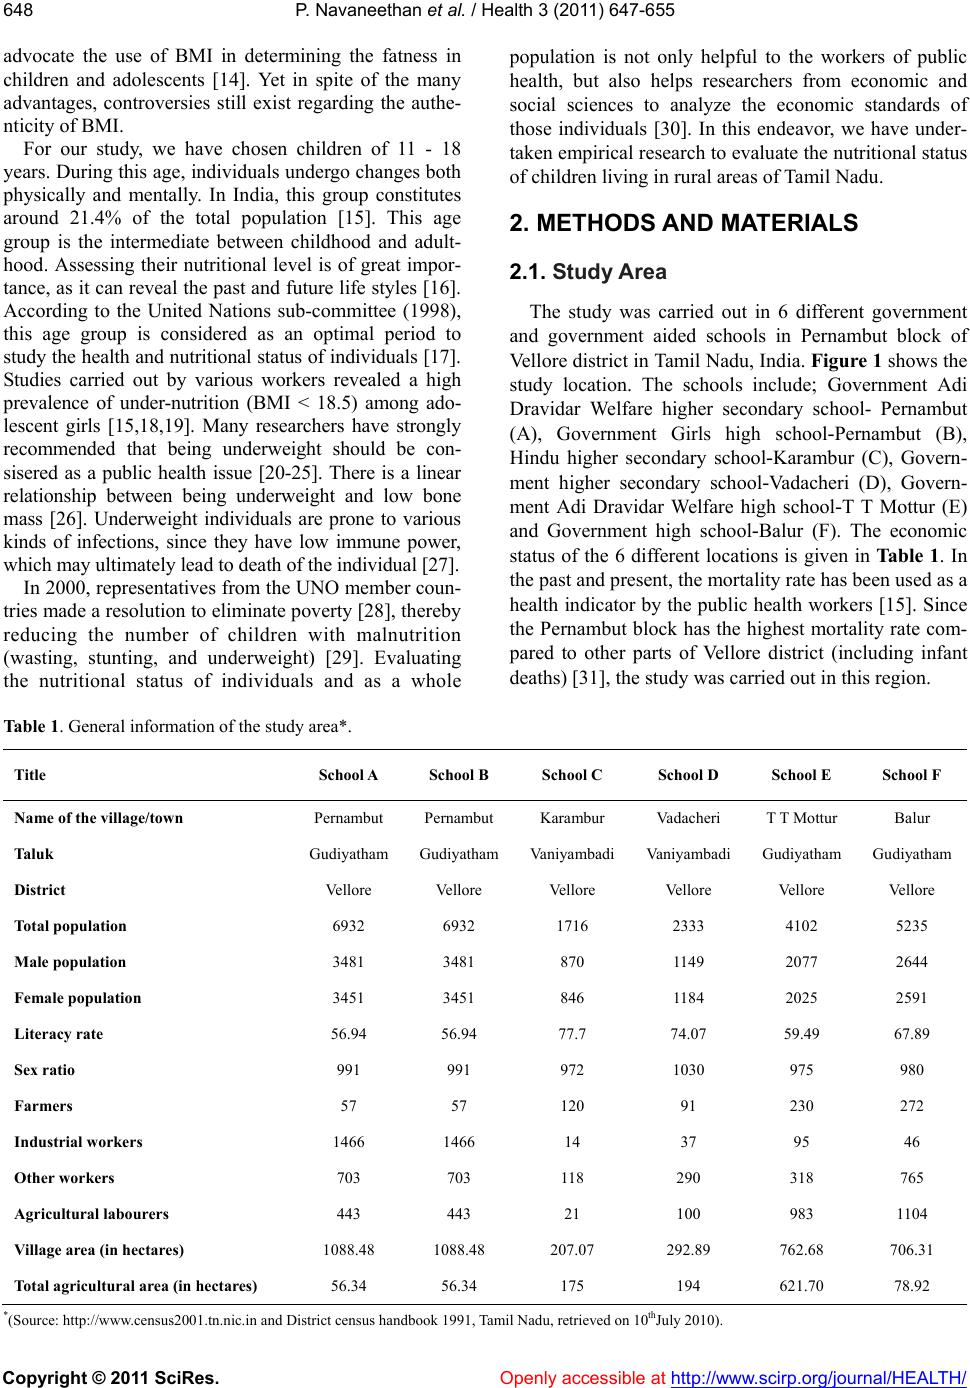 P. Navaneethan et al. / Health 3 (2011) 647-655 Copyright © 2011 SciRes. Openly accessible at http://www.scirp.org/journal/HEALTH/ 648 advocate the use of BMI in determining the fatness in children and adolescents [14]. Yet in spite of the many advantages, controversies still exist regarding the authe- nticity of BMI. For our study, we have chosen children of 11 - 18 years. During this age, individuals undergo changes both physically and mentally. In India, this group constitutes around 21.4% of the total population [15]. This age group is the intermediate between childhood and adult- hood. Assessing their nutritional level is of great impor- tance, as it can reveal the past and future life styles [16]. According to the United Nations sub-committee (1998), this age group is considered as an optimal period to study the health and nutritio nal status of individua ls [17]. Studies carried out by various workers revealed a high prevalence of under-nutrition (BMI < 18.5) among ado- lescent girls [15,18,19]. Many researchers have strongly recommended that being underweight should be con- sisered as a public health issue [20-25]. There is a linear relationship between being underweight and low bone mass [26]. Underweight individuals are prone to various kinds of infections, since they have low immune power, which ma y ult im a tely l ead t o deat h of t he individual [27]. In 2000, representatives fro m th e UN O me mb er co un- tries made a resolution to eliminate poverty [28], thereb y reducing the number of children with malnutrition (wasting, stunting, and underweight) [29]. Evaluating the nutritional status of individuals and as a whole population is not only helpful to the workers of public health, but also helps researchers from economic and social sciences to analyze the economic standards of those individuals [30]. In this endeavor, we have under- taken empirical research to evaluate the nutritional status of children living in rural areas of Tamil Nadu. 2. METHODS AND MATERIALS 2.1. Stu dy Area The study was carried out in 6 different government and government aided schools in Pernambut block of Vello re district in Tamil Nadu, India. Figure 1 shows th e study location. The schools include; Government Adi Dravidar Welfare higher secondary school- Pernambut (A), Government Girls high school-Pernambut (B), Hindu higher secondary school-Karambur (C), Govern- ment higher secondary school-Vadacheri (D), Govern- ment Adi Dravidar Welfare high school-T T Mottur (E) and Government high school-Balur (F). The economic status of the 6 different locations is given in Tabl e 1. In the past and present, the mortality rate has been used as a health indicator by the public health workers [15]. Since the Pernambut block has the highest mortality rate com- pared to other parts of Vellore district (including infant deaths) [31], the study was carried out in this region. Table 1. General information of the study area*. Title School A School B School C School D School E School F Name of the village/town Pernambut Pernambut Karambur Vadacheri T T Mottur Balur Taluk GudiyathamGudiyathamVaniyambadi Vaniyambadi Gudiyatham Gudiyatham District Vellore Vellore Vellore Vellore Vellore Vellore Total population 6932 6932 1716 2333 4102 5235 Male population 3481 3481 870 1149 2077 2644 Female population 3451 3451 846 1184 2025 2591 Literacy rate 56.94 56.94 77.7 74.07 59.49 67.89 Sex ratio 991 991 972 1030 975 980 Farmers 57 57 120 91 230 272 Industrial workers 1466 1466 14 37 95 46 Other workers 703 703 118 290 318 765 Agricultural labourers 443 443 21 100 983 1104 Village area (in hectares) 1088.48 1088.48 207.07 292.89 762.68 706.31 Total agricultural area (i n hectares) 56.34 56.34 175 194 621.70 78.92 *(Source: http://www.census2001.tn.nic.in and District census handbook 1991, Tamil Nadu, retrieved on 10thJuly 2010). 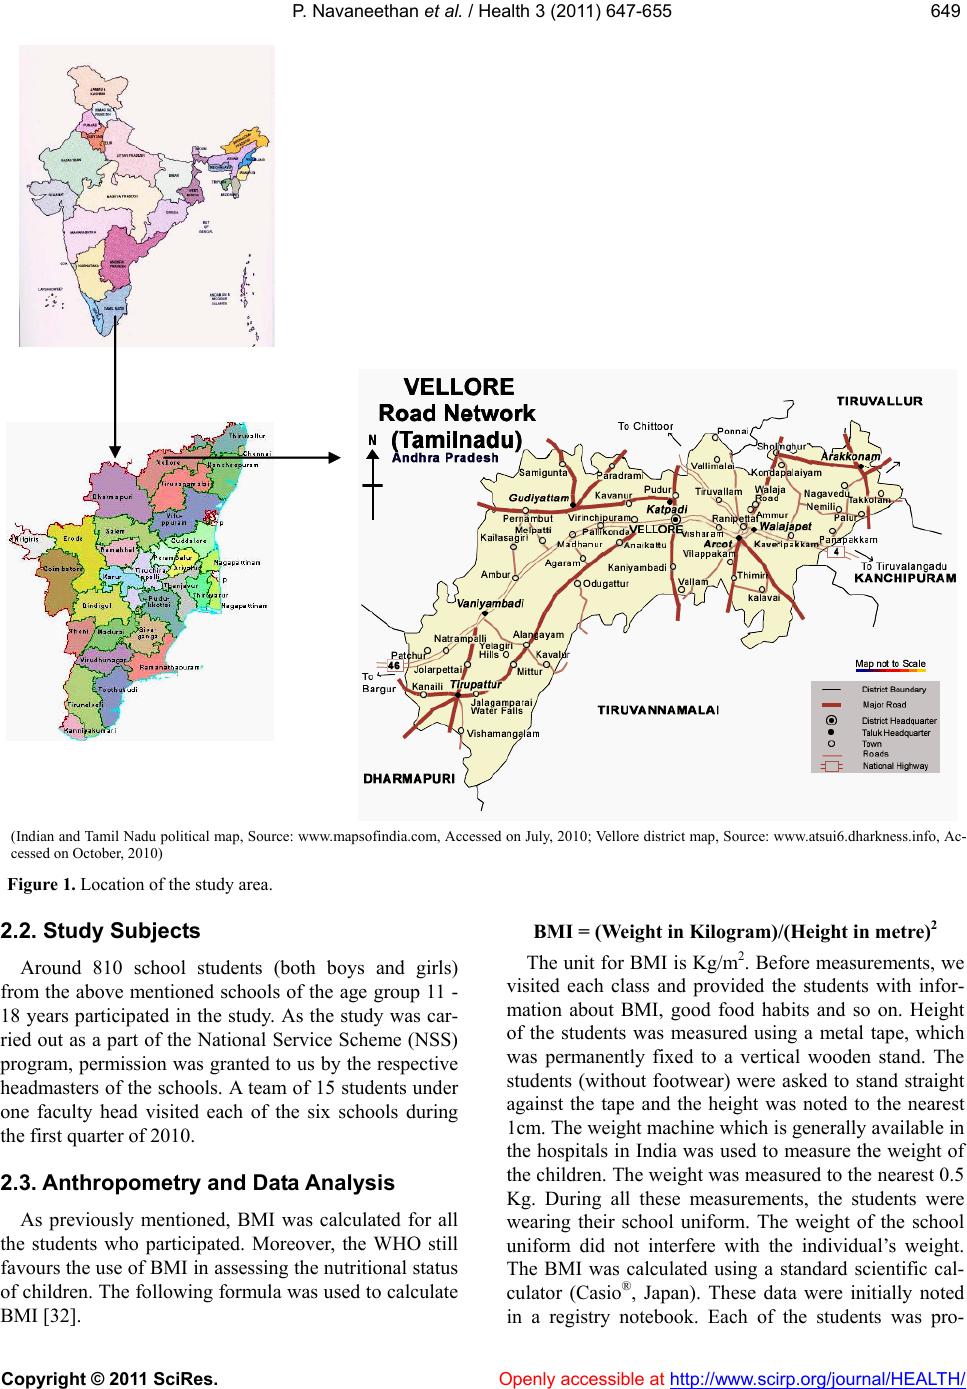 P. Navaneethan et al. / Health 3 (2011) 647-655 Copyright © 2011 SciRes. Openly accessible at http://www.scirp.org/journal/HEALTH/ 649649 (Indian and Tamil Nadu political map, Source: www.mapsofindia.com, Accessed on July, 2010; Vellore district map, Source: www.atsui6.dharkness.info, Ac- cessed on October, 2010) Figure 1. Location of the study area. 2.2. Stud y Subjects Around 810 school students (both boys and girls) from the above mentioned schools of the age group 11 - 18 years participated in the study. As the study was car- ried out as a part of the National Service Scheme (NSS) program, permission was granted to us by the respective headmasters of the schools. A team of 15 stud ents under one faculty head visited each of the six schools during the first quarter of 2010. 2.3. Anthropometry and Data Analysis As previously mentioned, BMI was calculated for all the students who participated. Moreover, the WHO still favours the use of BMI in assessing the nutritional status of children. The following formula was used to calculate BMI [32]. BMI = (Weight in Kilogram)/(Height in metre)2 The unit for BMI is Kg/m2. Before measurements, we visited each class and provided the students with infor- mation about BMI, good food habits and so on. Height of the students was measured using a metal tape, which was permanently fixed to a vertical wooden stand. The students (without footwear) were asked to stand straight against the tape and the height was noted to the nearest 1cm. The weight machine which is generally available in the hospitals in India was used to measure the weight of the children. The weight was measured to the nearest 0.5 Kg. During all these measurements, the students were wearing their school uniform. The weight of the school uniform did not interfere with the individual’s weight. The BMI was calculated using a standard scientific cal- culator (Casio®, Japan). These data were initially noted in a registry notebook. Each of the students was pro- 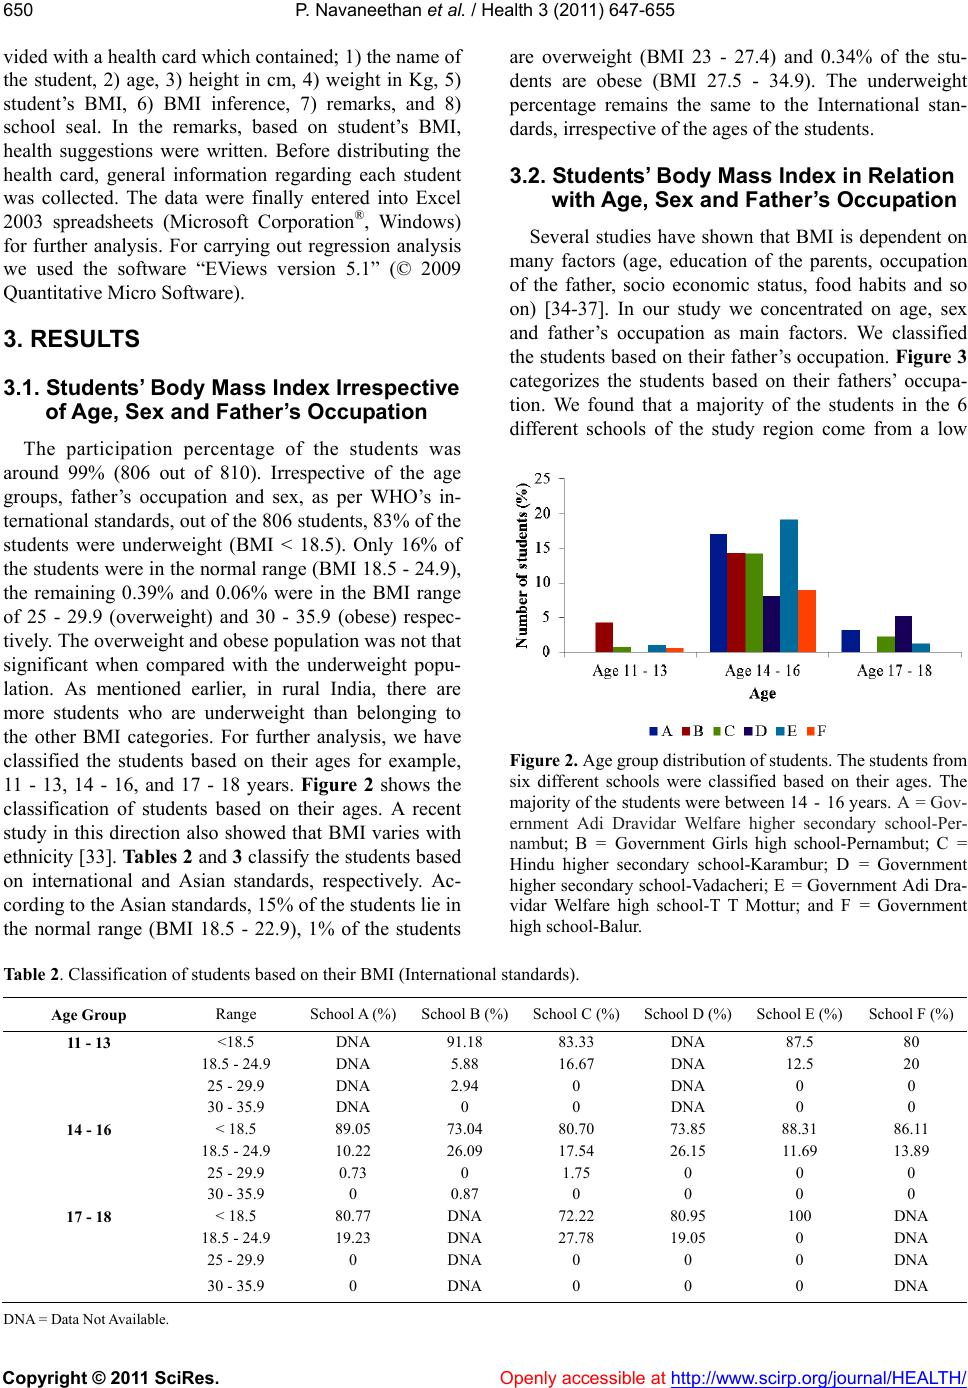 P. Navaneethan et al. / Health 3 (2011) 647-655 Copyright © 2011 SciRes. Openly accessible at http://www.scirp.org/journal/HEALTH/ 650 vided with a health card which contained; 1) the name of the student, 2) age, 3) height in cm, 4) weight in Kg, 5) student’s BMI, 6) BMI inference, 7) remarks, and 8) school seal. In the remarks, based on student’s BMI, health suggestions were written. Before distributing the health card, general information regarding each student was collected. The data were finally entered into Excel 2003 spreadsheets (Microsoft Corporation®, Windows) for further analysis. For carrying out regression analysis we used the software “EViews version 5.1” (© 2009 Quantitative Micro Software). 3. RESULTS 3.1. Students’ Body Mass Index Irrespective of Age, Sex and Father’s Occupation The participation percentage of the students was around 99% (806 out of 810). Irrespective of the age groups, father’s occupation and sex, as per WHO’s in- ternational stand ards, out of the 806 students, 83% of the students were underweight (BMI < 18.5). Only 16% of the students were in the normal range (BMI 18.5 - 24.9), the remaining 0.39% and 0.06% were in the BMI range of 25 - 29.9 (overweight) and 30 - 35.9 (obese) respec- tively. The overweight and obese population was not that significant when compared with the underweight popu- lation. As mentioned earlier, in rural India, there are more students who are underweight than belonging to the other BMI categories. For further analysis, we have classified the students based on their ages for example, 11 - 13, 14 - 16, and 17 - 18 years. Figure 2 shows the classification of students based on their ages. A recent study in this direction also showed that BMI varies with ethnicity [33]. Tables 2 and 3 classify the students based on international and Asian standards, respectively. Ac- cording to the Asian standards, 15% of th e stud en ts lie in the normal range (BMI 18.5 - 22.9), 1% of the students are overweight (BMI 23 - 27.4) and 0.34% of the stu- dents are obese (BMI 27.5 - 34.9). The underweight percentage remains the same to the International stan- dards, irrespective of the ages of the students. 3.2. Students’ Body Mass Index in Relation with Age, Sex and Father ’s Occupation Several studies have shown that BMI is dependent on many factors (age, education of the parents, occupation of the father, socio economic status, food habits and so on) [34-37]. In our study we concentrated on age, sex and father’s occupation as main factors. We classified the students based on their father’s occupation. Figure 3 categorizes the students based on their fathers’ occupa- tion. We found that a majority of the students in the 6 different schools of the study region come from a low Figure 2. Age g roup distrib ution of stud ents. The students from six different schools were classified based on their ages. The majority of the students were between 14 - 16 years. A = Gov- ernment Adi Dravidar Welfare higher secondary school-Per- nambut; B = Government Girls high school-Pernambut; C = Hindu higher secondary school-Karambur; D = Government higher secondary school-Vadacheri; E = Government Adi Dra- vidar Welfare high school-T T Mottur; and F = Government high school-Balur. Table 2. Classification of students based on their BMI (International standards). Age Group Range School A (%)School B (%)School C (%)School D (%) S c ho ol E (%) School F (%) 11 - 13 <18.5 DNA 91.18 83.33 DNA 87.5 80 18.5 - 24.9 DNA 5.88 16.67 DNA 12.5 20 25 - 29.9 DNA 2.94 0 DNA 0 0 30 - 35.9 DNA 0 0 DNA 0 0 14 - 16 < 18.5 89.05 73.04 80.70 73.85 88.31 86.11 18.5 - 24.9 10.22 26.09 17.54 26.15 11.69 13.89 25 - 29.9 0.73 0 1.75 0 0 0 30 - 35.9 0 0.87 0 0 0 0 17 - 18 < 18.5 80.77 DNA 72.22 80.95 100 DNA 18.5 - 24.9 19.23 DNA 27.78 19.05 0 DNA 25 - 29.9 0 DNA 0 0 0 DNA 30 - 35.9 0 DNA 0 0 0 DNA DNA = Data Not Available. 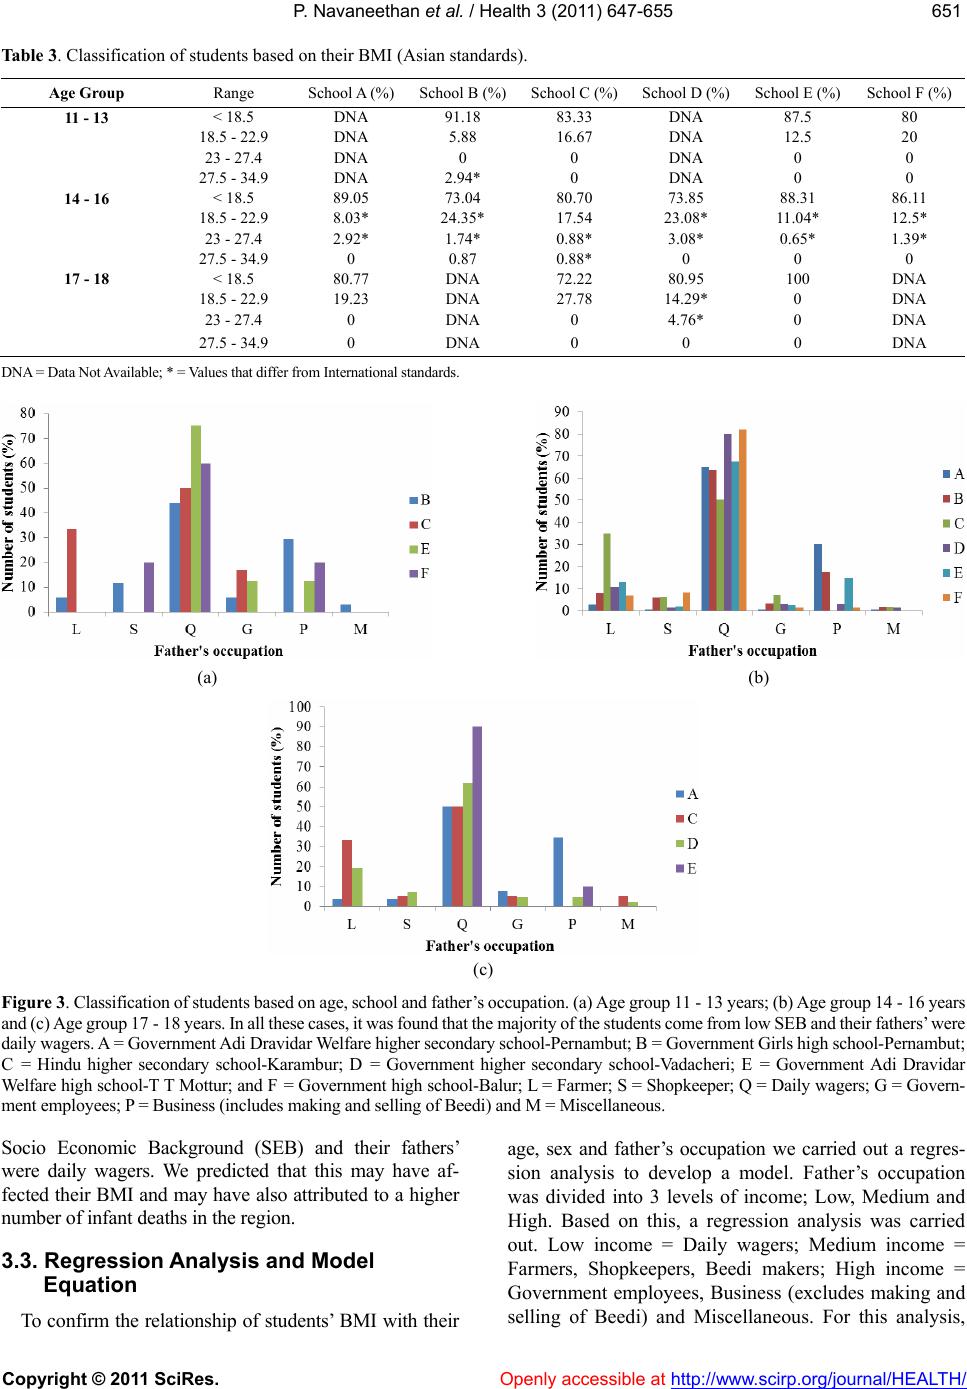 P. Navaneethan et al. / Health 3 (2011) 647-655 Copyright © 2011 SciRes. Openly accessible at http://www.scirp.org/journal/HEALTH/ 651651 Table 3. Classification of students based on their BMI (Asian standards). Age Group Range School A (%)School B (%)School C ( % )School D (%) School E (%) School F (%) 11 - 13 < 18.5 DNA 91.18 83.33 DNA 87.5 80 18.5 - 22.9 DNA 5.88 16. 67 DNA 12.5 20 23 - 27.4 DNA 0 0 DNA 0 0 27.5 - 34.9 DNA 2.94* 0 DNA 0 0 14 - 16 < 18.5 89.05 73.04 80.70 73.85 88.31 86.11 18.5 - 22.9 8.03* 24.35* 17.54 23.08* 11.04* 12.5* 23 - 27.4 2.92* 1.74* 0.88* 3.08* 0.65* 1.39* 27.5 - 34.9 0 0.87 0.88* 0 0 0 17 - 18 < 18.5 80.77 DNA 72.22 80.95 100 DNA 18.5 - 22.9 19.23 DNA 27.78 14.29* 0 DNA 23 - 27.4 0 DNA 0 4.76* 0 DNA 27.5 - 34.9 0 DNA 0 0 0 DNA DNA = Data Not Available; * = Values that dif fer from International standards. (a) (b) (c) Figure 3. Classification of students based on age, school and father’ s occupation. (a) Age group 1 1 - 13 years; (b) Age group 14 - 16 years and (c) Age group 17 - 18 years. In all these cases, it was found that the majority of the students come from low SEB and their fathers’ were daily wagers. A = Government Adi Dravidar Welfare higher secondary school-Pernambut; B = Government Girls high school-Pernambut; C = Hindu higher secondary school-Karambur; D = Government higher secondary school-Vadacheri; E = Government Adi Dravidar Welfare high school-T T Mottur; and F = Govern ment high school -Balur; L = Farmer; S = Shopkeeper; Q = Daily wagers; G = Govern- ment employees; P = Business (includes making and selling of Beedi) and M = Miscellaneous. Socio Economic Background (SEB) and their fathers’ were daily wagers. We predicted that this may have af- fected their BMI and may have also attributed to a higher number of infant deat hs in the region. 3.3. Regression Analysis and Model Equation To confirm the relationship of students’ BMI with their age, sex and father’s occupation we carried out a regres- sion analysis to develop a model. Father’s occupation was divided into 3 levels of income; Low, Medium and High. Based on this, a regression analysis was carried out. Low income = Daily wagers; Medium income = Farmers, Shopkeepers, Beedi makers; High income = Government employees, Business (excludes making and selling of Beedi) and Miscellaneous. For this analysis, 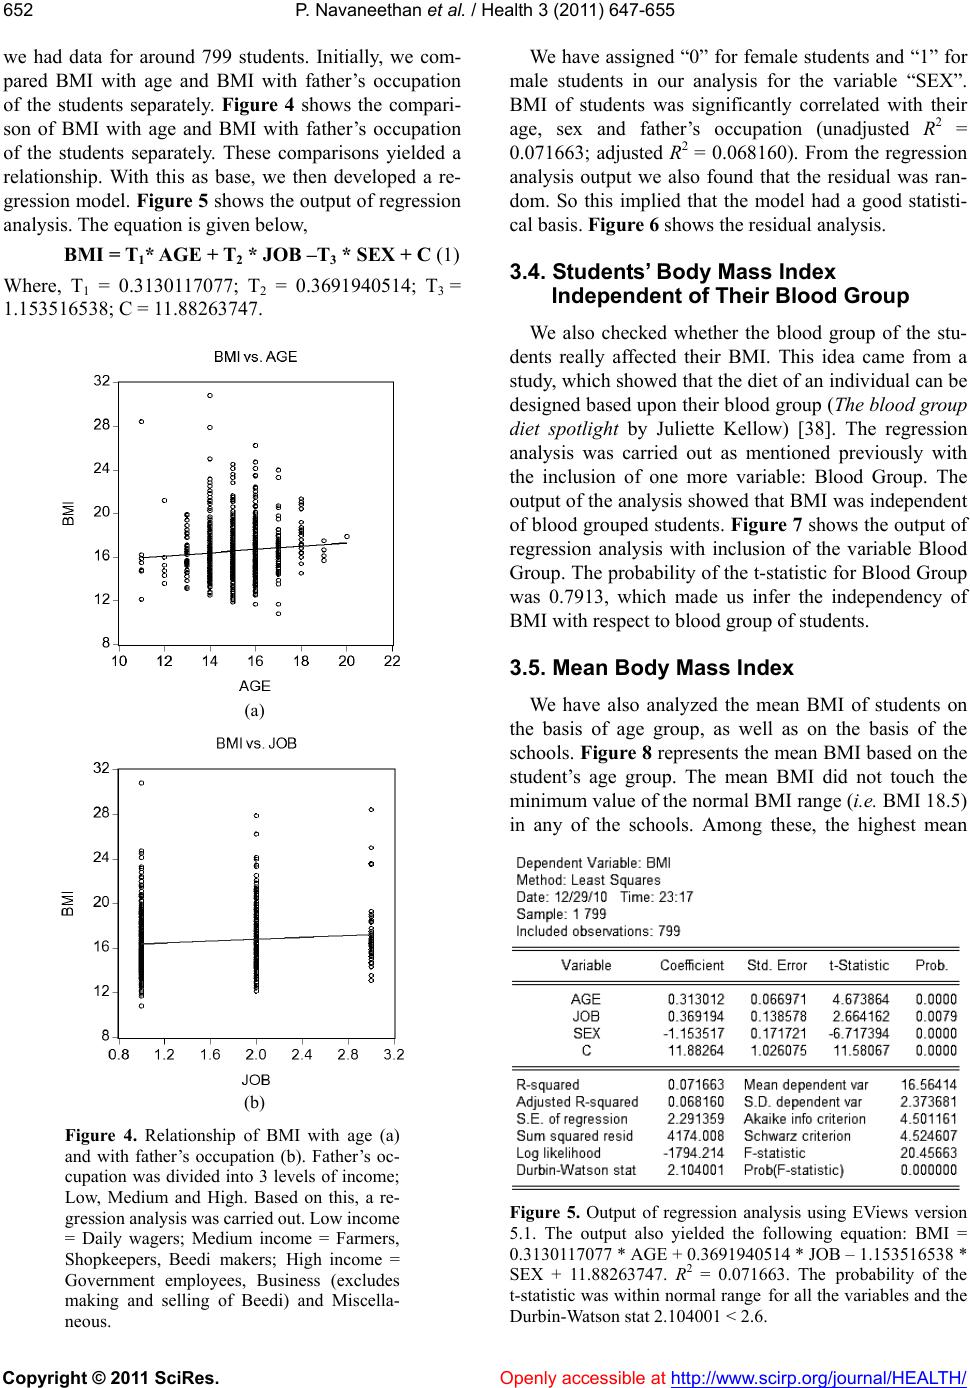 P. Navaneethan et al. / Health 3 (2011) 647-655 Copyright © 2011 SciRes. Openly accessible at http://www.scirp.org/journal/HEALTH/ 652 we had data for around 799 students. Initially, we com- pared BMI with age and BMI with father’s occupation of the students separately. Figure 4 shows the compari- son of BMI with age and BMI with father’s occupation of the students separately. These comparisons yielded a relationship. With this as base, we then developed a re- gression model. Figure 5 show s the output of regression analysis. The equation is given below, BMI = T1* AGE + T2 * JOB –T3 * SEX + C (1) Where, T1 = 0.3130117077; T2 = 0.3691940514; T3 = 1.153516538; C = 11.88263 747. (a) (b) Figure 4. Relationship of BMI with age (a) and with father’s occupation (b). Father’s oc- cupation was divided into 3 levels of income; Low, Medium and High. Based on this, a re- gression analy sis was carri ed out. Low in com e = Daily wagers; Medium income = Farmers, Shopkeepers, Beedi makers; High income = Government employees, Business (excludes making and selling of Beedi) and Miscella- neous. We have assigned “0” for female students and “1” for male students in our analysis for the variable “SEX”. BMI of students was significantly correlated with their age, sex and father’s occupation (unadjusted R2 = 0.071663; adjusted R2 = 0.068160). From the regression analysis output we also found that the residual was ran- dom. So this implied that the model had a good statisti- cal basis. Figure 6 shows the residual analysis. 3.4. Students’ Body Mass Index Independent of Their Blood Group We also checked whether the blood group of the stu- dents really affected their BMI. This idea came from a study, which showed that the diet of an individual can be designed b ased upon their b lood group (The b lood group diet spotlight by Juliette Kellow) [38]. The regression analysis was carried out as mentioned previously with the inclusion of one more variable: Blood Group. The output of the analysis showed that BMI was independent of blood grouped students. Figure 7 show s the output of regression analysis with inclusion of the variable Blood Group. The probability of the t-statistic for Blood Group was 0.7913, which made us infer the independency of BMI with respect to blood group of students. 3.5. Mean Body Mass Index We have also analyzed the mean BMI of students on the basis of age group, as well as on the basis of the schools. Figure 8 represents the mean BMI based on the student’s age group. The mean BMI did not touch the minimum value of the normal BMI range (i.e. BMI 18.5) in any of the schools. Among these, the highest mean Figure 5. Output of regression analysis using EViews version 5.1. The output also yielded the following equation: BMI = 0.3130117077 * AGE + 0.3691940514 * JOB – 1.153516538 * SEX + 11.88263747. R2 = 0.071663. The probability of the t-statistic was within normal range for all the variables and the Durbin-Watson stat 2.104001 < 2.6. 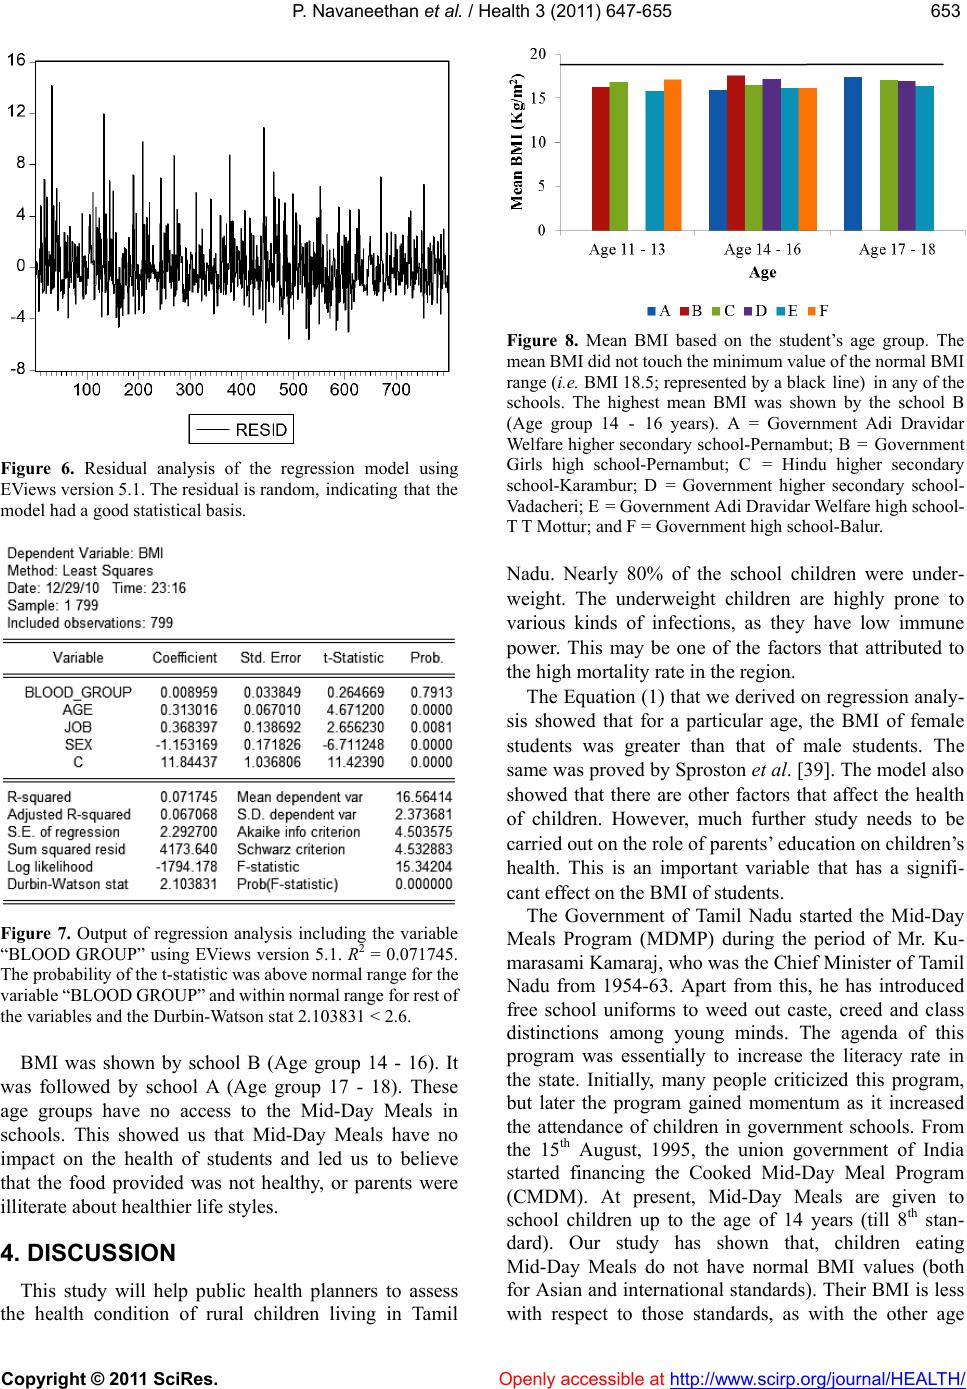 P. Navaneethan et al. / Health 3 (2011) 647-655 Copyright © 2011 SciRes. Openly accessible at http://www.scirp.org/journal/HEALTH/ 653653 Figure 6. Residual analysis of the regression model using EViews version 5.1. The residual is random, indicating that the model had a good statistical basis. Figure 7. Output of regression analysis including the variable “BLOOD GROUP” using EViews version 5.1. R2 = 0.071745. The probability of th e t-stat istic was abov e no rm al r ange for th e variable “BLOOD GROUP” and within normal range for rest of the variables and the Durbin-Watson stat 2.103831 < 2.6. BMI was shown by school B (Age group 14 - 16). It was followed by school A (Age group 17 - 18). These age groups have no access to the Mid-Day Meals in schools. This showed us that Mid-Day Meals have no impact on the health of students and led us to believe that the food provided was not healthy, or parents were illiterate about healthier life styles. 4. DISCUSSION This study will help public health planners to assess the health condition of rural children living in Tamil Figure 8. Mean BMI based on the student’s age group. The mean BMI did not touch the minimum value of the normal BMI range (i.e. BMI 18.5; represented by a black line) in any of the schools. The highest mean BMI was shown by the school B (Age group 14 - 16 years). A = Government Adi Dravidar Welfare higher secondary school-Pernambut; B = Government Girls high school-Pernambut; C = Hindu higher secondary school-Karambur; D = Government higher secondary school- Vadacheri; E = Government Adi Dravidar Welfare high school- T T Mottur; and F = Government high school-Balur. Nadu. Nearly 80% of the school children were under- weight. The underweight children are highly prone to various kinds of infections, as they have low immune power. This may be one of the factors that attributed to the high mortality rate in the region. The Equation (1) that we derived on regression analy- sis showed that for a particular age, the BMI of female students was greater than that of male students. The same was proved by Sproston et al. [39]. The model also showed that there are other factors that affect the health of children. However, much further study needs to be carried out on the role of parents’ education on children’s health. This is an important variable that has a signifi- cant effect on the BMI of students. The Government of Tamil Nadu started the Mid-Day Meals Program (MDMP) during the period of Mr. Ku- marasami Kamaraj, who was the Chief Minister of Tamil Nadu from 1954-63. Apart from this, he has introduced free school uniforms to weed out caste, creed and class distinctions among young minds. The agenda of this program was essentially to increase the literacy rate in the state. Initially, many people criticized this program, but later the program gained momentum as it increased the attendance of children in government schools. From the 15th August, 1995, the union government of India started financing the Cooked Mid-Day Meal Program (CMDM). At present, Mid-Day Meals are given to school children up to the age of 14 years (till 8th stan- dard). Our study has shown that, children eating Mid-Day Meals do not have normal BMI values (both for Asian and internatio nal standards). Their BMI is less with respect to those standards, as with the other age 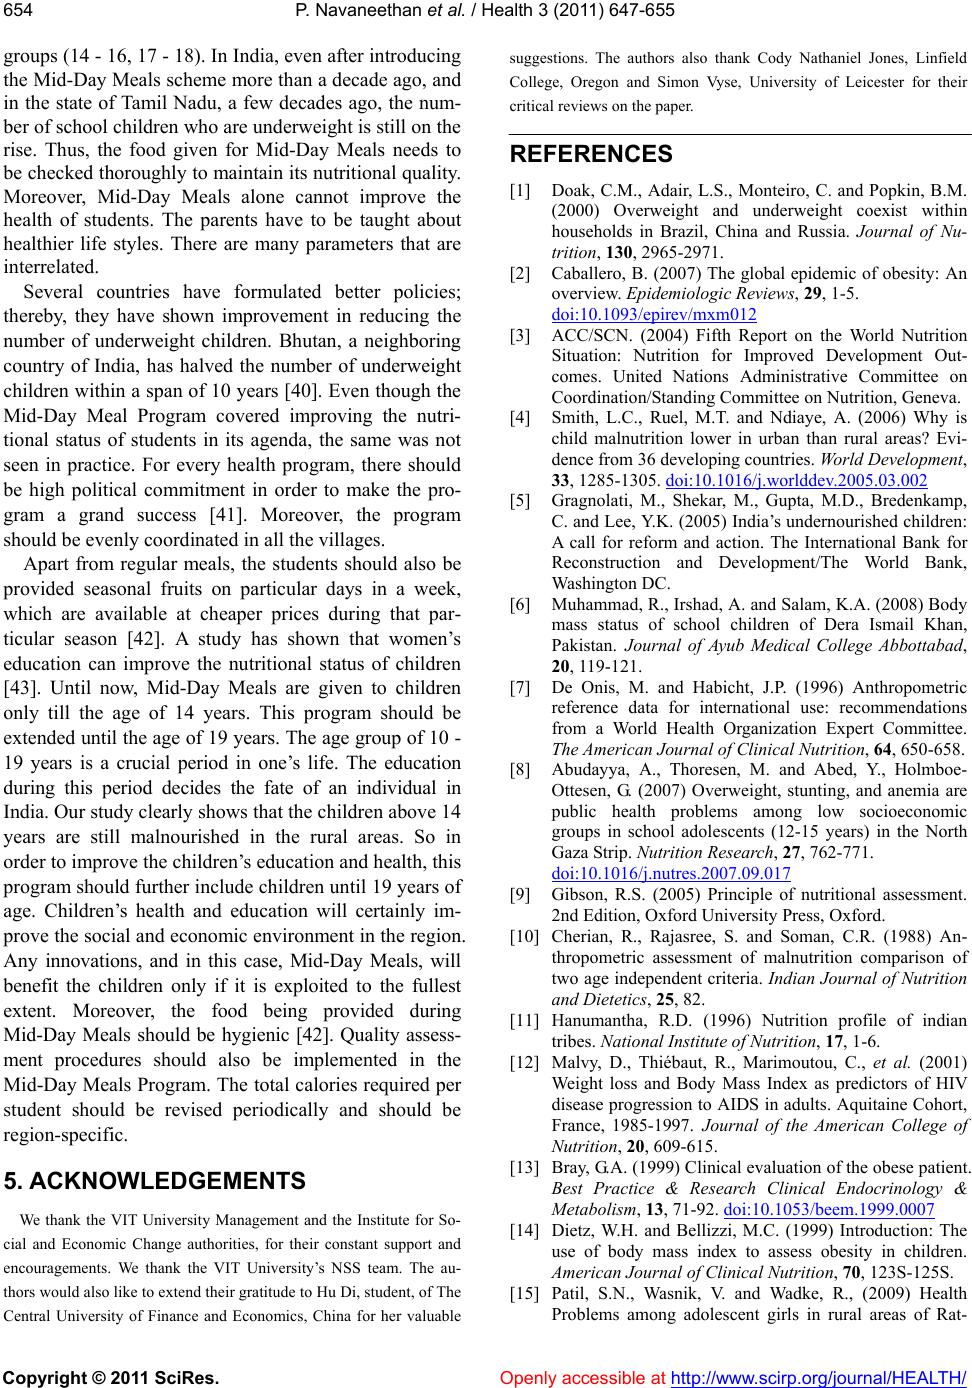 P. Navaneethan et al. / Health 3 (2011) 647-655 Copyright © 2011 SciRes. Openly accessible at http://www.scirp.org/journal/HEALTH/ 654 groups (14 - 16, 17 - 18). In India, ev en after introducing the Mid-Day Meals scheme more than a decade ago, and in the state of Tamil Nadu, a few decades ago, the num- ber of school children who are und erweight is still on th e rise. Thus, the food given for Mid-Day Meals needs to be checked thorough ly to maintain its nutrition al quality. Moreover, Mid-Day Meals alone cannot improve the health of students. The parents have to be taught about healthier life styles. There are many parameters that are interrelated. Several countries have formulated better policies; thereby, they have shown improvement in reducing the number of underweight children. Bhutan, a neighboring country of India, has halved the number of underweight children within a span of 10 years [40]. Even though the Mid-Day Meal Program covered improving the nutri- tional status of students in its agenda, the same was not seen in practice. For every health program, there should be high political commitment in order to make the pro- gram a grand success [41]. Moreover, the program should be evenly coordinated in all the villages. Apart from regular meals, the students should also be provided seasonal fruits on particular days in a week, which are available at cheaper prices during that par- ticular season [42]. A study has shown that women’s education can improve the nutritional status of children [43]. Until now, Mid-Day Meals are given to children only till the age of 14 years. This program should be exte nded until the ag e of 19 years. The age group o f 10 - 19 years is a crucial period in one’s life. The education during this period decides the fate of an individual in India. Our study clearly shows that the children above 14 years are still malnourished in the rural areas. So in order to improve the ch ildren’s education and health , this program should further include children until 19 years of age. Children’s health and education will certainly im- prove the social and economic environment in the region. Any innovations, and in this case, Mid-Day Meals, will benefit the children only if it is exploited to the fullest extent. Moreover, the food being provided during Mid-Day Meals should be hygienic [42]. Quality assess- ment procedures should also be implemented in the Mid-Day Meals Program. The total calories required per student should be revised periodically and should be region-specific. 5. ACKNOWLEDGEMENTS We thank the VIT University Management and the Institute for So- cial and Economic Change authorities, for their constant support and encouragements. We thank the VIT University’s NSS team. The au- thors would also like to extend their gratitude to Hu Di, student, of The Central University of Finance and Economics, China for her valuable suggestions. The authors also thank Cody Nathaniel Jones, Linfield College, Oregon and Simon Vyse, University of Leicester for their critical reviews on the paper. REFERENCES [1] Doak, C.M., Adair, L.S., Monteiro, C. and Popkin, B.M. (2000) Overweight and underweight coexist within households in Brazil, China and Russia. Journal of Nu- trition, 130, 2965-2971. [2] Caballero, B. (2007) The global epidemic of obesity: An overview. Epidemiologic Reviews, 29, 1-5. doi:10.1093/epirev/mxm012 [3] ACC/SCN. (2004) Fifth Report on the World Nutrition Situation: Nutrition for Improved Development Out- comes. United Nations Administrative Committee on Coordination/Standing Committee on Nutrition, Geneva. [4] Smith, L.C., Ruel, M.T. and Ndiaye, A. (2006) Why is child malnutrition lower in urban than rural areas? Evi- dence from 36 developing countries. World Development, 33, 1285-1305. doi:10.1016/j.worlddev.2005.03.002 [5] Gragnolati, M., Shekar, M., Gupta, M.D., Bredenkamp, C. and Lee, Y.K. (2005) India’s undernourished children: A call for reform and action. The International Bank for Reconstruction and Development/The World Bank, Washington DC. [6] Muhammad, R., Irshad, A. and Salam, K.A. (2008) Body mass status of school children of Dera Ismail Khan, Pakistan. Journal of Ayub Medical College Abbottabad, 20, 119-121. [7] De Onis, M. and Habicht, J.P. (1996) Anthropometric reference data for international use: recommendations from a World Health Organization Expert Committee. The American Journal of Clinical Nutrition, 64, 650-658. [8] Abudayya, A., Thoresen, M. and Abed, Y., Holmboe- Ottesen, G. (2007) Overweight, stunting, and anemia are public health problems among low socioeconomic groups in school adolescents (12-15 years) in the North Gaza Strip. Nutrition Research, 27, 762-771. doi:10.1016/j.nutres.2007.09.017 [9] Gibson, R.S. (2005) Principle of nutritional assessment. 2nd Edition, Oxford University Press, Oxford. [10] Cherian, R., Rajasree, S. and Soman, C.R. (1988) An- thropometric assessment of malnutrition comparison of two age independent criteria. Indian Journal of Nutrition and Dietetics, 25, 82. [11] Hanumantha, R.D. (1996) Nutrition profile of indian tribes. National Institute of Nutrition, 17, 1-6. [12] Malvy, D., Thiébaut, R., Marimoutou, C., et al. (2001) Weight loss and Body Mass Index as predictors of HIV disease progression to AIDS in adults. Aquitaine Cohort, France, 1985-1997. Journal of the American College of Nutrition, 20, 609-615. [13] Bray, G.A. (1999) Clinical evaluation of the obese patient. Best Practice & Research Clinical Endocrinology & Metabolism, 13, 71-92. doi:10.1053/beem.1999.0007 [14] Dietz, W.H. and Bellizzi, M.C. (1999) Introduction: The use of body mass index to assess obesity in children. American Journal of Clinical Nutrition, 70, 123S-125S. [15] Patil, S.N., Wasnik, V. and Wadke, R., (2009) Health Problems among adolescent girls in rural areas of Rat-  P. Navaneethan et al. / Health 3 (2011) 647-655 Copyright © 2011 SciRes. http://www.scirp.org/journal/HEALTH/Openly accessible at 655655 nagiri district of Maharastra India. Journal of Clinical and Diagnostic Research, 3, 1784-1790. [16] Shang, L., Jiang, X., Bao, X.-H., Xue, F.-B. and Xu Y.-Y. (2007) Body Mass Index of male youths aged 18-20 years of the Han nationality living in different regions of China. Journal of Health, Population and Nutrition, 25, 488-494. [17] United Nations. (1998) Nutrition of the School Aged. Administrative Committee on Co-ordination Sub-com- mittee on Nutrition (ACC/SCN). SCN News No. 16; pp 3-23. [18] Kappor, G. and Aneja, S. (1992) Nutritional disorders in adolescent girls. Indian Journal of Pediatrics, 29, 969- 973. [19] Abahussain, N.A., Musaiger, A.O., Nicholls, P.J. and Stevens, R. (1999) Nutritional status of adolescent girls in the eastern province of Saudi Arabia. Journal of Nutri- tion, Health, 13, 171-177. [20] Chang, S.M., Walker, S.P., Grantham-McGregor, S. and Powell, C.A. (2002) Early childhood stunting and later behaviour and school achievement. The Journal of Child Psychology and Psychiatry, 43, 775-783. d oi :1 0. 1111/ 1469-7610.00088 [21] Martorell, R., Rivera, J., Kaplowitz, H. and Pollitt, E. (1992) Long term consequences of growth retardation during early childhood. In: Hernandez, M., Argente, J., Eds., Human growth: Basic and clinical aspects, Elsevier, Amsterdam, 143-149. [22] Walker, S.P., Grantham-McGregor, S.M., Powell, C.A. and Chang, S.M. (2000) Effects of growth restriction in early childhood on growth, IQ, and cognition at age 11 to 12 years and the benefits of nutritional supplementation and psychosocial stimulation. Journal of Pediatrics, 137, 36-41. doi:10.1067/mpd.2000.106227 [23] Pelletier, D.L. and Frongillo, E.A., (2003) Changes in child survival are strongly associated with changes in malnutrition in developing countries. Journal of Nutri- tion, 133, 107-119. [24] Ezzati, M., Lopez, A.D., Rodgers, A., Vander Hoorn, S., Murray, C.J.L. and the Comparative Risk Assessment Collaborating Group. (2002) Selected major risk factors and global and regional burden of disease. Lancet, 360, 1347-1360. doi:10.1016/S0140-6736(02)11403-6 [25] Caulfield, L.E., de Onis, M., Blossner, M. and Black, R.E. (2004) Under nutrition as an underlying cause of child deaths associated with diarrhea, pneumonia, malaria and measles. The American Journal of Clinical Nutrition, 80, 193-198. [26] Ravn, P., Cizza, G., Bjarnason, N.H., Thompson, D., Daley, M., Wasnich, R.D., McClung, M., Hosking, D., Yates, A.J. and Christiansen, C. (1999) Low body mass index is an important risk factor for low bone mass and increased bone loss in early postmenopausal women. Early Postmenopausal Intervention Cohort (EPIC) study group. American Journal of Clinical Nutrition, 14, 1622-1627. doi:10.1359/jbmr.1999.14.9.1622 [27] Sharp, D.S., Masaki, K., Burchfiel, C.M., Yano, K. and Schatz, I.J. (1998) Prolonged QTC interval, impaired pulmonary function, and a very lean body mass jointly predict all-cause mortality in elderly men. Annals of Epidemiology, 8, 99-106. doi:10.1016/S1047-2797(97)00121-X [28] United Nations (2000) United Nations Millennium Dec- laration; A/RES/55/ 2. http://www.un.org/millennium/ [29] Salah, E.O.M., Nnyepe, M. and Bandeke T. (2006) Fac- tors affecting prevalence of malnutrition among children under three years of age in Botswana. African Journal of Food, Agriculture, Nutrition and Development, 6,1. [30] Herrera, H., Rebato, E., Arechabaleta, G., Lagrange, H., Salces, I. and Susanne, C. (2003) Body Mass Index and energy intake in Venezuelan University students. Nutri- tion Research, 23, 389-400. doi:10.1016/S0271-5317(02)00541-9 [31] Government of Tamil Nadu. Vellore statistical handbook 20008-09 no.45. 2010. http://www.vellore.tn.nic.in/ stathandbook.htm. [32] Aykroyd, W.R. and Mayer, J. (1968) Food and Nutrition terminology. WHO, Geneva. [33] Rahman, M. and Berenson, A.B. (2010) Accuracy of current Body Mass Index obesity classification for white, black, and Hispanic reproductive-age women. Obstetrics & Gynecology, 115, 982-988. [34] Shafique, S., Akhter, N., Stallkamp, G., et al. (2007) Trends of under- and overweight among rural and urban poor women indicate the double burden of malnutrition in Bangladesh. International Journal of Epidemiology, 36, 449-457. doi:10.1093/ije/dyl306 [35] Pryer, J.A. and Rogers, S. (2006) Epidemiology of under nutrition in adults in Dhaka slum households, Bangla- desh. European Journal of Clinical Nutrition, 60, 815-822. doi:10.1038/sj.ejcn.1602385 [36] Pryer, J.A., Rogers, S. and Rahman, A. (2003) Factors affecting nutritional status of female adults in Dhaka slums, Bangladesh. Society of Biology, 50, 259-269. [37] Baqui, A.H., Arifeen, S.E., Amin, S. and Black, R.E. (1994) Levels and correlates of maternal nutritional status in urban Bangladesh. European Journal of Clinical Nutrition, 48, 349-357. [38] The blood group diet spotlight by Juliette Kellow on weight loss resources. 2010. http://www.weightlossresources.co.uk/diet/blood_group_ diet.htm. [39] Sproston, K. and Primatesta, P. (2003) Health Survey for England 2002. Volume 1: The health of children and young people. The Stationery Office, London. [40] Editorial, (2006) Global childhood malnutrition. The Lancet, 367, 1459. [41] M. Gragnolati, Bredenkamp, C., Das Gupta, M., Lee, Y.-K. and Shekar, M. (2006) ICDS and persistent under- nutrition strategies to enhance the impact. Economic and Political We ekly, 41, 1193-1201. [42] Deodhar, S.Y., Mahandiratta, S., Ramani, K.V., Mava- lankar, D., Ghosh, S. and Braganza, V.S.J., (2007) Mid- Day Meal Scheme: Understanding critical issues with reference to Ahmedabad city. Working Paper No. 2007-03-03. Indian Institute of Management, Ahmeda- bad. [43] Mishra, V.K. and Retherford, R.D., (2000) Women’s education can improve child nutrition in India. National Family Health Survey Bulletin, 15, 1-4. |