Paper Menu >>
Journal Menu >>
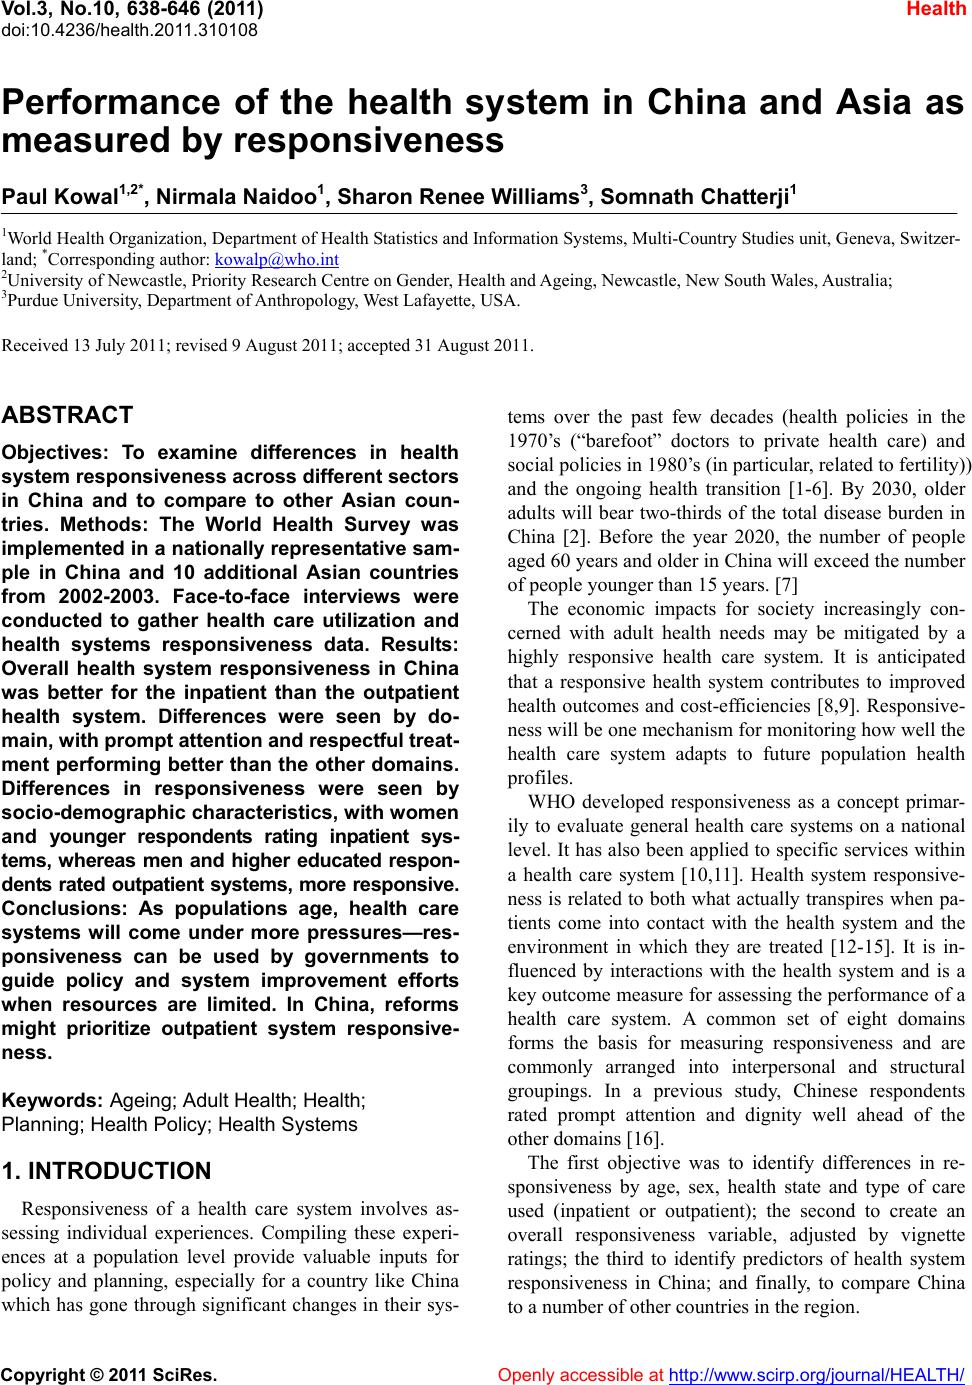
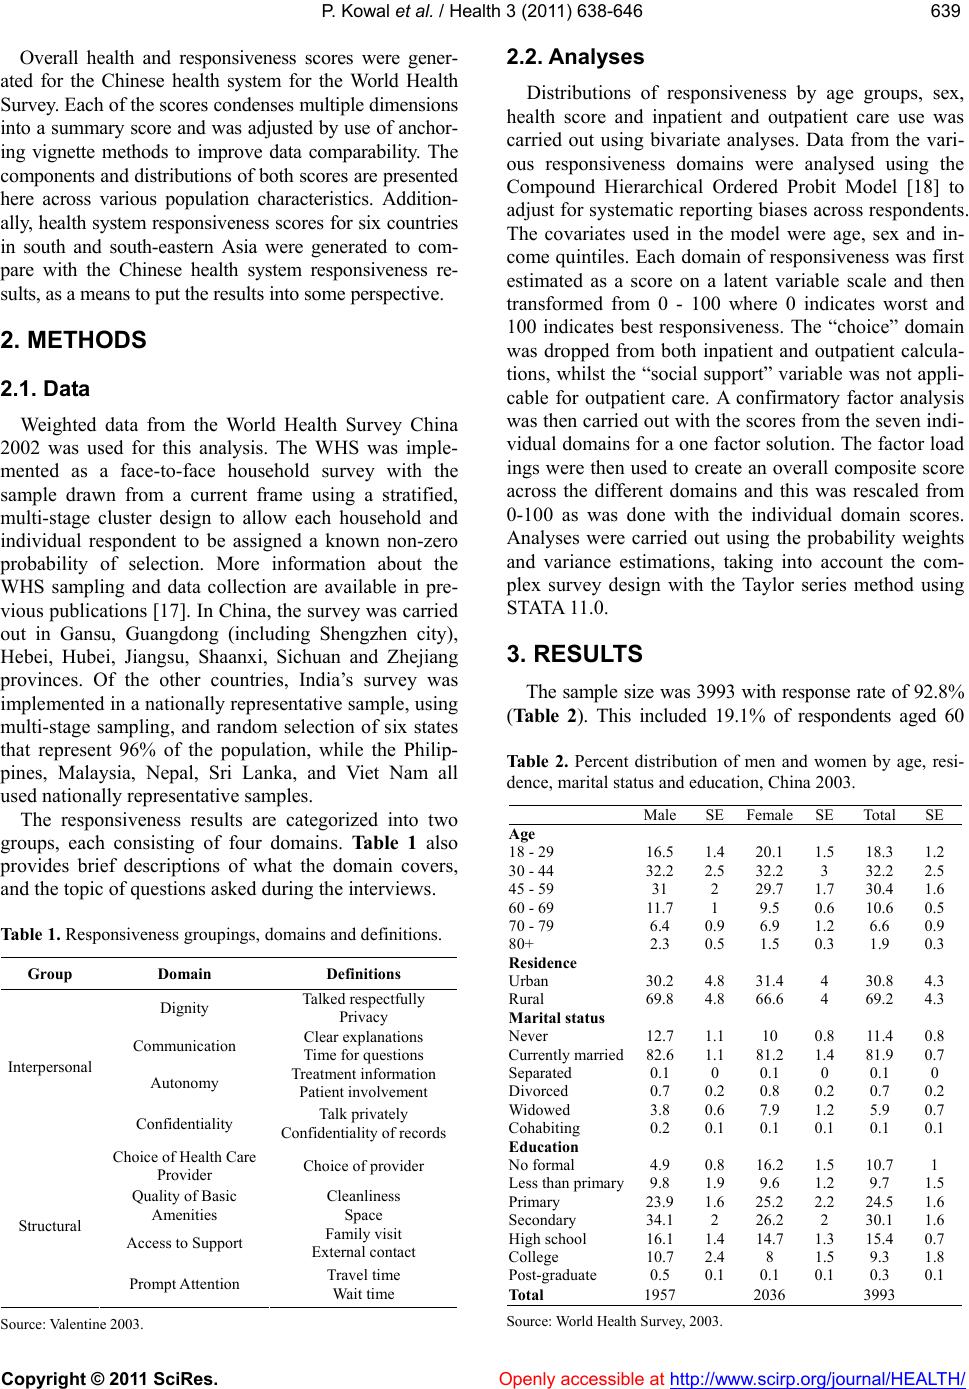
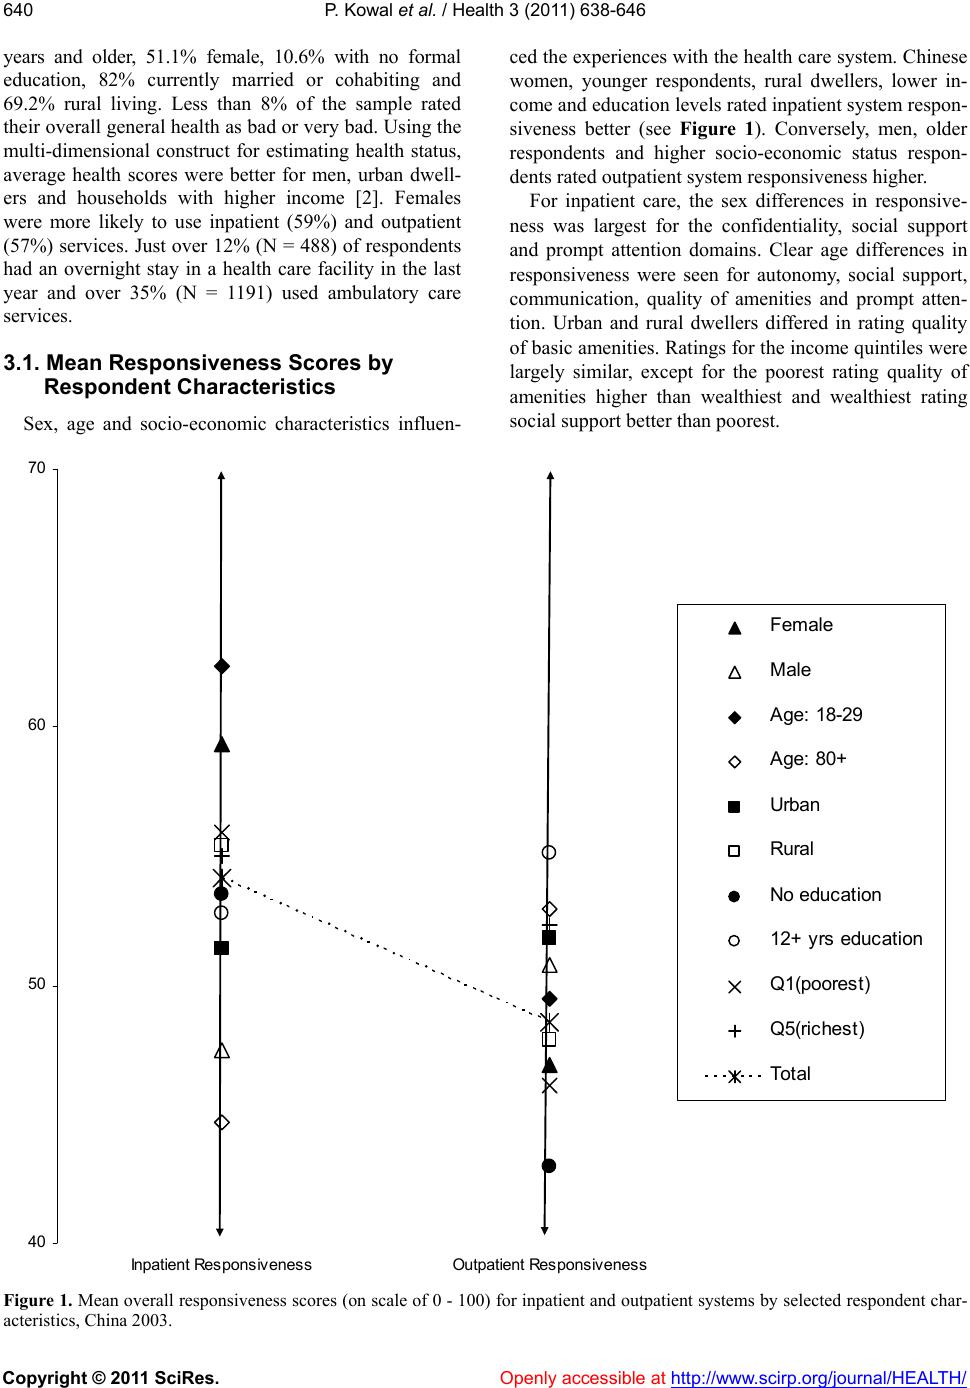
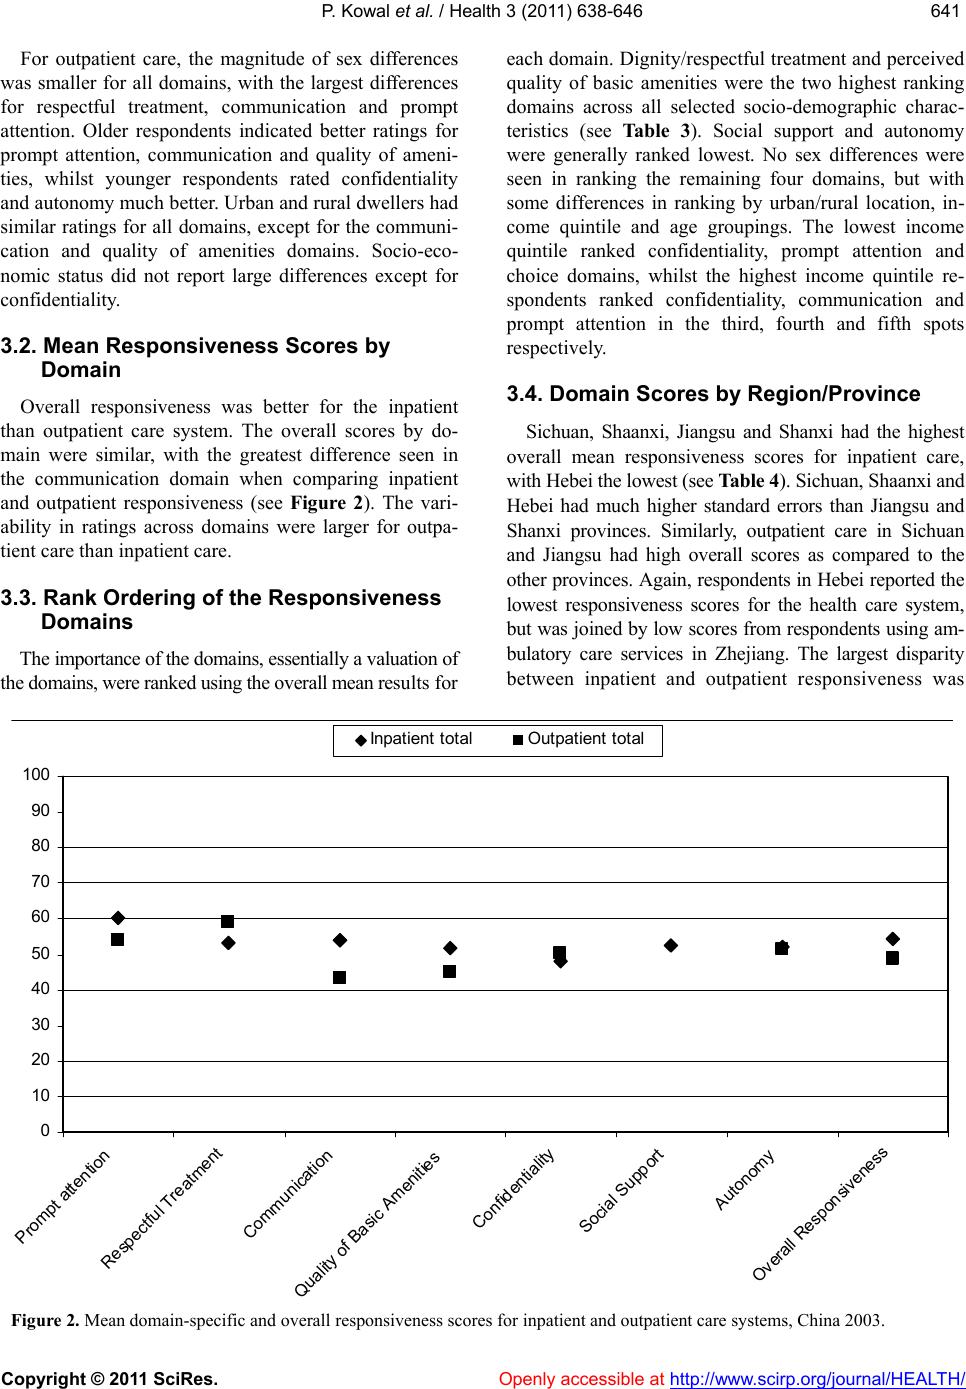
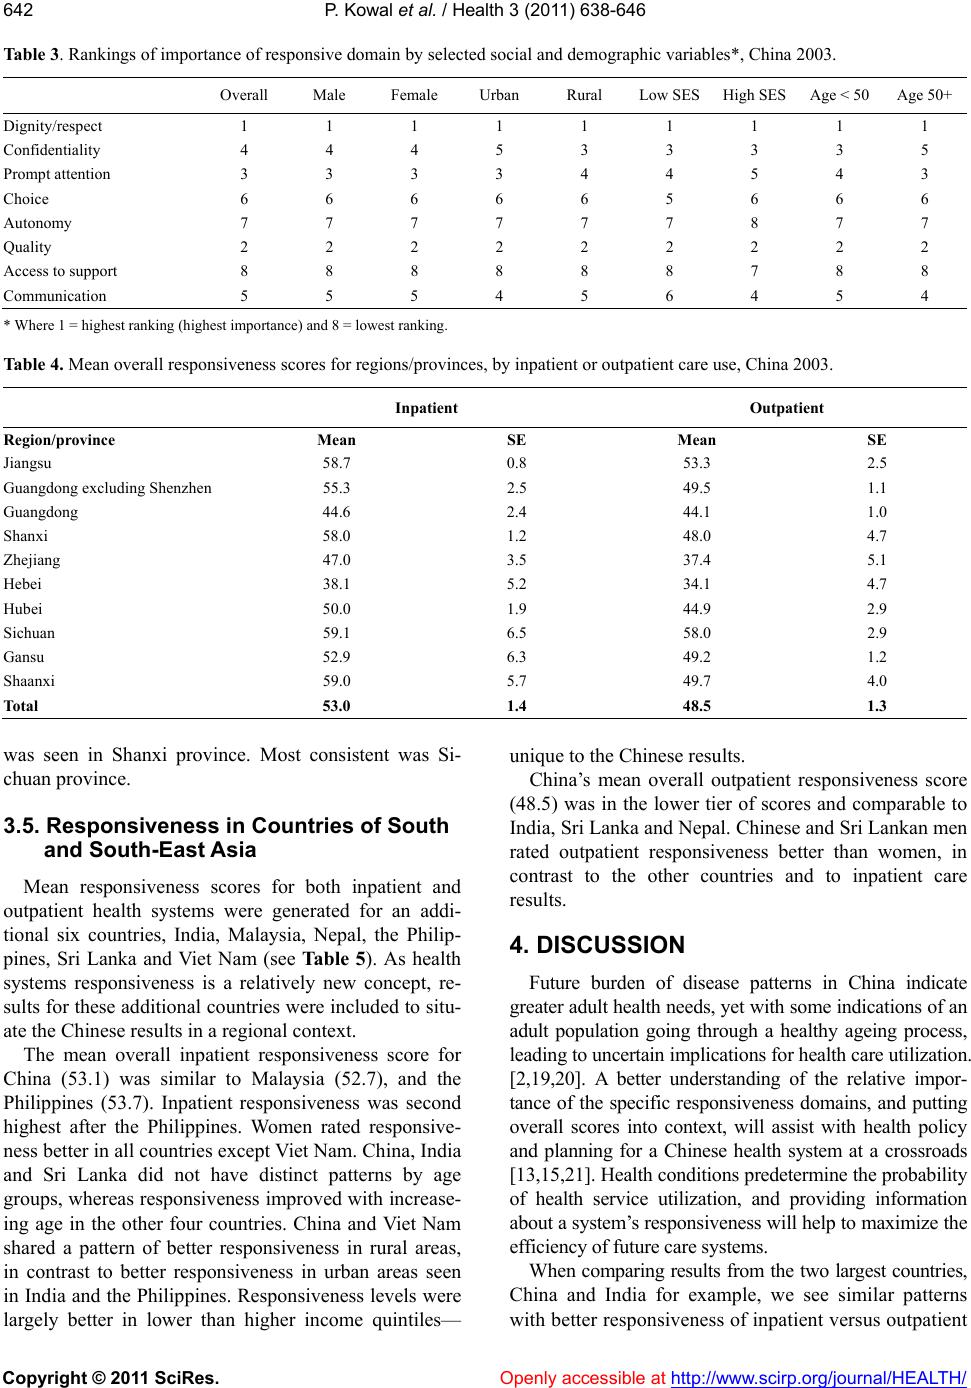
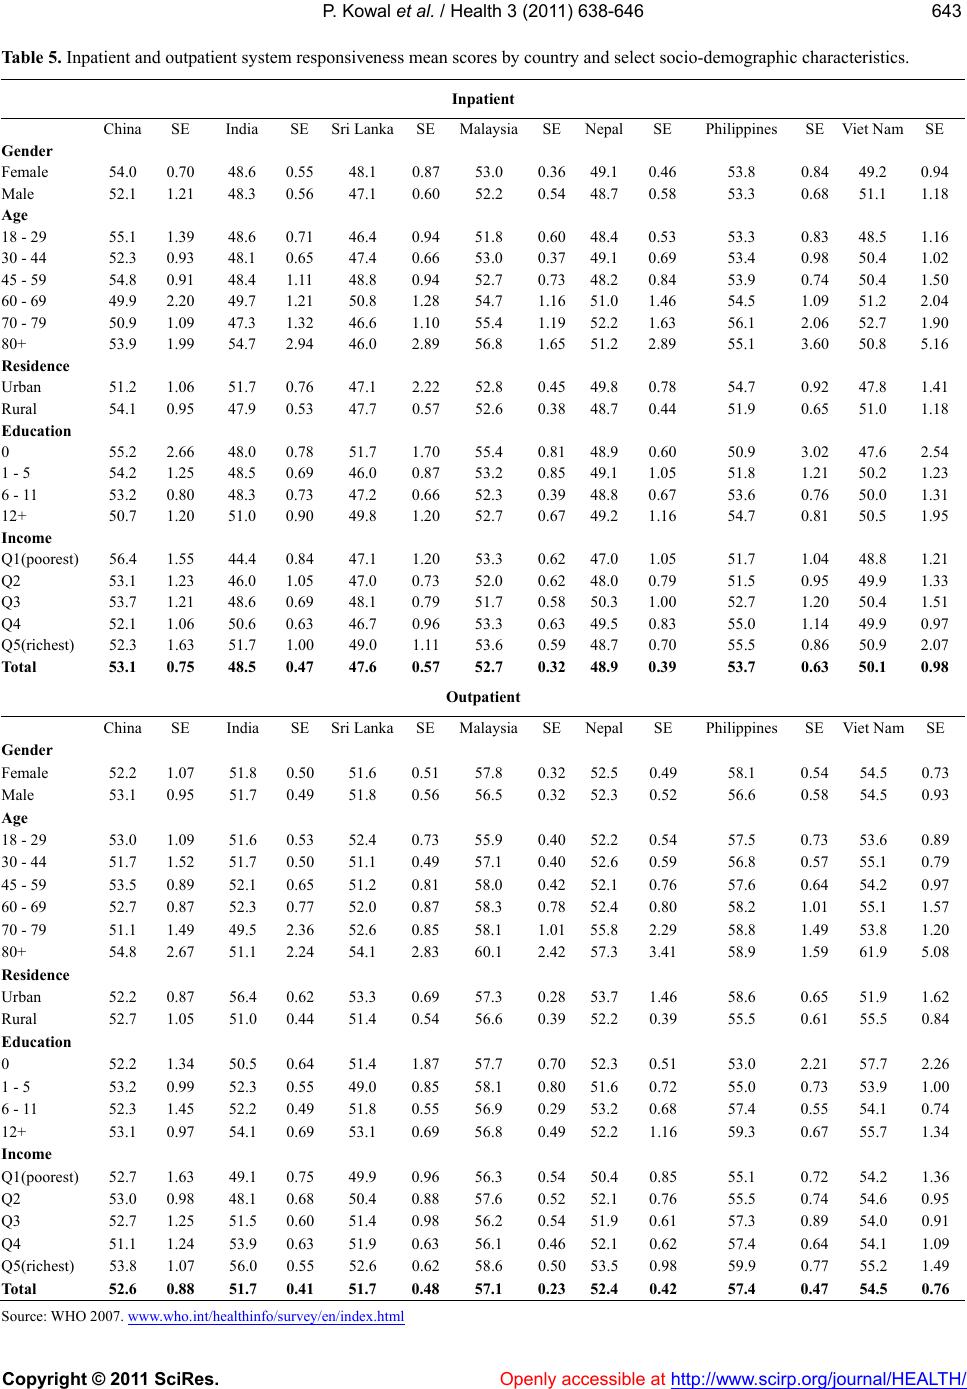
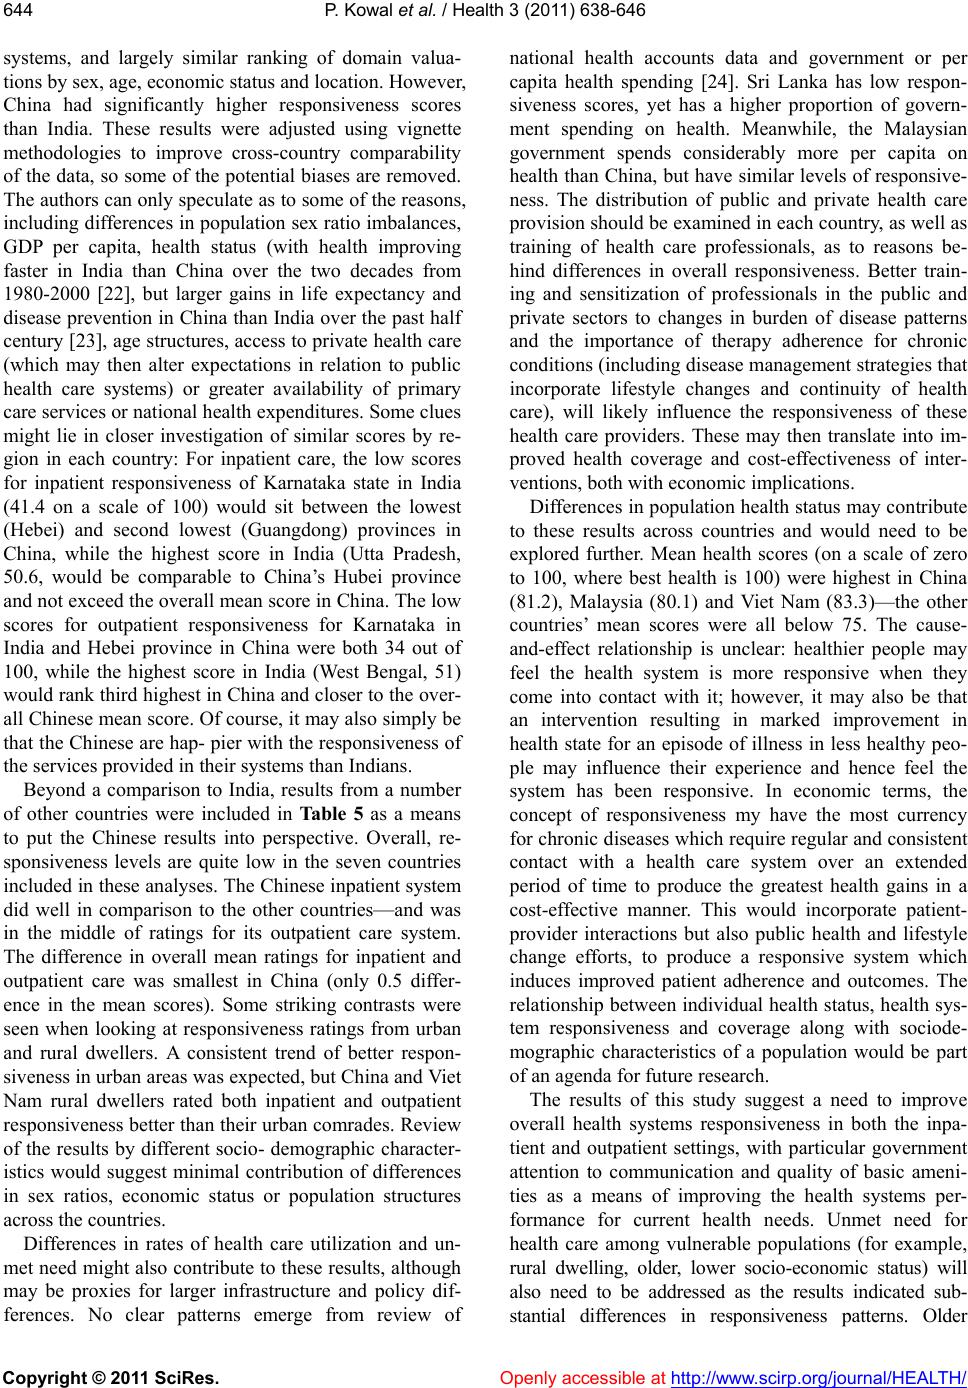
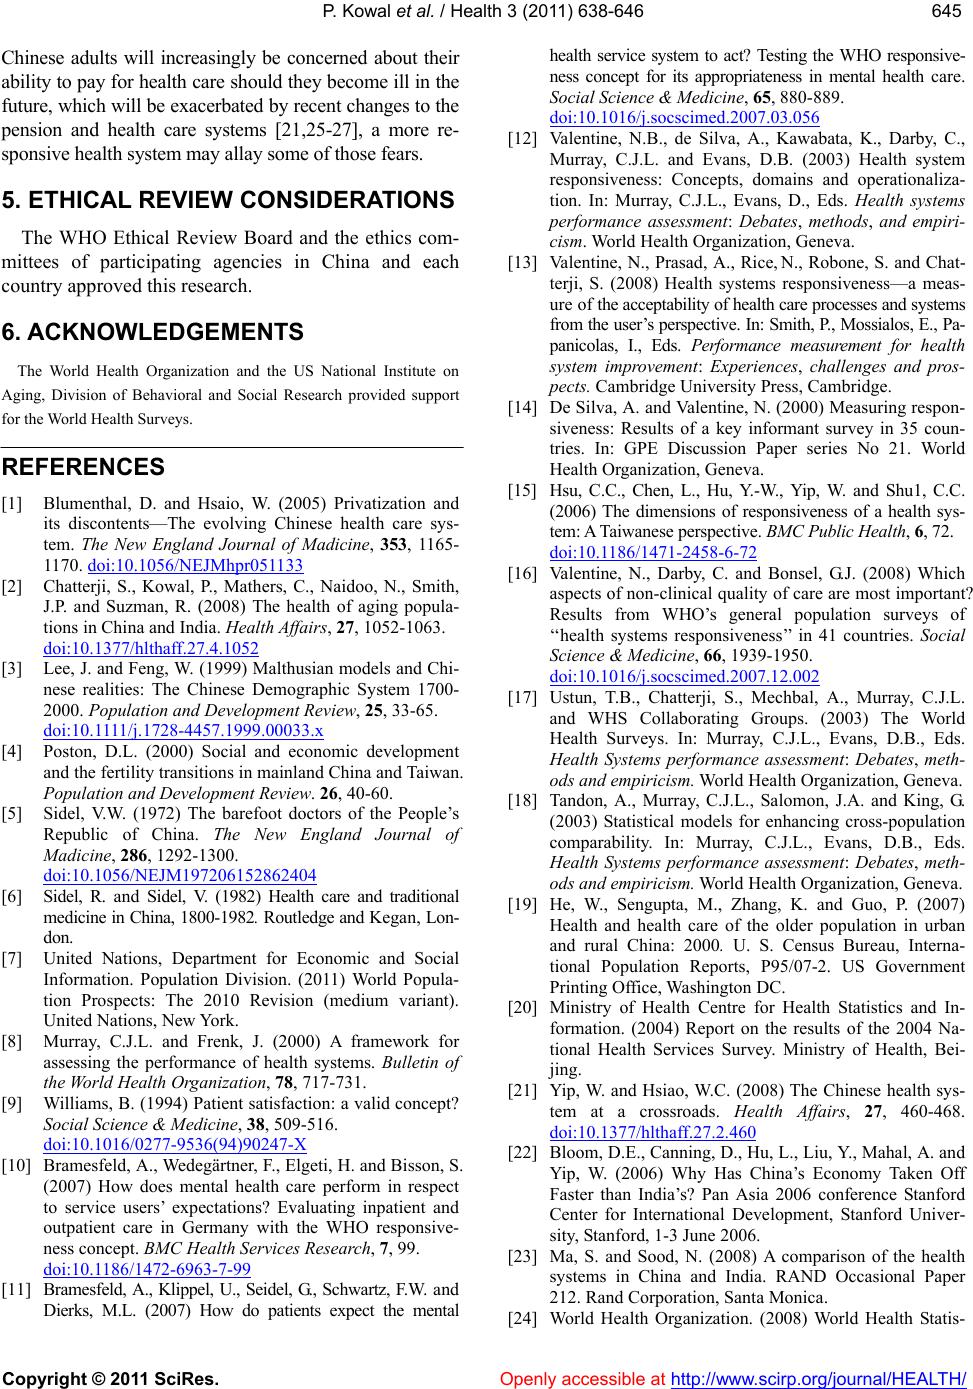
![]() Vol.3, No.10, 638-646 (2011) doi:10.4236/health.2011.310108 C opyright © 2011 SciRes. Openly accessible at http://www.scirp.org/journal/HEALTH/ Health Performance of the health system in China and Asia as measured by responsiveness Paul Kowal1,2*, Nirmala Naidoo1, Sharon Renee Williams3, Somnath Chatterji1 1World Health Organization, Department of Health Statistics and Information Systems, Multi-Country Studies unit, Geneva, Switzer- land; *Corresponding author: [email protected] 2University of Newcastle, Priority Research Centre on Gender, Health and Ageing, Newcastle, New South Wales, Australia; 3Purdue University, Department of Anthropology, West Lafayette, USA. Received 13 July 2011; revised 9 August 2011; accepted 31 August 2011. ABSTRACT Objectives: To examine differences in health system re sponsiveness across different secto rs in China and to compare to other Asian coun- tries. Methods: The World Health Survey was implemented in a nationally representative sam- ple in China and 10 additional Asian countries from 2002-2003. Face-to-face interviews were conducted to gather health care utilization and health systems responsiveness data. Results: Overall health system responsiveness in China was better for the inpatient than the outpatient health system. Differences were seen by do- main, with pr ompt a tte nti on a nd re spec tful treat- ment performing better than the other domains. Differences in responsiveness were seen by socio-demographic characteristics, w ith women and younger respondents rating inpatient sys- tems, whereas men and higher educated respon- dents rated outpat ient systems, more re sponsive. Conclusions: As populations age, health care systems will come under more pressures—res- ponsiveness can be used by governments to guide policy and system improvement efforts when resources are limited. In China, reforms might prioritize outpatient system responsive- ness. Keywords: Ageing; Adult Health; Health; Planning; Health Policy; Health Systems 1. INTRODUCTION Responsiveness of a health care system involves as- sessing individual experiences. Compiling these experi- ences at a population level provide valuable inputs for policy and planning, especially for a country like China which has gone thro ugh significant changes in their sys- tems over the past few decades (health policies in the 1970’s (“barefoot” doctors to private health care) and social policies in 1980’s (in particular, related to fertility)) and the ongoing health transition [1-6]. By 2030, older adults will bear two-thirds of the total disease burden in China [2]. Before the year 2020, the number of people aged 60 years and older in China will exceed the number of people younger than 15 years. [7] The economic impacts for society increasingly con- cerned with adult health needs may be mitigated by a highly responsive health care system. It is anticipated that a responsive health system contributes to improved health outcomes and cost-efficiencies [8,9]. Responsive- ness will be one mechanism for monitoring how well the health care system adapts to future population health profiles. WHO developed responsiveness as a concept primar- ily to evaluate general health care systems on a national level. It has also been applied to specific services within a health care system [10,11]. Health system responsive- ness is related to both what actually transpires when pa- tients come into contact with the health system and the environment in which they are treated [12-15]. It is in- fluenced by interactions with the health system and is a key outcome measure for assessing the performance of a health care system. A common set of eight domains forms the basis for measuring responsiveness and are commonly arranged into interpersonal and structural groupings. In a previous study, Chinese respondents rated prompt attention and dignity well ahead of the other dom ains [16]. The first objective was to identify differences in re- sponsiveness by age, sex, health state and type of care used (inpatient or outpatient); the second to create an overall responsiveness variable, adjusted by vignette ratings; the third to identify predictors of health system responsiveness in China; and finally, to compare China to a number of other countries in the region. ![]() P. Kowal et al. / Health 3 (2011) 638-646 Copyright © 2011 SciRes. Openly accessible at http://www.scirp.org/journal/HEALTH/ 639639 Overall health and responsiveness scores were gener- ated for the Chinese health system for the World Health Survey. Each of the scores condenses multiple dimensions into a summary score and was adjusted by u se of anchor- ing vignette methods to improve data comparability. The components and distributions of both scores are presented here across various population characteristics. Addition- ally, health system responsiveness scores for six countries in south and south-eastern Asia were generated to com- pare with the Chinese health system responsiveness re- sults, as a means to put the results into some perspective. 2. METHODS 2.1. Data Weighted data from the World Health Survey China 2002 was used for this analysis. The WHS was imple- mented as a face-to-face household survey with the sample drawn from a current frame using a stratified, multi-stage cluster design to allow each household and individual respondent to be assigned a known non-zero probability of selection. More information about the WHS sampling and data collection are available in pre- vious publications [17]. In China, the survey was carried out in Gansu, Guangdong (including Shengzhen city), Hebei, Hubei, Jiangsu, Shaanxi, Sichuan and Zhejiang provinces. Of the other countries, India’s survey was implemented in a nationally repr esentative sa mple, using multi-stage sampling, and random selection of six states that represent 96% of the population, while the Philip- pines, Malaysia, Nepal, Sri Lanka, and Viet Nam all used nationally representative samples. The responsiveness results are categorized into two groups, each consisting of four domains. Table 1 also provides brief descriptions of what the domain covers, and the topic of questions asked during the interviews. Table 1. Responsiveness groupings, domains and definitions. Group Domain Definitions Dignity Talked respectfully Privacy Communication Clear explanations Time for questions Autonomy Treatment information Patient involvement Interpersonal Confidentiality Talk privately Confidentiality of reco r ds Choice of Health Care Provider Choice of provider Quality of Basic Amenities Cleanliness Space Access to Support Family visit External contact Structural Prompt Attention Travel time Wait time Source: Va le ntine 2003. 2.2. Analyses Distributions of responsiveness by age groups, sex, health score and inpatient and outpatient care use was carried out using bivariate analyses. Data from the vari- ous responsiveness domains were analysed using the Compound Hierarchical Ordered Probit Model [18] to adjust for systematic reporting biases across respondents. The covariates used in the model were age, sex and in- come quintiles. Each domain of responsiveness was first estimated as a score on a latent variable scale and then transformed from 0 - 100 where 0 indicates worst and 100 indicates best responsiveness. The “choice” domain was dropped from both inpatient and outpatient calcula- tions, whilst the “social support” variable was not appli- cable for outpatient care. A confirmatory factor analysis was then carried out with the scores from the seven indi- vidual domains for a one factor solu tion. The factor load ings were then used to create an overall composite score across the different domains and this was rescaled from 0-100 as was done with the individual domain scores. Analyses were carried out using the probability weights and variance estimations, taking into account the com- plex survey design with the Taylor series method using STATA 11.0. 3. RESULTS The sample size was 3993 with response rate of 92.8% (Table 2). This included 19.1% of respondents aged 60 Table 2. Percent distribution of men and women by age, resi- dence, marital status and education, China 2003. MaleSE Female SE TotalSE Age 18 - 29 16.51.4 20.1 1.5 18.31.2 30 - 44 32.22.5 32.2 3 32.22.5 45 - 59 31 2 29.7 1.7 30.41.6 60 - 69 11.71 9.5 0.6 10.60.5 70 - 79 6.4 0.9 6.9 1.2 6.6 0.9 80+ 2.3 0.5 1.5 0.3 1.9 0.3 Residence Urban 30.24.8 31.4 4 30.84.3 Rural 69.84.8 66.6 4 69.24.3 Marital status Never 12.71.1 10 0.8 11.40.8 Currently married82.61.1 81.2 1.4 81.90.7 Separated 0.1 0 0.1 0 0.1 0 Divorced 0.7 0.2 0.8 0.2 0.7 0.2 Widowed 3.8 0.6 7.9 1.2 5.9 0.7 Cohabiting 0.2 0.1 0.1 0.1 0.1 0.1 Education No formal 4.9 0.8 16.2 1.5 10.71 Less than primary9.8 1.9 9.6 1.2 9.7 1.5 Primary 23.91.6 25.2 2.2 24.51.6 Secondary 34.12 26.2 2 30.11.6 High school 16.11.4 14.7 1.3 15.40.7 College 10.72.4 8 1.5 9.3 1.8 Post-graduate 0.5 0.1 0.1 0.1 0.3 0.1 Total 1957 2036 3993 Source: World Health Survey, 2003. ![]() P. Kowal et al. / Health 3 (2011) 638-646 Copyright © 2011 SciRes. http://www.scirp.org/journal/HEALTH/ 640 years and older, 51.1% female, 10.6% with no formal education, 82% currently married or cohabiting and 69.2% rural living. Less than 8% of the sample rated their overall general health as bad or very bad. Using the multi-dimensional construct for estimating health status, average health scores were better for men, urban dwell- ers and households with higher income [2]. Females were more likely to use inpatient (59%) and outpatient (57%) services. Just over 12% (N = 488) of re spondents had an overnight stay in a health care facility in the last year and over 35% (N = 1191) used ambulatory care services. Openly accessible at 3.1. Mean Responsiveness Scores by Respondent Characteristics Sex, age and socio-economic characteristics influen- ced the experiences with the health care system. Chinese women, younger respondents, rural dwellers, lower in- come and education levels rated inpatient system respon- siveness better (see Figure 1). Conversely, men, older respondents and higher socio-economic status respon- dents rated outpatient system responsiveness higher. For inpatient care, the sex differences in responsive- ness was largest for the confidentiality, social support and prompt attention domains. Clear age differences in responsiveness were seen for autonomy, social support, communication, quality of amenities and prompt atten- tion. Urban and rural dwellers differed in rating quality of basic amenities. Ratings for the income quintiles were largely similar, except for the poorest rating quality of amenities higher than wealthiest and wealthiest rating social support better than poorest. 40 50 60 70 Inpatient ResponsivenessOutpatient Responsiveness Female Male A ge: 18-29 A ge: 80+ Urban Rural No educ at i on 12+ yrs educat i on Q1(poorest) Q5(richest) Total Figure 1. Mean overall responsiveness scores (on scale of 0 - 100) for inpatient and outpatient systems by selected respondent char- acteristics, China 2003. ![]() P. Kowal et al. / Health 3 (2011) 638-646 Copyright © 2011 SciRes. Openly accessible at http://www.scirp.org/journal/HEALTH/ 641641 For outpatient care, the magnitude of sex differences was smaller for all domains, with the largest differences for respectful treatment, communication and prompt attention. Older respondents indicated better ratings for prompt attention, communication and quality of ameni- ties, whilst younger respondents rated confidentiality and autonomy much better. Urban and rural dwellers had similar ratings for all domains, except for the communi- cation and quality of amenities domains. Socio-eco- nomic status did not report large differences except for confidentiality. 3.2. Mean Responsiveness Scores by Domain Overall responsiveness was better for the inpatient than outpatient care system. The overall scores by do- main were similar, with the greatest difference seen in the communication domain when comparing inpatient and outpatient responsiveness (see Figure 2). The vari- ability in ratings across domains were larger for outpa- tient care than inpatient care. 3.3. Rank Ordering of the Responsiveness Domains The importance of the domains, essentially a valuation of the domains, were ranked using the overall mean results for each domain. Dignity/respectful treatment and perceived quality of basic amenities were the two highest ranking domains across all selected socio-demographic charac- teristics (see Table 3). Social support and autonomy were generally ranked lowest. No sex differences were seen in ranking the remaining four domains, but with some differences in ranking by urban/rural location, in- come quintile and age groupings. The lowest income quintile ranked confidentiality, prompt attention and choice domains, whilst the highest income quintile re- spondents ranked confidentiality, communication and prompt attention in the third, fourth and fifth spots respectively. 3.4. Domain Scores by Region/Province Sichuan, Shaanxi, Jiangsu and Shanxi had the highest overall mean responsiveness scores for inpatient care, with Hebei the lowest (see Table 4). Sichuan, Shaanxi and Hebei had much higher standard errors than Jiangsu and Shanxi provinces. Similarly, outpatient care in Sichuan and Jiangsu had high overall scores as compared to the other provinces. Again, respondents in Hebei reported the lowest responsiveness scores for the health care system, but was joined by low scores from respondents using am- bulatory care services in Zhejiang. The largest disparity between inpatient and outpatient responsiveness was 0 10 20 30 40 50 60 70 80 90 100 Prompt attention Respectful Treatm ent Commu nication Q uality of Basic Amenit ies Confidentiality Social Support Autonomy Overall Responsiveness Inpatient totalOutpatient total Figure 2. Me a n domain-specific and overall responsiveness scores for inpatient and outpatient care systems, China 2003. ![]() P. Kowal et al. / Health 3 (2011) 638-646 Copyright © 2011 SciRes. Openly accessible at http://www.scirp.org/journal/HEALTH/ 642 Table 3. Rankings of importance of responsive domain by selected social and demographic variables*, China 2003. Overall Male Female Urban Rural Low SESHigh SES Age < 50 Age 50+ Dignity/respect 1 1 1 1 1 1 1 1 1 Confidentiality 4 4 4 5 3 3 3 3 5 Prompt attention 3 3 3 3 4 4 5 4 3 Choice 6 6 6 6 6 5 6 6 6 Autonomy 7 7 7 7 7 7 8 7 7 Quality 2 2 2 2 2 2 2 2 2 Access to support 8 8 8 8 8 8 7 8 8 Communication 5 5 5 4 5 6 4 5 4 * Where 1 = highest ranking (highest importance) and 8 = lowest ranking. Table 4. Mean overall responsiveness scores for regions/provinces, by inpatient or outpatient care use, China 2003. Inpatient Outpatient Region/province Mean SE Mean SE Jiangsu 58.7 0.8 53.3 2.5 Guangdong excluding Shenzhen 55.3 2.5 49.5 1.1 Guangdong 44.6 2.4 44.1 1.0 Shanxi 58.0 1.2 48.0 4.7 Zhejiang 47.0 3.5 37.4 5.1 Hebei 38.1 5.2 34.1 4.7 Hubei 50.0 1.9 44.9 2.9 Sichuan 59.1 6.5 58.0 2.9 Gansu 52.9 6.3 49.2 1.2 Shaanxi 59.0 5.7 49.7 4.0 Total 53.0 1.4 48.5 1.3 was seen in Shanxi province. Most consistent was Si- chuan province . 3.5. Responsiveness in Countries of South and South-East Asia Mean responsiveness scores for both inpatient and outpatient health systems were generated for an addi- tional six countries, India, Malaysia, Nepal, the Philip- pines, Sri Lanka and Viet Nam (see Tab le 5). As health systems responsiveness is a relatively new concept, re- sults for these additional countries were inclu ded to situ- ate the Chinese results in a regional context. The mean overall inpatient responsiveness score for China (53.1) was similar to Malaysia (52.7), and the Philippines (53.7). Inpatient responsiveness was second highest after the Philippines. Women rated responsive- ness better in all countries ex cept Viet Nam. China, India and Sri Lanka did not have distinct patterns by age groups, whereas responsiveness improved with increase- ing age in the other four countries. China and Viet Nam shared a pattern of better responsiveness in rural areas, in contrast to better responsiveness in urban areas seen in India and the Philippines. Responsiveness levels were largely better in lower than higher income quintiles— unique to the Chinese results. China’s mean overall outpatient responsiveness score (48.5) was in the lower tier of scores and comparable to India, Sri Lanka and Nepal. Chinese and Sri Lankan men rated outpatient responsiveness better than women, in contrast to the other countries and to inpatient care results. 4. DISCUSSION Future burden of disease patterns in China indicate greater adult health needs, yet with some indications of an adult population going through a healthy ageing process, leading to uncertain implications for health care utilization. [2,19,20]. A better understanding of the relative impor- tance of the specific responsiveness domains, and putting overall scores into context, will assist with health policy and planning for a Chinese health system at a crossroads [13,15,21]. Heal th co nd ition s pr edetermine th e p ro bab ility of health service utilization, and providing information about a system’s responsiveness will help to maximize th e efficiency of future care systems. When comparing results from th e two largest countries, China and India for example, we see similar patterns with better responsiveness of inpatient versus outpatient ![]() P. Kowal et al. / Health 3 (2011) 638-646 Copyright © 2011 SciRes. Openly accessible at http://www.scirp.org/journal/HEALTH/ 643643 Table 5. Inpatient and outpatient system responsiveness mean scores by country and select socio-demographic characteristics. Inpatient China SE India SE Sri LankaSE MalaysiaSE NepalSE Philippines SE Viet NamSE Gender Female 54.0 0.70 48.6 0.55 48.1 0.8753.0 0.3649.10.46 53.8 0.84 49.2 0.94 Male 52.1 1.21 48.3 0.56 47.1 0.6052.2 0.5448.70.58 53.3 0.68 51.1 1.18 Age 18 - 29 55.1 1.39 48.6 0.71 46.4 0.9451.8 0.6048.40.53 53.3 0.83 48.5 1.16 30 - 44 52.3 0.93 48.1 0.65 47.4 0.6653.0 0.3749.10.69 53.4 0.98 50.4 1.02 45 - 59 54.8 0.91 48.4 1.11 48.8 0.9452.7 0.7348.20.84 53.9 0.74 50.4 1.50 60 - 69 49.9 2.20 49.7 1.21 50.8 1.2854.7 1.1651.01.46 54.5 1.09 51.2 2.04 70 - 79 50.9 1.09 47.3 1.32 46.6 1.1055.4 1.1952.21.63 56.1 2.06 52.7 1.90 80+ 53.9 1.99 54.7 2.94 46.0 2.8956.8 1.6551.22.89 55.1 3.60 50.8 5.16 Residence Urban 51.2 1.06 51.7 0.76 47.1 2.2252.8 0.4549.80.78 54.7 0.92 47.8 1.41 Rural 54.1 0.95 47.9 0.53 47.7 0.5752.6 0.3848.70.44 51.9 0.65 51.0 1.18 Education 0 55.2 2.66 48.0 0.78 51.7 1.7055.4 0.8148.90.60 50.9 3.02 47.6 2.54 1 - 5 54.2 1.25 48.5 0.69 46.0 0.8753.2 0.8549.11.05 51.8 1.21 50.2 1.23 6 - 11 53.2 0.80 48.3 0.73 47.2 0.6652.3 0.3948.80.67 53.6 0.76 50.0 1.31 12+ 50.7 1.20 51.0 0.90 49.8 1.2052.7 0.6749.21.16 54.7 0.81 50.5 1.95 Income Q1(poorest) 56.4 1.55 44.4 0.84 47.1 1.2053.3 0.6247.01.05 51.7 1.04 48.8 1.21 Q2 53.1 1.23 46.0 1.05 47.0 0.7352.0 0.6248.00.79 51.5 0.95 49.9 1.33 Q3 53.7 1.21 48.6 0.69 48.1 0.7951.7 0.5850.31.00 52.7 1.20 50.4 1.51 Q4 52.1 1.06 50.6 0.63 46.7 0.9653.3 0.6349.50.83 55.0 1.14 49.9 0.97 Q5(richest) 52.3 1.63 51.7 1.00 49.0 1.1153.6 0.5948.70.70 55.5 0.86 50.9 2.07 Total 53.1 0.75 48.5 0.47 47.6 0.5752.7 0.3248.90.39 53.7 0.63 50.1 0.98 Outpatient China SE India SE Sri LankaSE MalaysiaSE NepalSE Philippines SE Viet NamSE Gender Female 52.2 1.07 51.8 0.50 51.6 0.5157.8 0.3252.50.49 58.1 0.54 54.5 0.73 Male 53.1 0.95 51.7 0.49 51.8 0.5656.5 0.3252.30.52 56.6 0.58 54.5 0.93 Age 18 - 29 53.0 1.09 51.6 0.53 52.4 0.7355.9 0.4052.20.54 57.5 0.73 53.6 0.89 30 - 44 51.7 1.52 51.7 0.50 51.1 0.4957.1 0.4052.60.59 56.8 0.57 55.1 0.79 45 - 59 53.5 0.89 52.1 0.65 51.2 0.8158.0 0.4252.10.76 57.6 0.64 54.2 0.97 60 - 69 52.7 0.87 52.3 0.77 52.0 0.8758.3 0.7852.40.80 58.2 1.01 55.1 1.57 70 - 79 51.1 1.49 49.5 2.36 52.6 0.8558.1 1.0155.82.29 58.8 1.49 53.8 1.20 80+ 54.8 2.67 51.1 2.24 54.1 2.8360.1 2.4257.33.41 58.9 1.59 61.9 5.08 Residence Urban 52.2 0.87 56.4 0.62 53.3 0.6957.3 0.2853.71.46 58.6 0.65 51.9 1.62 Rural 52.7 1.05 51.0 0.44 51.4 0.5456.6 0.3952.20.39 55.5 0.61 55.5 0.84 Education 0 52.2 1.34 50.5 0.64 51.4 1.8757.7 0.7052.30.51 53.0 2.21 57.7 2.26 1 - 5 53.2 0.99 52.3 0.55 49.0 0.8558.1 0.8051.60.72 55.0 0.73 53.9 1.00 6 - 11 52.3 1.45 52.2 0.49 51.8 0.5556.9 0.2953.20.68 57.4 0.55 54.1 0.74 12+ 53.1 0.97 54.1 0.69 53.1 0.6956.8 0.4952.21.16 59.3 0.67 55.7 1.34 Income Q1(poorest) 52.7 1.63 49.1 0.75 49.9 0.9656.3 0.5450.40.85 55.1 0.72 54.2 1.36 Q2 53.0 0.98 48.1 0.68 50.4 0.8857.6 0.5252.10.76 55.5 0.74 54.6 0.95 Q3 52.7 1.25 51.5 0.60 51.4 0.9856.2 0.5451.90.61 57.3 0.89 54.0 0.91 Q4 51.1 1.24 53.9 0.63 51.9 0.6356.1 0.4652.10.62 57.4 0.64 54.1 1.09 Q5(richest) 53.8 1.07 56.0 0.55 52.6 0.6258.6 0.5053.5 0.98 59.9 0.77 55.2 1.49 Total 52.6 0.88 51.7 0.41 51.7 0.4857.1 0.2352.40.42 57.4 0.47 54.5 0.76 Source: WHO 2007. www.who.int/healthinfo/survey/en/index.html ![]() P. Kowal et al. / Health 3 (2011) 638-646 Copyright © 2011 SciRes. Openly accessible at http://www.scirp.org/journal/HEALTH/ 644 systems, and largely similar ranking of domain valua- tions by sex, age, economic status and location. However, China had significantly higher responsiveness scores than India. These results were adjusted using vignette methodologies to improve cross-country comparability of the data, so some of the potential biases are removed. The authors can only speculate as to some of the reasons, including differences in population sex ratio imbalances, GDP per capita, health status (with health improving faster in India than China over the two decades from 1980-2000 [22], but larger gains in life expectancy and disease prevention in China than India over the past half century [23], age structures, access to private health care (which may then alter expectations in relation to public health care systems) or greater availability of primary care services or national health expend itures. Some clu es might lie in closer investigation of similar scores by re- gion in each country: For inpatient care, the low scores for inpatient responsiveness of Karnataka state in India (41.4 on a scale of 100) would sit between the lowest (Hebei) and second lowest (Guangdong) provinces in China, while the highest score in India (Utta Pradesh, 50.6, would be comparable to China’s Hubei province and not exceed the overall mean score in China. The low scores for outpatient responsiveness for Karnataka in India and Hebei province in China were both 34 out of 100, while the highest score in India (West Bengal, 51) would rank third highest in China and closer to the over- all Chinese mean score. Of course, it may also simply be that the Chinese are hap- pier with the responsiveness of the services provided in their systems than Indians. Beyond a comparison to India, results from a number of other countries were included in Tab l e 5 as a means to put the Chinese results into perspective. Overall, re- sponsiveness levels are quite low in the seven countries included in these analyses. The Chinese inpatient system did well in comparison to the other countries—and was in the middle of ratings for its outpatient care system. The difference in overall mean ratings for inpatient and outpatient care was smallest in China (only 0.5 differ- ence in the mean scores). Some striking contrasts were seen when looking at responsiveness ratings from urban and rural dwellers. A consistent trend of better respon- siveness in urban areas was expected, but China and Viet Nam rural dwellers rated both inpatient and outpatient responsiveness better than their urban comrades. Review of the results by different socio- demographic character- istics would suggest minimal contribution of differences in sex ratios, economic status or population structures across the countries. Differences in rates of health care utilization and un- met need might also con tribute to these results, although may be proxies for larger infrastructure and policy dif- ferences. No clear patterns emerge from review of national health accounts data and government or per capita health spending [24]. Sri Lanka has low respon- siveness scores, yet has a higher proportion of govern- ment spending on health. Meanwhile, the Malaysian government spends considerably more per capita on health than China, but have similar levels of responsiv e- ness. The distribution of public and private health care provision should be examined in each country, as well as training of health care professionals, as to reasons be- hind differences in overall responsiveness. Better train- ing and sensitization of professionals in the public and private sectors to changes in burden of disease patterns and the importance of therapy adherence for chronic conditions (including disease management strategies that incorporate lifestyle changes and continuity of health care), will likely influence the responsiveness of these health care providers. These may then translate into im- proved health coverage and cost-effectiveness of inter- ventions, both with economi c im pl i cations. Differences in population health status may contribute to these results across countries and would need to be explored further. Mean health scores (on a scale of zero to 100, where best health is 100) were highest in China (81.2), Malaysia (80.1) and Viet Nam (83.3)—the other countries’ mean scores were all below 75. The cause- and-effect relationship is unclear: healthier people may feel the health system is more responsive when they come into contact with it; however, it may also be that an intervention resulting in marked improvement in health state for an episode of illness in less healthy peo- ple may influence their experience and hence feel the system has been responsive. In economic terms, the concept of responsiveness my have the most currency for chronic diseases which require regular and consistent contact with a health care system over an extended period of time to produce the greatest health gains in a cost-effective manner. This would incorporate patient- provider interactions but also public health and lifestyle change efforts, to produce a responsive system which induces improved patient adherence and outcomes. The relationship between individual health status, health sys- tem responsiveness and coverage along with sociode- mographic characteristics of a population would be part of an agenda for future research. The results of this study suggest a need to improve overall health systems responsiveness in both the inpa- tient and outpatient settings, with particular government attention to communication and quality of basic ameni- ties as a means of improving the health systems per- formance for current health needs. Unmet need for health care among vulnerable populations (for example, rural dwelling, older, lower socio-economic status) will also need to be addressed as the results indicated sub- stantial differences in responsiveness patterns. Older ![]() P. Kowal et al. / Health 3 (2011) 638-646 Copyright © 2011 SciRes. Openly accessible at http://www.scirp.org/journal/HEALTH/ 645645 Chinese adults will increasingly be concerned about their ability to pay for health care should they become ill in the future, which will be exacerbated by recent changes to the pension and health care systems [21,25-27], a more re- sponsive health system may allay some of those fears. 5. ETHICAL REVIEW CONSIDE RATIONS The WHO Ethical Review Board and the ethics com- mittees of participating agencies in China and each country approved this research. 6. ACKNOWLEDGEMENTS The World Health Organization and the US National Institute on Aging, Division of Behavioral and Social Research provided support for the World Health Surveys. REFERENCES [1] Blumenthal, D. and Hsaio, W. (2005) Privatization and its discontents—The evolving Chinese health care sys- tem. The New England Journal of Madicine, 353, 1165- 1170. doi:10.1056/NEJMhpr051133 [2] Chatterji, S., Kowal, P., Mathers, C., Naidoo, N., Smith, J.P. and Suzman, R. (2008) The health of aging popula- tions in China and India. Health Af fairs, 27, 1052-1063. doi:10.1377/hlthaff.27.4.1052 [3] Lee, J. and Feng, W. (1999) Malthusian models and Chi- nese realities: The Chinese Demographic System 1700- 2000. Population and Development Review, 25, 33-65. d oi : 10 .1111/ j.1 7 28 -4457.1999.00033.x [4] Poston, D.L. (2000) Social and economic development and the fertility transitions in mainland China and Taiwan. Population and Development Review. 26, 40-60. [5] Sidel, V.W. (1972) The barefoot doctors of the People’s Republic of China. The New England Journal of Madicine, 286, 1292-1300. doi:10.1056/NEJM197206152862404 [6] Sidel, R. and Sidel, V. (1982) Health care and traditional medicine in China, 1800-1982. Routledge and Ke ga n, Lon- don. [7] United Nations, Department for Economic and Social Information. Population Division. (2011) World Popula- tion Prospects: The 2010 Revision (medium variant). United Nations, New York. [8] Murray, C.J.L. and Frenk, J. (2000) A framework for assessing the performance of health systems. Bulletin of the World Health Organization, 78, 717-731. [9] Williams, B. (1994) Patient satisfaction: a valid concept? Social Science & Medicine, 38, 509-516. doi:10.1016/0277-9536(94)90247-X [10] Bramesfeld, A., Wedegärtner, F., Elgeti, H. and Bisson, S. (2007) How does mental health care perform in respect to service users’ expectations? Evaluating inpatient and outpatient care in Germany with the WHO responsive- ness concept. BMC Health Services Research, 7, 99. doi:10.1186/1472-6963-7-99 [11] Bramesfeld, A., Klippel, U., Seidel, G., Schwartz, F.W. a nd Dierks, M.L. (2007) How do patients expect the mental health service system to act? Testing the WHO responsive- ness concept for its appropriateness in mental health care. Social Science & Medicine, 65, 880-889. doi:10.1016/j.socscimed.2007.03.056 [12] Valentine, N.B., de Silva, A., Kawabata, K., Darby, C., Murray, C.J.L. and Evans, D.B. (2003) Health system responsiveness: Concepts, domains and operationaliza- tion. In: Murray, C.J.L., Evans, D., Eds. Health systems performance assessment: Debates, methods, and empiri- cism. World Health Organization, Geneva. [13] Valentine, N., Prasad, A., Rice, N., Robone, S. and Chat- terji, S. (2008) Health systems responsiveness—a meas- ure of the acceptability of hea l th care processes and systems from the user ’s perspective. In: Smith, P., Mossialos, E., Pa- panicolas, I., Eds. Performance measurement for health system improvement: Experiences, challenges and pros- pects. Cambridge University Press, Cambridge. [14] De Silva, A. and Valentine, N. (2000) Measuring respon- siveness: Results of a key informant survey in 35 coun- tries. In: GPE Discussion Paper series No 21. World Health Organization, Geneva. [15] Hsu, C.C., Chen, L., Hu, Y.-W., Yip, W. and Shu1, C.C. (2006) The dimensions of responsiveness of a health sys- tem: A T aiwanese perspective. BMC Public Health, 6, 72. doi:10.1186/1471-2458-6-72 [16] Valentine, N., Darby, C. and Bonsel, G.J. (2008) Which aspects of non-clinical quality of care are most important? Results from WHO’s general population surveys of ‘‘health systems responsiveness’’ in 41 countries. Social Science & Medicine, 66, 1939-1950. doi:10.1016/j.socscimed.2007.12.002 [17] Ustun, T.B., Chatterji, S., Mechbal, A., Murray, C.J.L. and WHS Collaborating Groups. (2003) The World Health Surveys. In: Murray, C.J.L., Evans, D.B., Eds. Health Systems performance assessment: Debates, meth- ods and empiricism. World Health Organization, Geneva. [18] Tandon, A., Murray, C.J.L., Salomon, J.A. and King, G. (2003) Statistical models for enhancing cross-population comparability. In: Murray, C.J.L., Evans, D.B., Eds. Health Systems performance assessment: Debates, meth- ods and empiricism. World Health Organization, Geneva. [19] He, W., Sengupta, M., Zhang, K. and Guo, P. (2007) Health and health care of the older population in urban and rural China: 2000. U. S. Census Bureau, Interna- tional Population Reports, P95/07-2. US Government Printing Office, Washington DC. [20] Ministry of Health Centre for Health Statistics and In- formation. (2004) Report on the results of the 2004 Na- tional Health Services Survey. Ministry of Health, Bei- jing. [21] Yi p, W. and Hsiao, W.C. (2008) The Chinese health sys- tem at a crossroads. Health Affairs, 27, 460-468. doi:10.1377/hlthaff.27.2.460 [22] Bloom, D.E., Canning, D., Hu, L., Liu, Y., Mahal, A. and Yip, W. (2006) Why Has China’s Economy Taken Off Faster than India’s? Pan Asia 2006 conference Stanford Center for International Development, Stanford Univer- sity, Stanford, 1-3 June 2006. [23] Ma, S. and Sood, N. (2008) A comparison of the health systems in China and India. RAND Occasional Paper 212. Rand Corporation, Santa Monica. [24] World Health Organization. (2008) World Health Statis- ![]() P. Kowal et al. / Health 3 (2011) 638-646 Copyright © 2011 SciRes. http://www.scirp.org/journal/HEALTH/Openly accessible at 646 tics 2008. World Health Organization, Geneva. [25] Wang, L., Kong, L., Fan, W., Bai, Y. and Burton, R. (2005) Preventing chronic diseases in China. Lancet, 366, 1821-1824. doi:10.1016/S0140-6736(05)67344-8 [26] Heller, P. S. (2006) Is Asia prepared for an aging popula- tion? IMF Working Paper WP/06/272. 2011. http://www.imf.org/external/pubs/ft/wp/2006/wp06272.p df [27] Park, D. (2009) Ageing Asia’s looming pension crisis. ADB Economics Working Paper Series No. 165. Asian Development Bank, Manila. |